Poverty & Inequalities Profile - Falkirk 2010 - Falkirk Council
Poverty & Inequalities Profile - Falkirk 2010 - Falkirk Council
Poverty & Inequalities Profile - Falkirk 2010 - Falkirk Council

You also want an ePaper? Increase the reach of your titles
YUMPU automatically turns print PDFs into web optimized ePapers that Google loves.
Housing in <strong>Falkirk</strong><br />
<strong>Poverty</strong> & <strong>Inequalities</strong> <strong>Profile</strong><br />
<strong>Falkirk</strong> 2009<br />
Housing & Households<br />
Current population changes have led to household changes. The number of households is increasing whilst the size<br />
of households is decreasing as more young and elderly people live alone, families are smaller, as couple chose to not<br />
to have children or to have fewer, and relationship breakdowns.<br />
The number of households in the council area has grown from 56,780 in 1991 to 68,223 in 2009, an increase of<br />
20.2% while the population has only increased by 6.5% within the same period. By 2033 it is predicted that there will<br />
be 86,410 households within the <strong>Council</strong> area.<br />
While the number of households will increase, there will also be a significant change in the household types. The<br />
number and percentage of single person households will increase substantially; by 2033 nearly 45% of all households<br />
will consist of a single person, a total of 38,050 households. There will be a consequential reduction in the number of<br />
households of two or more adults with children with a 26% decrease from 2008 to 2033.<br />
As a result of the change in the types of households, average household size will continue to fall from 2.21 persons<br />
per households in 2008 to 1.95 people per household in 2033. The Scottish average will decrease from 2.18 to 1.93 in<br />
the same period.<br />
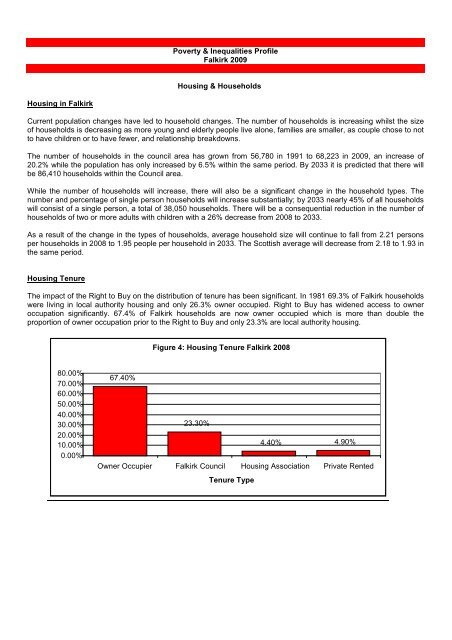
Housing Tenure<br />
The impact of the Right to Buy on the distribution of tenure has been significant. In 1981 69.3% of <strong>Falkirk</strong> households<br />
were living in local authority housing and only 26.3% owner occupied. Right to Buy has widened access to owner<br />
occupation significantly. 67.4% of <strong>Falkirk</strong> households are now owner occupied which is more than double the<br />
proportion of owner occupation prior to the Right to Buy and only 23.3% are local authority housing.<br />
80.00%<br />
70.00%<br />
60.00%<br />
50.00%<br />
40.00%<br />
30.00%<br />
20.00%<br />
10.00%<br />
0.00%<br />
67.40%<br />
Figure 4: Housing Tenure <strong>Falkirk</strong> 2008<br />
23.30%<br />
4.40% 4.90%<br />
Owner Occupier <strong>Falkirk</strong> <strong>Council</strong> Housing Association Private Rented<br />
Tenure Type