Poverty & Inequalities Profile - Falkirk 2010 - Falkirk Council
Poverty & Inequalities Profile - Falkirk 2010 - Falkirk Council
Poverty & Inequalities Profile - Falkirk 2010 - Falkirk Council

You also want an ePaper? Increase the reach of your titles
YUMPU automatically turns print PDFs into web optimized ePapers that Google loves.
Debt<br />
<strong>Poverty</strong> & <strong>Inequalities</strong> <strong>Profile</strong><br />
<strong>Falkirk</strong> 2009<br />
It is difficult to find a direct comparison to these proportions, but figures from the Scottish Household Survey 2007/08<br />
on the economic activity profile of the population aged 16+ show that:<br />
• 21% of the population were retired compared to 6% of debt clients;<br />
• 3% of the population were unemployed compared to 15% of debt clients;<br />
• 6% of the population were unable to work due to ill health compared to 23% of debt clients.<br />
Housing tenure:<br />
In spite of the high proportion of mortgage debt, only 25.6% of debt clients were owner occupiers while 47.8% rented<br />
from the <strong>Council</strong>. This compares with 67% of all households who are owner occupiers in <strong>Falkirk</strong> and 23% who are<br />
<strong>Council</strong> tenants. However, the proportion of clients who are owner occupiers increased over the period 2006-<strong>2010</strong><br />
from 21.3% in 2006/07 to 30.6% in 2009/10. This is almost certainly due to the increase in mortgage debt dealt with.<br />
The proportion of clients renting from other social landlords and privately is about twice the proportion within the<br />
population as a whole, although in both cases the percentage of all clients is around 7%. Perhaps not surprisingly,<br />
<strong>Falkirk</strong> <strong>Council</strong>’s clients were more likely to be <strong>Council</strong> tenants than the CABx clients, while non-householders and<br />
private rented tenants were more likely to have been dealt with by <strong>Falkirk</strong> and Grangemouth CABx.<br />
Ethnicity:<br />
97.5% of clients were white which is in line with the likely ethnicity breakdown of the population as a whole (the most<br />
recent ethnicity figures for the <strong>Council</strong> area are from the 2001 Census which showed just over 1% of the population<br />
from an ethnic minority). However, while half the ethnic population in 2001 was Pakistani in origin, only 0.3% of all<br />
clients were Pakistani.<br />
Disability:<br />
The figures on economic activity show that a very high proportion of debt clients are unable to work due to ill health.<br />
This is reflected in the figures on disability where 38.3% of clients had some form of long term illness or disability.<br />
This compares with 16% of the working age population in the 2001 Census who had a limiting long term illness or<br />
disability.<br />
Information is also provided on the type of disability. 17.8% of debt clients had a learning disability or a mental health<br />
problem and 9.1% a physical disability. <strong>Falkirk</strong> <strong>Council</strong> clients were more likely than CABx clients to have a disability<br />
of any type.<br />
Income:<br />
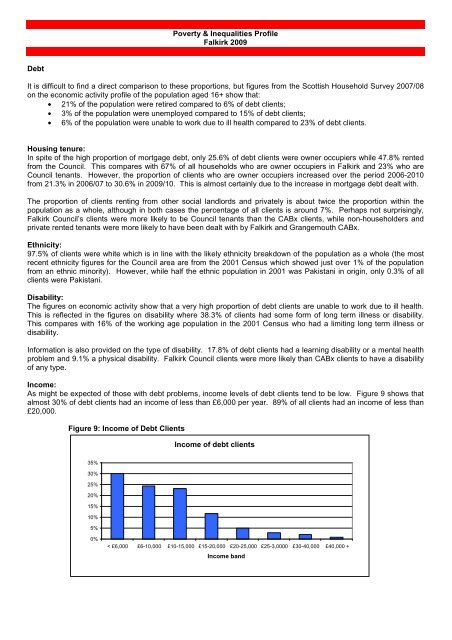
As might be expected of those with debt problems, income levels of debt clients tend to be low. Figure 9 shows that<br />
almost 30% of debt clients had an income of less than £6,000 per year. 89% of all clients had an income of less than<br />
£20,000.<br />
Figure 9: Income of Debt Clients<br />
35%<br />
30%<br />
25%<br />
20%<br />
15%<br />
10%<br />
5%<br />
0%<br />
Income of debt clients<br />
< £6,000 £6-10,000 £10-15,000 £15-20,000 £20-25,000 £25-3,0000 £30-40,000 £40,000 +<br />
Income band