Poverty & Inequalities Profile - Falkirk 2010 - Falkirk Council
Poverty & Inequalities Profile - Falkirk 2010 - Falkirk Council
Poverty & Inequalities Profile - Falkirk 2010 - Falkirk Council

You also want an ePaper? Increase the reach of your titles
YUMPU automatically turns print PDFs into web optimized ePapers that Google loves.
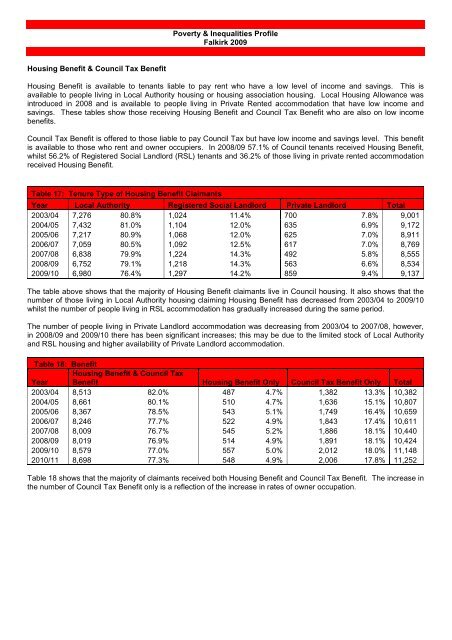
Housing Benefit & <strong>Council</strong> Tax Benefit<br />
<strong>Poverty</strong> & <strong>Inequalities</strong> <strong>Profile</strong><br />
<strong>Falkirk</strong> 2009<br />
Housing Benefit is available to tenants liable to pay rent who have a low level of income and savings. This is<br />
available to people living in Local Authority housing or housing association housing. Local Housing Allowance was<br />
introduced in 2008 and is available to people living in Private Rented accommodation that have low income and<br />
savings. These tables show those receiving Housing Benefit and <strong>Council</strong> Tax Benefit who are also on low income<br />
benefits.<br />
<strong>Council</strong> Tax Benefit is offered to those liable to pay <strong>Council</strong> Tax but have low income and savings level. This benefit<br />
is available to those who rent and owner occupiers. In 2008/09 57.1% of <strong>Council</strong> tenants received Housing Benefit,<br />
whilst 56.2% of Registered Social Landlord (RSL) tenants and 36.2% of those living in private rented accommodation<br />
received Housing Benefit.<br />
Table 17: Tenure Type of Housing Benefit Claimants<br />
Year Local Authority Registered Social Landlord Private Landlord Total<br />
2003/04 7,276 80.8% 1,024 11.4% 700 7.8% 9,001<br />
2004/05 7,432 81.0% 1,104 12.0% 635 6.9% 9,172<br />
2005/06 7,217 80.9% 1,068 12.0% 625 7.0% 8,911<br />
2006/07 7,059 80.5% 1,092 12.5% 617 7.0% 8,769<br />
2007/08 6,838 79.9% 1,224 14.3% 492 5.8% 8,555<br />
2008/09 6,752 79.1% 1,218 14.3% 563 6.6% 8,534<br />
2009/10 6,980 76.4% 1,297 14.2% 859 9.4% 9,137<br />
The table above shows that the majority of Housing Benefit claimants live in <strong>Council</strong> housing. It also shows that the<br />
number of those living in Local Authority housing claiming Housing Benefit has decreased from 2003/04 to 2009/10<br />
whilst the number of people living in RSL accommodation has gradually increased during the same period.<br />
The number of people living in Private Landlord accommodation was decreasing from 2003/04 to 2007/08, however,<br />
in 2008/09 and 2009/10 there has been significant increases; this may be due to the limited stock of Local Authority<br />
and RSL housing and higher availability of Private Landlord accommodation.<br />
Table 18: Benefit<br />
Housing Benefit & <strong>Council</strong> Tax<br />
Year Benefit Housing Benefit Only <strong>Council</strong> Tax Benefit Only Total<br />
2003/04 8,513 82.0% 487 4.7% 1,382 13.3% 10,382<br />
2004/05 8,661 80.1% 510 4.7% 1,636 15.1% 10,807<br />
2005/06 8,367 78.5% 543 5.1% 1,749 16.4% 10,659<br />
2006/07 8,246 77.7% 522 4.9% 1,843 17.4% 10,611<br />
2007/08 8,009 76.7% 545 5.2% 1,886 18.1% 10,440<br />
2008/09 8,019 76.9% 514 4.9% 1,891 18.1% 10,424<br />
2009/10 8,579 77.0% 557 5.0% 2,012 18.0% 11,148<br />
<strong>2010</strong>/11 8,698 77.3% 548 4.9% 2,006 17.8% 11,252<br />
Table 18 shows that the majority of claimants received both Housing Benefit and <strong>Council</strong> Tax Benefit. The increase in<br />
the number of <strong>Council</strong> Tax Benefit only is a reflection of the increase in rates of owner occupation.