rDNA-ITS2 Identification of Hyalomma, Rhipicephalus ... - HIKARI Ltd
rDNA-ITS2 Identification of Hyalomma, Rhipicephalus ... - HIKARI Ltd
rDNA-ITS2 Identification of Hyalomma, Rhipicephalus ... - HIKARI Ltd

You also want an ePaper? Increase the reach of your titles
YUMPU automatically turns print PDFs into web optimized ePapers that Google loves.
228 M. Abdigoudarzi et al<br />
(Figure 1 and 2). Different genera could be discriminated even on gel electrophoresis<br />
and using a ladder marker, PeqGOLD DNA-Leiter Mix (Peqlab) (Figure 1 and 2).<br />
According to the size marker the sizes for <strong>Hyalomma</strong> spp. and <strong>Rhipicephalus</strong> spp.<br />
were estimated 1200bp and 1100 bp respectively. Thirty out <strong>of</strong> fifty two <strong>of</strong> samples<br />
were selected on the basis <strong>of</strong> the quality <strong>of</strong> the bands on gel electrophoresis. They<br />
have been purified and sent for sequencing as mentioned in part 2-4 <strong>of</strong> materials and<br />
methods in this manuscript. Results are summarised in table 1.<br />
3.1. Data sequencing and alignment<br />
Accession numbers <strong>of</strong> the analysed sequences are listed in table 1. The alignements<br />
were obtained with MAFFT and obviously missaligned characters were detected and<br />
realigned by eye. Estimated mean frequencies <strong>of</strong> the 4 nucleotides were as follow:<br />
adenine 18.5%, cytosine 30.2%, thymidine 17.6% and guanine 33.7%. The<br />
transition/transversion rate ratios were estimated k1 = 2.402 (purines) and k2 = 2.812<br />
(pyrimidines). The overall transition/transversion bias is R = 1.626, where R =<br />
[A*G*k1 + T*C*k2]/[(A+G)*(T+C)] (Tamura et al., 2004). All positions containing<br />
gaps and missing data were eliminated from the data set.<br />
3.2.Intraspecific variation<br />
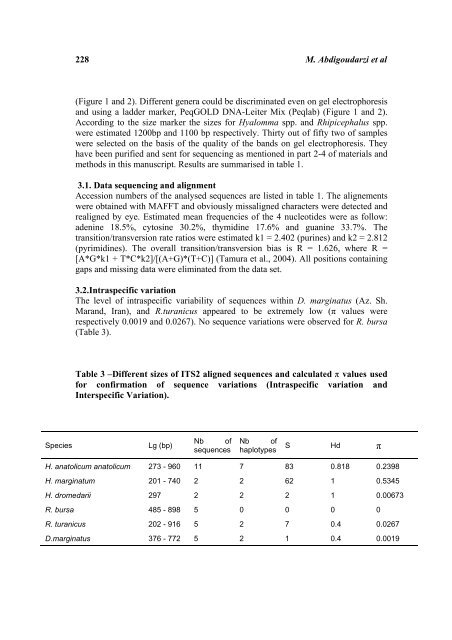
The level <strong>of</strong> intraspecific variability <strong>of</strong> sequences within D. marginatus (Az. Sh.<br />
Marand, Iran), and R.turanicus appeared to be extremely low (π values were<br />
respectively 0.0019 and 0.0267). No sequence variations were observed for R. bursa<br />
(Table 3).<br />
Table 3 –Different sizes <strong>of</strong> <strong>ITS2</strong> aligned sequences and calculated π values used<br />
for confirmation <strong>of</strong> sequence variations (Intraspecific variation and<br />
Interspecific Variation).<br />
Species Lg (bp)<br />
Nb <strong>of</strong><br />
sequences<br />
Nb <strong>of</strong><br />
haplotypes S Hd π<br />
H. anatolicum anatolicum 273 - 960 11 7 83 0.818 0.2398<br />
H. marginatum 201 - 740 2 2 62 1 0.5345<br />
H. dromedarii 297 2 2 2 1 0.00673<br />
R. bursa 485 - 898 5 0 0 0 0<br />
R. turanicus 202 - 916 5 2 7 0.4 0.0267<br />
D.marginatus 376 - 772 5 2 1 0.4 0.0019