Full Text Article - Millipore
Full Text Article - Millipore
Full Text Article - Millipore

You also want an ePaper? Increase the reach of your titles
YUMPU automatically turns print PDFs into web optimized ePapers that Google loves.
2<br />
Additionally, technical hints are given as to how to<br />
ensure reproducible high quality ultrapure water,<br />
including after each consumable change.<br />
One of the most widely trusted parameters used to<br />
track ultrapure water quality is resistivity monitoring.<br />
Previous studies: traditional HPLC profiles<br />
The quality of purified water is often questioned,<br />
when poor baselines are obtained (especially at<br />
214 nm, a wavelength which most organic<br />
contaminants absorb).<br />
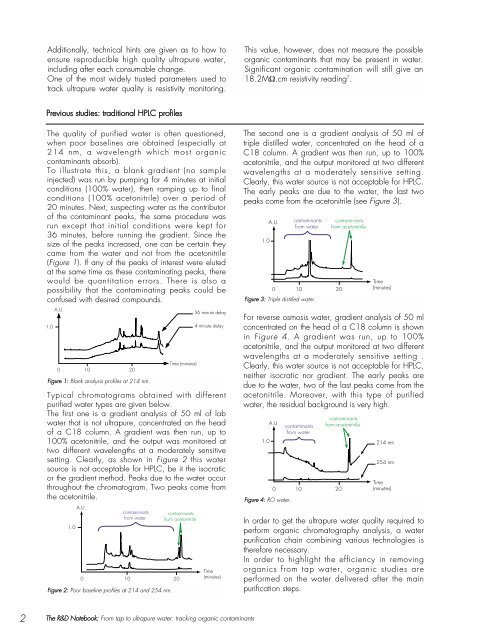
To illustrate this, a blank gradient (no sample<br />
injected) was run by pumping for 4 minutes at initial<br />
conditions (100% water), then ramping up to final<br />
conditions (100% acetonitrile) over a period of<br />
20 minutes. Next, suspecting water as the contributor<br />
of the contaminant peaks, the same procedure was<br />
run except that initial conditions were kept for<br />
36 minutes, before running the gradient. Since the<br />
size of the peaks increased, one can be certain they<br />
came from the water and not from the acetonitrile<br />
(Figure 1). If any of the peaks of interest were eluted<br />
at the same time as these contaminating peaks, there<br />
would be quantitation errors. There is also a<br />
possibility that the contaminating peaks could be<br />
confused with desired compounds.<br />
1.0<br />
A.U.<br />
0<br />
10 20<br />
Figure 1: Blank analysis profiles at 214 nm.<br />
Time (minutes)<br />
36 minute delay<br />
4 minute delay<br />
Typical chromatograms obtained with different<br />
purified water types are given below.<br />
The first one is a gradient analysis of 50 ml of lab<br />
water that is not ultrapure, concentrated on the head<br />
of a C18 column. A gradient was then run, up to<br />
100% acetonitrile, and the output was monitored at<br />
two different wavelengths at a moderately sensitive<br />
setting. Clearly, as shown in Figure 2 this water<br />
source is not acceptable for HPLC, be it the isocratic<br />
or the gradient method. Peaks due to the water occur<br />
throughout the chromatogram. Two peaks come from<br />
the acetonitrile.<br />
1.0<br />
A.U.<br />
0<br />
contaminants<br />
from water<br />
10 20<br />
Figure 2: Poor baseline profiles at 214 and 254 nm.<br />
contaminants<br />
from acetonitrile<br />
Time<br />
(minutes)<br />
The R&D Notebook: From tap to ultrapure water: tracking organic contaminants<br />
This value, however, does not measure the possible<br />
organic contaminants that may be present in water.<br />
Significant organic contamination will still give an<br />
18.2MΩ.cm resistivity reading 7 .<br />
The second one is a gradient analysis of 50 ml of<br />
triple distilled water, concentrated on the head of a<br />
C18 column. A gradient was then run, up to 100%<br />
acetonitrile, and the output monitored at two different<br />
wavelengths at a moderately sensitive setting.<br />
Clearly, this water source is not acceptable for HPLC.<br />
The early peaks are due to the water, the last two<br />
peaks come from the acetonitrile (see Figure 3).<br />
1.0<br />
A.U.<br />
0<br />
For reverse osmosis water, gradient analysis of 50 ml<br />
concentrated on the head of a C18 column is shown<br />
in Figure 4. A gradient was run, up to 100%<br />
acetonitrile, and the output monitored at two different<br />
wavelengths at a moderately sensitive setting .<br />
Clearly, this water source is not acceptable for HPLC,<br />
neither isocratic nor gradient. The early peaks are<br />
due to the water, two of the last peaks come from the<br />
acetonitrile. Moreover, with this type of purified<br />
water, the residual background is very high.<br />
A.U.<br />
0<br />
contaminants<br />
from water<br />
Figure 3: Triple distilled water.<br />
10 20<br />
contaminants<br />
from water<br />
10 20<br />
contaminants<br />
from acetonitrile<br />
contaminants<br />
from acetonitrile<br />
Time<br />
(minutes)<br />
1.0 214 nm<br />
Figure 4: RO water.<br />
254 nm<br />
Time<br />
(minutes)<br />
In order to get the ultrapure water quality required to<br />
perform organic chromatography analysis, a water<br />
purification chain combining various technologies is<br />
therefore necessary.<br />
In order to highlight the efficiency in removing<br />
organics from tap water, organic studies are<br />
performed on the water delivered after the main<br />
purification steps.