Full Text Article - Millipore
Full Text Article - Millipore
Full Text Article - Millipore

Create successful ePaper yourself
Turn your PDF publications into a flip-book with our unique Google optimized e-Paper software.
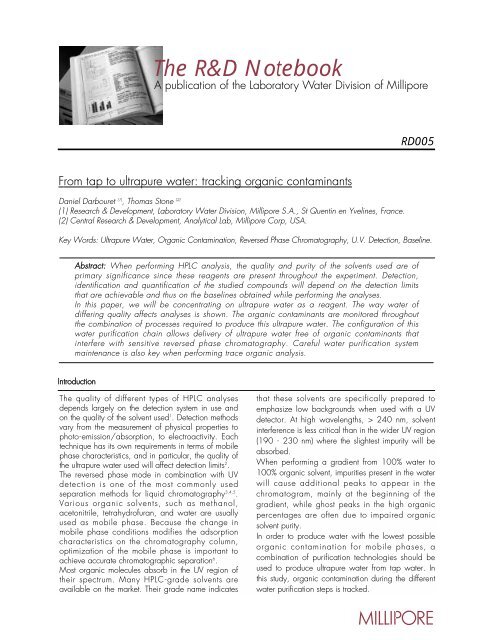
The R&D Notebook<br />
From tap to ultrapure water: tracking organic contaminants<br />
Daniel Darbouret (1) , Thomas Stone (2)<br />
(1) Research & Development, Laboratory Water Division, <strong>Millipore</strong> S.A., St Quentin en Yvelines, France.<br />
(2) Central Research & Development, Analytical Lab, <strong>Millipore</strong> Corp, USA.<br />
RD005<br />
Key Words: Ultrapure Water, Organic Contamination, Reversed Phase Chromatography, U.V. Detection, Baseline.<br />
Abstract: When performing HPLC analysis, the quality and purity of the solvents used are of<br />
primary significance since these reagents are present throughout the experiment. Detection,<br />
identification and quantification of the studied compounds will depend on the detection limits<br />
that are achievable and thus on the baselines obtained while performing the analyses.<br />
In this paper, we will be concentrating on ultrapure water as a reagent. The way water of<br />
differing quality affects analyses is shown. The organic contaminants are monitored throughout<br />
the combination of processes required to produce this ultrapure water. The configuration of this<br />
water purification chain allows delivery of ultrapure water free of organic contaminants that<br />
interfere with sensitive reversed phase chromatography. Careful water purification system<br />
maintenance is also key when performing trace organic analysis.<br />
Introduction<br />
The quality of different types of HPLC analyses<br />
depends largely on the detection system in use and<br />
on the quality of the solvent used 1 . Detection methods<br />
vary from the measurement of physical properties to<br />
photo-emission/absorption, to electroactivity. Each<br />
technique has its own requirements in terms of mobile<br />
phase characteristics, and in particular, the quality of<br />
the ultrapure water used will affect detection limits 2 .<br />
The reversed phase mode in combination with UV<br />
detection is one of the most commonly used<br />
separation methods for liquid chromatography 3,4,5 .<br />
Various organic solvents, such as methanol,<br />
acetonitrile, tetrahydrofuran, and water are usually<br />
used as mobile phase. Because the change in<br />
mobile phase conditions modifies the adsorption<br />
characteristics on the chromatography column,<br />
optimization of the mobile phase is important to<br />
achieve accurate chromatographic separation 6 .<br />
Most organic molecules absorb in the UV region of<br />
their spectrum. Many HPLC-grade solvents are<br />
available on the market. Their grade name indicates<br />
A publication of the Laboratory Water Division of <strong>Millipore</strong><br />
that these solvents are specifically prepared to<br />
emphasize low backgrounds when used with a UV<br />
detector. At high wavelengths, > 240 nm, solvent<br />
interference is less critical than in the wider UV region<br />
(190 - 230 nm) where the slightest impurity will be<br />
absorbed.<br />
When performing a gradient from 100% water to<br />
100% organic solvent, impurities present in the water<br />
will cause additional peaks to appear in the<br />
chromatogram, mainly at the beginning of the<br />
gradient, while ghost peaks in the high organic<br />
percentages are often due to impaired organic<br />
solvent purity.<br />
In order to produce water with the lowest possible<br />
organic contamination for mobile phases, a<br />
combination of purification technologies should be<br />
used to produce ultrapure water from tap water. In<br />
this study, organic contamination during the different<br />
water purification steps is tracked.
2<br />
Additionally, technical hints are given as to how to<br />
ensure reproducible high quality ultrapure water,<br />
including after each consumable change.<br />
One of the most widely trusted parameters used to<br />
track ultrapure water quality is resistivity monitoring.<br />
Previous studies: traditional HPLC profiles<br />
The quality of purified water is often questioned,<br />
when poor baselines are obtained (especially at<br />
214 nm, a wavelength which most organic<br />
contaminants absorb).<br />
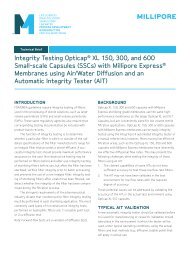
To illustrate this, a blank gradient (no sample<br />
injected) was run by pumping for 4 minutes at initial<br />
conditions (100% water), then ramping up to final<br />
conditions (100% acetonitrile) over a period of<br />
20 minutes. Next, suspecting water as the contributor<br />
of the contaminant peaks, the same procedure was<br />
run except that initial conditions were kept for<br />
36 minutes, before running the gradient. Since the<br />
size of the peaks increased, one can be certain they<br />
came from the water and not from the acetonitrile<br />
(Figure 1). If any of the peaks of interest were eluted<br />
at the same time as these contaminating peaks, there<br />
would be quantitation errors. There is also a<br />
possibility that the contaminating peaks could be<br />
confused with desired compounds.<br />
1.0<br />
A.U.<br />
0<br />
10 20<br />
Figure 1: Blank analysis profiles at 214 nm.<br />
Time (minutes)<br />
36 minute delay<br />
4 minute delay<br />
Typical chromatograms obtained with different<br />
purified water types are given below.<br />
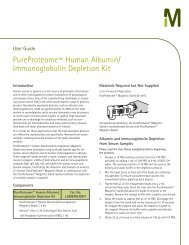
The first one is a gradient analysis of 50 ml of lab<br />
water that is not ultrapure, concentrated on the head<br />
of a C18 column. A gradient was then run, up to<br />
100% acetonitrile, and the output was monitored at<br />
two different wavelengths at a moderately sensitive<br />
setting. Clearly, as shown in Figure 2 this water<br />
source is not acceptable for HPLC, be it the isocratic<br />
or the gradient method. Peaks due to the water occur<br />
throughout the chromatogram. Two peaks come from<br />
the acetonitrile.<br />
1.0<br />
A.U.<br />
0<br />
contaminants<br />
from water<br />
10 20<br />
Figure 2: Poor baseline profiles at 214 and 254 nm.<br />
contaminants<br />
from acetonitrile<br />
Time<br />
(minutes)<br />
The R&D Notebook: From tap to ultrapure water: tracking organic contaminants<br />
This value, however, does not measure the possible<br />
organic contaminants that may be present in water.<br />
Significant organic contamination will still give an<br />
18.2MΩ.cm resistivity reading 7 .<br />
The second one is a gradient analysis of 50 ml of<br />
triple distilled water, concentrated on the head of a<br />
C18 column. A gradient was then run, up to 100%<br />
acetonitrile, and the output monitored at two different<br />
wavelengths at a moderately sensitive setting.<br />
Clearly, this water source is not acceptable for HPLC.<br />
The early peaks are due to the water, the last two<br />
peaks come from the acetonitrile (see Figure 3).<br />
1.0<br />
A.U.<br />
0<br />
For reverse osmosis water, gradient analysis of 50 ml<br />
concentrated on the head of a C18 column is shown<br />
in Figure 4. A gradient was run, up to 100%<br />
acetonitrile, and the output monitored at two different<br />
wavelengths at a moderately sensitive setting .<br />
Clearly, this water source is not acceptable for HPLC,<br />
neither isocratic nor gradient. The early peaks are<br />
due to the water, two of the last peaks come from the<br />
acetonitrile. Moreover, with this type of purified<br />
water, the residual background is very high.<br />
A.U.<br />
0<br />
contaminants<br />
from water<br />
Figure 3: Triple distilled water.<br />
10 20<br />
contaminants<br />
from water<br />
10 20<br />
contaminants<br />
from acetonitrile<br />
contaminants<br />
from acetonitrile<br />
Time<br />
(minutes)<br />
1.0 214 nm<br />
Figure 4: RO water.<br />
254 nm<br />
Time<br />
(minutes)<br />
In order to get the ultrapure water quality required to<br />
perform organic chromatography analysis, a water<br />
purification chain combining various technologies is<br />
therefore necessary.<br />
In order to highlight the efficiency in removing<br />
organics from tap water, organic studies are<br />
performed on the water delivered after the main<br />
purification steps.
Experimental<br />
Water Purification System<br />
A combination of technologies is necessary to produce<br />
ultrapure water. Methods for tracing classes of<br />
organic matter at different points in a water<br />
purification system were first described in 1987 8 .<br />
Combination techniques were also used to obtain<br />
meaningful information about contamination in the DI<br />
water process 9 . The configuration used during this<br />
qualitative study is made up of two new water<br />
purification systems. The first one combines reverse<br />
Chromatographic conditions<br />
Equipment<br />
RO reject<br />
RO permeate<br />
EDI Product Reservoir<br />
The following equipment was used throughout the<br />
experiment:<br />
HPLC pumps delivering a gradient eluent at<br />
2.0 ml/min<br />
Computer for data acquisition and system control<br />
Injector for 100 µL injection with 250 µL loop, 200 µL<br />
syringe, and appropriate vials.<br />
Detectors: Dual detectors operated at 214 nm and<br />
254 nm (Waters Corp, Milford, Mass, USA).<br />
Column Type: Waters µBondapak ® C-18 column,<br />
3.9 x 300 mm (#27324).<br />
Precolumn Type (optional): C18 (Waters µBondapak<br />
C-18 Guard-Pak TM (#T33552))<br />
Elution solvents:<br />
Water (fresh Milli-Q ® system water (<strong>Millipore</strong>))<br />
Acetonitrile (HPLC grade: J.T. Baker JT9017 or<br />
equivalent).<br />
The bottles were rinsed in 10% nitric acid, washed<br />
extensively with fresh Milli-Q system water before<br />
sampling.<br />
Figure 5: The water purification chain studied.<br />
osmosis and electrodeionization techniques. This<br />
purified water is stored in a 60 l reservoir. This high<br />
purity water tank is specifically designed for the<br />
optimization of high purity water storage 10 . A second<br />
system combining activated carbon, ion exchange<br />
resins and UV treatment is fed by this pretreated<br />
water.<br />
Sampling ports are ensured throughout the process<br />
(see arrows in Figure 5)<br />
HPLC gradient<br />
Ultrapure<br />
water<br />
The following elution gradient was used throughout<br />
the experiment. 50 ml of each water sample were<br />
injected (except for tap water and RO reject water<br />
where 1 ml was used) in order to concentrate trace<br />
impurities on the column.<br />
Time [minutes] Flow [ml/min.] Water % Acetonitrile %<br />
0.0 2.0 100 0<br />
2.0 2.0 100 0<br />
12.0 2.0 0 100<br />
15.0 2.0 0 100<br />
19.0 2.0 100 0<br />
25.0 2.0 100 0<br />
The acquisition time was fixed at 14 minutes with a<br />
4 point/second acquisition rate and a resolution<br />
over 20 bit.<br />
Chromatograms were compared at different<br />
maintenance conditions and during the different<br />
water purification stages.<br />
The R&D Notebook: From tap to ultrapure water: tracking organic contaminants 3
4<br />
Results<br />
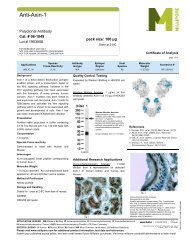
Rinsing of new consumables<br />
Rinsing of a new RO cartridge (first water purification<br />
system)<br />
When installing a new reverse osmosis cartridge in a<br />
water purification system, or when changing<br />
purification media of a polishing system, it is<br />
mandatory to allow all preservative solutions and<br />
possible leachables from materials to be rinsed out.<br />
This is why most pieces of modern equipment have an<br />
automatic rinsing and flushing time after each<br />
maintenance operation. To study the influence of this<br />
RO membrane on water quality, RO water from reject<br />
and permeate was collected at different times during<br />
the regular RO rinse cycle. The water produced during<br />
this cleaning cycle is automatically discarded by the<br />
system itself and does not go through further<br />
purification stages. Additional chromatographic<br />
profiles were obtained after 2 days and 13 days of<br />
system use. Chromatograms are those indicated in<br />
Figure 6.<br />
UV absorbance (A.U.)<br />
UV absorbance (A.U.)<br />
0.09<br />
0.08<br />
0.07<br />
0.06<br />
0.05<br />
0.04<br />
0.03<br />
0.02<br />
0.01<br />
%CH 3CN<br />
0.00<br />
0 2 4 6 8 10 12 14 16<br />
0.10<br />
0.09<br />
0.08<br />
0.07<br />
0.06<br />
0.05<br />
0.04<br />
0.03<br />
0.02<br />
0.01<br />
RO reject<br />
RO permeate<br />
Time (minutes)<br />
100 %<br />
0.00<br />
0 2 4 6 8 10 12 14 16<br />
Time (minutes)<br />
Figure 6: RO reject and RO permeate water profiles.<br />
30 min<br />
1 h 30<br />
The amount of organics released during the first<br />
30 minutes of the RO rinse is quite significant and<br />
justifies the automatic rinsing function of a new RO<br />
cartridge. The RO reject profiles also give a good<br />
indication of the best efficiency time. The amount of<br />
organic preservative solution coming off the membrane<br />
after a 2 hour rinse does not represent an amount<br />
which could impair further purification processes.<br />
The R&D Notebook: From tap to ultrapure water: tracking organic contaminants<br />
2 h<br />
3 h 30<br />
4 h<br />
30 min<br />
2 h<br />
2 h 30<br />
4 h<br />
2 days<br />
13 days<br />
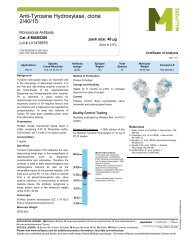
Rinsing of new purification media (final polishing<br />
system)<br />
The organic quality of the ultrapure water was<br />
checked over time during the installation procedure of<br />
a new polishing cartridge. When installing a new<br />
purification cartridge, it is mandatory to produce<br />
water for 5 minutes to the drain. Then, it is<br />
recommended to leave the system in standby mode<br />
for 6 hours. A 5 minute recirculation per hour during<br />
this period allows good hydration and final rinsing of<br />
the new purification media. After these<br />
6 hours, water is again produced to the drain for<br />
5 minutes. This installation procedure allows any<br />
remaining trace contamination and air present in the<br />
purification cartridge to be removed and ensures<br />
reproducible excellent baselines at 254 nm as well<br />
as 214 nm. Chromatograms shown in figure 7<br />
highlight this high quality water suitable for high<br />
sensitivity HPLC organic analyses. The four first<br />
chromatograms show the efficiency of the installation<br />
procedure of a new polishing cartridge. The last<br />
chromatogram is an example of the baseline that can<br />
be achieved with ultrapure water suitable for organic<br />
trace analysis at 254 or 214 nm UV detection.<br />
UV absorbance<br />
UV absorbance<br />
UV absorbance<br />
0.050<br />
0.040<br />
0.030<br />
0.020<br />
0.010<br />
0.050<br />
0.040<br />
0.030<br />
0.020<br />
0.010<br />
Milli-Q system water, 1 min air purge<br />
214NM<br />
254NM<br />
0.000<br />
0.00 4.00 8.00 12.00 16.00<br />
Gradient Time (minutes)<br />
0.050<br />
0.040<br />
0.030<br />
0.020<br />
0.010<br />
Milli-Q system water, 4 min air purge<br />
214NM<br />
254NM<br />
0.000<br />
0.00 4.00 8.00 12.00 16.00<br />
Gradient Time (minutes)<br />
Milli-Q system water, 1 min after 6 hours<br />
214NM<br />
254NM<br />
0.000<br />
0.00 4.00 8.00 12.00 16.00<br />
Gradient Time (minutes)<br />
Figure 7: Ultrapure water baselines at 254 nm and 214 nm.
UV absorbance<br />
UV absorbance<br />
From tap to ultrapure water<br />
Using the water purification chain described<br />
previously, the various sampling points enable the<br />
organic decrease through the different water<br />
purification processes to be traced. The change in<br />
organic nature during water treatment does not allow<br />
direct contaminant identification.<br />
However, chromatogram profiles obtained, and<br />
especially at 214 nm, the more sensitive wavelength,<br />
highlight organic contamination removal through the<br />
purification stages (see Figure 8). This shows the<br />
importance of having a combination of technologies<br />
when producing ultrapure water from potable water.<br />
Conclusion<br />
0.050<br />
0.040<br />
0.030<br />
0.020<br />
0.010<br />
Milli-Q system water, 6 min after 6 hours<br />
0.000<br />
0.00 4.00 8.00 12.00 16.00<br />
Gradient Time (minutes)<br />
0.050<br />
0.040<br />
0.030<br />
0.020<br />
0.010<br />
214NM<br />
254NM<br />
Milli-Q system water, day 20<br />
214NM<br />
254NM<br />
0.000<br />
0.00 4.00 8.00 12.00 16.00<br />
Gradient Time (minutes)<br />
Figure 7: Ultrapure water baselines at 254 nm and 214 nm.<br />
The presence of impurities in the mobile phase, and<br />
especially in the purified water used for HPLC studies<br />
raises several issues:<br />
- These contaminants create peaks during gradient<br />
runs. This leads to problems with peak<br />
identification and peak quantitation.<br />
- The impurities contaminate and “kill” columns.<br />
- When solutions of standards are prepared with<br />
impurities contained in ultrapure water, inaccurate<br />
results are obtained for sample identification and<br />
quantitation.<br />
- Moreover, when preparative chromatography is<br />
performed, impurities in mobile phase and/or<br />
samples prepared, can contribute to contaminated<br />
fractions.<br />
A significant number of studies have shown the<br />
importance of water quality during HPLC analysis.<br />
Storage of high purity water is inadequate and<br />
inappropriate to obtain high quality baselines 11 .<br />
A.U. (254 nm)<br />
A.U. at 214 nm<br />
0.035<br />
0.030<br />
0.025<br />
0.020<br />
0.015<br />
0.010<br />
0.005<br />
0.000<br />
0.00 5.00 10.00 15.00 20.00<br />
0.035<br />
0.030<br />
0.025<br />
0.020<br />
0.015<br />
0.010<br />
0.005<br />
Time (minutes)<br />
Figure 8: From tap to ultrapure water, chromatographic profiles at<br />
254 nm (top) and 214 nm (bottom) (1 ml injected (Tap and RO)<br />
or 50 ml accumulated (EDI, reservoir and Milli-Q) on the<br />
C18 column).<br />
More and more sensitive detection methods are<br />
being coupled to HPLC in order to improve detection<br />
limits 12,13,14 .<br />
The mobile phase in RP-HPLC generally contains a<br />
“buffer” component, an organic modifier and, often,<br />
an ion pairing agent added to the mobile phase to<br />
influence selectivity. All solvents, buffering salts, ion<br />
pairing agents, as well as the water used to prepare<br />
the mobile phases, must be of high chemical purity.<br />
A water purification chain combining multiple<br />
technologies such as electrodeionization<br />
pretreatment, UV photooxidation and high quality<br />
purification media, and ensuring easy maintenance<br />
with automatic rinsing and flushing capabilities,<br />
delivers ultrapure water suitable for high sensitivity<br />
organic analyses. Additionally, the use of an<br />
ultrapure water system with on line TOC (Total<br />
Organic Carbon) analysis is the best way to monitor<br />
these organic contaminants at the point-of-use 15 .<br />
Tap<br />
RO<br />
EDI<br />
Reservoir<br />
Milli-Q<br />
0.000<br />
0.00 2.00 4.00 6.00 8.00 10.00 12.00 14.00 16.00<br />
Time (minutes)<br />
Tap<br />
RO<br />
EDI<br />
Reservoir<br />
Milli-Q<br />
The R&D Notebook: From tap to ultrapure water: tracking organic contaminants<br />
5
6<br />
References<br />
1 Verity, I.; “Solvent Purity and the Individual Requirements of Different HPLC Detectors” LC-GC INT., Volume 8,<br />
Number 11, 652-655, 1995<br />
2 Miyabe, K.; Takeushi, S.; “Effect of Acetonitrile/Water Mobile Phase Composition on Adsorption Characteristics of<br />
Reversed Phase Liquid Chromatography” Analytical Chemistry, Volume 69, 2567-2574, 1997<br />
3 Tanaka, M.; Yamazaki, H.; “Direct Determination of Pantoprazole Enantiomers in Human Serum by Reversed-Phase<br />
High-Performance Liquid Chromatography Using a Cellulose-Based Chiral Stationary Phase and Column Switching<br />
System as a Sample Cleanup Procedure” Analytical Chemistry, Volume 69, Number 9,<br />
1513-1516, 1996<br />
4 Kuangjing Shao, L.; Locke, D.C.; “Determination of Paclitaxel and Related Taxanes in Bulk Drug and Injectable<br />
Dosage Forms by Reversed Phase Liquid Chromatography” Analytical Chemistry, Volume 69, Number 11, 2008-<br />
2016, 1997<br />
5 Corran, P.H.; “Reversed phase chromatography of proteins” in HPLC of Macromolecules. A practical approach.<br />
(ed. Oliver, R.W.A.) IRL Press, Oxford, 120-156, 1989<br />
6 McCown, S.M.; Southern, D.; Morrison, B.E.; “Solvent properties and their effects on gradient elution highperformance<br />
liquid chromatography. III Experimental findings for water and acetonitrile” Journal of Chromatography,<br />
352, 493-509, 1986<br />
7 Darbouret, D.; Ishii, N.; Kanazawa, M.; Kano, I.; “Impact of feed water quality on the production of ultrapure water“<br />
The R&D Notebook, <strong>Millipore</strong> RD004 (2000)<br />
8 Denoncourt, J.P.; Egozy, Y.; “Trace-level Analysis of High Purity Water Part III: High Performance Liquid<br />
Chromatography” Ultrapure Water January/February 1987<br />
9 Anantharaman, V.; Parekh, B.; Hegde, R.; “Detection and Characterization of Organics in Semiconductor DI Water<br />
Processes” Ultrapure Water 11(3), 30-36, 1994<br />
10 Darbouret, D.; Kano, I.; Youf, E.; Stewart, B.; “Optimizing Storage of purified water for Laboratory Applications” The<br />
R&D Notebook, <strong>Millipore</strong> RD001, 1998<br />
11 Gabler, R.; Hegde, R.; Hughes, D.; “Degradation of High Purity Water on Storage” Journal of liquid<br />
Chromatography, 6 (13), 2565-2570<br />
12 Achilli, G.; Cellerino, G.P.; Melzi d’Eril, G.; “Simultaneous determination of 27 phenols and herbicides in water by<br />
high-performance liquid chromatography with multielectrode electrochemical detection” Journal of Chromatography<br />
A, 697, 357-362, 1995<br />
13 Coquart, V.; Hennion, M.C.; “Determination of Chlorotriazines in Aqueous Environmental Samples at the ng/l Level<br />
Using Preconcentration with a Cation Exchanger and On-Line High-Performance Liquid Chromatography” Journal of<br />
Chromatography, 585, 67-73, 1991<br />
14 Somsen, G.W.; Hooyschuur, E.W.J.; Gooijer, C.; Brinkman, U.A.Th.; Velthorst, N.H.; Visser, T.; “Coupling of<br />
Reversed Phase Liquid Column Chromatography and Fourrier Transform Infrared Spectrometry Using Postcolumn On-<br />
Line Extraction and Solvent Elimination” Analytical Chemistry, 68 (5), 746-752, 1996<br />
15 Clark, K.; Retzik, M.; Darbouret, D. “Measuring TOC to maintain high-purity water” Ultrapure Water 14 (2), pp 21-24,<br />
(1997)<br />
Lit N° RD005EN00.Printed in France 12/00. Copyright © 2000 <strong>Millipore</strong> Corporation or an affiliated company.<br />
<strong>Millipore</strong>, Milli-Q are registered trademarks of <strong>Millipore</strong> Corporation or an affiliated company.<br />
WATERS & BONDAPAK are registered trademarks of Waters Corporation.<br />
Guard Pak is a trademark of Waters Corporation - J.F. Baker is a trademark of MALLINCKRODT BAKER, INC.<br />
All rights reserved.<br />
The R&D Notebook: From tap to ultrapure water: tracking organic contaminants<br />
EDITONIC- RC VERSAILLES - Tél. : 01 30 48 91 00