extended abstract P26 - MMM
extended abstract P26 - MMM
extended abstract P26 - MMM

Create successful ePaper yourself
Turn your PDF publications into a flip-book with our unique Google optimized e-Paper software.
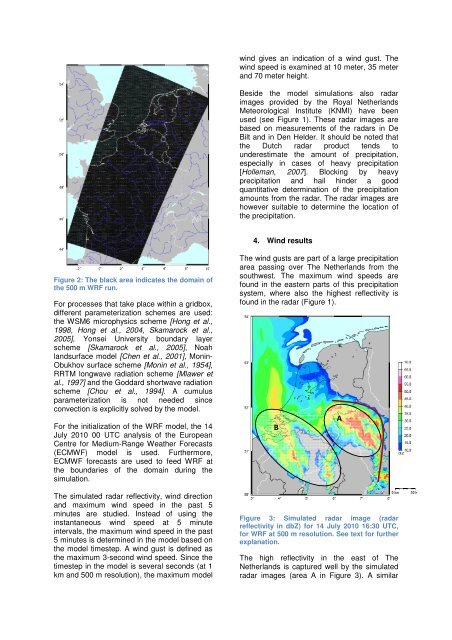
Figure 2: The black area indicates the domain of<br />
the 500 m WRF run.<br />
For processes that take place within a gridbox,<br />
different parameterization schemes are used:<br />
the WSM6 microphysics scheme [Hong et al.,<br />
1998, Hong et al., 2004, Skamarock et al.,<br />
2005], Yonsei University boundary layer<br />
scheme [Skamarock et al., 2005], Noah<br />
landsurface model [Chen et al., 2001], Monin-<br />
Obukhov surface scheme [Monin et al., 1954],<br />
RRTM longwave radiation scheme [Mlawer et<br />
al., 1997] and the Goddard shortwave radiation<br />
scheme [Chou et al., 1994]. A cumulus<br />
parameterization is not needed since<br />
convection is explicitly solved by the model.<br />
For the initialization of the WRF model, the 14<br />
July 2010 00 UTC analysis of the European<br />
Centre for Medium-Range Weather Forecasts<br />
(ECMWF) model is used. Furthermore,<br />
ECMWF forecasts are used to feed WRF at<br />
the boundaries of the domain during the<br />
simulation.<br />
The simulated radar reflectivity, wind direction<br />
and maximum wind speed in the past 5<br />
minutes are studied. Instead of using the<br />
instantaneous wind speed at 5 minute<br />
intervals, the maximum wind speed in the past<br />
5 minutes is determined in the model based on<br />
the model timestep. A wind gust is defined as<br />
the maximum 3-second wind speed. Since the<br />
timestep in the model is several seconds (at 1<br />
km and 500 m resolution), the maximum model<br />
wind gives an indication of a wind gust. The<br />
wind speed is examined at 10 meter, 35 meter<br />
and 70 meter height.<br />
Beside the model simulations also radar<br />
images provided by the Royal Netherlands<br />
Meteorological Institute (KNMI) have been<br />
used (see Figure 1). These radar images are<br />
based on measurements of the radars in De<br />
Bilt and in Den Helder. It should be noted that<br />
the Dutch radar product tends to<br />
underestimate the amount of precipitation,<br />
especially in cases of heavy precipitation<br />
[Holleman, 2007]. Blocking by heavy<br />
precipitation and hail hinder a good<br />
quantitative determination of the precipitation<br />
amounts from the radar. The radar images are<br />
however suitable to determine the location of<br />
the precipitation.<br />
4. Wind results<br />
The wind gusts are part of a large precipitation<br />
area passing over The Netherlands from the<br />
southwest. The maximum wind speeds are<br />
found in the eastern parts of this precipitation<br />
system, where also the highest reflectivity is<br />
found in the radar (Figure 1).<br />
B<br />
A<br />
Figure 3: Simulated radar image (radar<br />
reflectivity in dbZ) for 14 July 2010 16:30 UTC,<br />
for WRF at 500 m resolution. See text for further<br />
explanation.<br />
The high reflectivity in the east of The<br />
Netherlands is captured well by the simulated<br />
radar images (area A in Figure 3). A similar