extended abstract P26 - MMM
extended abstract P26 - MMM
extended abstract P26 - MMM

Create successful ePaper yourself
Turn your PDF publications into a flip-book with our unique Google optimized e-Paper software.
A 500m WRF hindcast of a microburst event in The Netherlands<br />
1. Introduction<br />
Daniel van Dijke, Yvonne Hinssen, Floris Bijlsma<br />
Meteo Group<br />
Corresponding email address: vandijke@meteogroup.com<br />
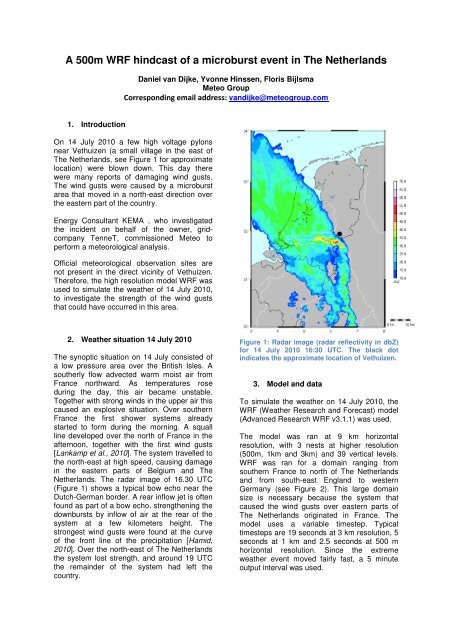
On 14 July 2010 a few high voltage pylons<br />
near Vethuizen (a small village in the east of<br />
The Netherlands, see Figure 1 for approximate<br />
location) were blown down. This day there<br />
were many reports of damaging wind gusts.<br />
The wind gusts were caused by a microburst<br />
area that moved in a north-east direction over<br />
the eastern part of the country.<br />
Energy Consultant KEMA , who investigated<br />
the incident on behalf of the owner, gridcompany<br />
TenneT, commissioned Meteo to<br />
perform a meteorological analysis.<br />
Official meteorological observation sites are<br />
not present in the direct vicinity of Vethuizen.<br />
Therefore, the high resolution model WRF was<br />
used to simulate the weather of 14 July 2010,<br />
to investigate the strength of the wind gusts<br />
that could have occurred in this area.<br />
2. Weather situation 14 July 2010<br />
The synoptic situation on 14 July consisted of<br />
a low pressure area over the British Isles. A<br />
southerly flow advected warm moist air from<br />
France northward. As temperatures rose<br />
during the day, this air became unstable.<br />
Together with strong winds in the upper air this<br />
caused an explosive situation. Over southern<br />
France the first shower systems already<br />
started to form during the morning. A squall<br />
line developed over the north of France in the<br />
afternoon, together with the first wind gusts<br />
[Lankamp et al., 2010]. The system travelled to<br />
the north-east at high speed, causing damage<br />
in the eastern parts of Belgium and The<br />
Netherlands. The radar image of 16.30 UTC<br />
(Figure 1) shows a typical bow echo near the<br />
Dutch-German border. A rear inflow jet is often<br />
found as part of a bow echo, strengthening the<br />
downbursts by inflow of air at the rear of the<br />
system at a few kilometers height. The<br />
strongest wind gusts were found at the curve<br />
of the front line of the precipitation [Hamid,<br />
2010]. Over the north-east of The Netherlands<br />
the system lost strength, and around 19 UTC<br />
the remainder of the system had left the<br />
country.<br />
Figure 1: Radar image (radar reflectivity in dbZ)<br />
for 14 July 2010 16:30 UTC. The black dot<br />
indicates the approximate location of Vethuizen.<br />
3. Model and data<br />
To simulate the weather on 14 July 2010, the<br />
WRF (Weather Research and Forecast) model<br />
(Advanced Research WRF v3.1.1) was used.<br />
The model was ran at 9 km horizontal<br />
resolution, with 3 nests at higher resolution<br />
(500m, 1km and 3km) and 39 vertical levels.<br />
WRF was ran for a domain ranging from<br />
southern France to north of The Netherlands<br />
and from south-east England to western<br />
Germany (see Figure 2). This large domain<br />
size is necessary because the system that<br />
caused the wind gusts over eastern parts of<br />
The Netherlands originated in France. The<br />
model uses a variable timestep. Typical<br />
timesteps are 19 seconds at 3 km resolution, 5<br />
seconds at 1 km and 2.5 seconds at 500 m<br />
horizontal resolution. Since the extreme<br />
weather event moved fairly fast, a 5 minute<br />
output interval was used.
Figure 2: The black area indicates the domain of<br />
the 500 m WRF run.<br />
For processes that take place within a gridbox,<br />
different parameterization schemes are used:<br />
the WSM6 microphysics scheme [Hong et al.,<br />
1998, Hong et al., 2004, Skamarock et al.,<br />
2005], Yonsei University boundary layer<br />
scheme [Skamarock et al., 2005], Noah<br />
landsurface model [Chen et al., 2001], Monin-<br />
Obukhov surface scheme [Monin et al., 1954],<br />
RRTM longwave radiation scheme [Mlawer et<br />
al., 1997] and the Goddard shortwave radiation<br />
scheme [Chou et al., 1994]. A cumulus<br />
parameterization is not needed since<br />
convection is explicitly solved by the model.<br />
For the initialization of the WRF model, the 14<br />
July 2010 00 UTC analysis of the European<br />
Centre for Medium-Range Weather Forecasts<br />
(ECMWF) model is used. Furthermore,<br />
ECMWF forecasts are used to feed WRF at<br />
the boundaries of the domain during the<br />
simulation.<br />
The simulated radar reflectivity, wind direction<br />
and maximum wind speed in the past 5<br />
minutes are studied. Instead of using the<br />
instantaneous wind speed at 5 minute<br />
intervals, the maximum wind speed in the past<br />
5 minutes is determined in the model based on<br />
the model timestep. A wind gust is defined as<br />
the maximum 3-second wind speed. Since the<br />
timestep in the model is several seconds (at 1<br />
km and 500 m resolution), the maximum model<br />
wind gives an indication of a wind gust. The<br />
wind speed is examined at 10 meter, 35 meter<br />
and 70 meter height.<br />
Beside the model simulations also radar<br />
images provided by the Royal Netherlands<br />
Meteorological Institute (KNMI) have been<br />
used (see Figure 1). These radar images are<br />
based on measurements of the radars in De<br />
Bilt and in Den Helder. It should be noted that<br />
the Dutch radar product tends to<br />
underestimate the amount of precipitation,<br />
especially in cases of heavy precipitation<br />
[Holleman, 2007]. Blocking by heavy<br />
precipitation and hail hinder a good<br />
quantitative determination of the precipitation<br />
amounts from the radar. The radar images are<br />
however suitable to determine the location of<br />
the precipitation.<br />
4. Wind results<br />
The wind gusts are part of a large precipitation<br />
area passing over The Netherlands from the<br />
southwest. The maximum wind speeds are<br />
found in the eastern parts of this precipitation<br />
system, where also the highest reflectivity is<br />
found in the radar (Figure 1).<br />
B<br />
A<br />
Figure 3: Simulated radar image (radar<br />
reflectivity in dbZ) for 14 July 2010 16:30 UTC,<br />
for WRF at 500 m resolution. See text for further<br />
explanation.<br />
The high reflectivity in the east of The<br />
Netherlands is captured well by the simulated<br />
radar images (area A in Figure 3). A similar
pattern is found for all horizontal resolutions.<br />
The WRF model is capable to simulate the<br />
typical bow structure in the radar images (red<br />
line in Figure 3). Compared to reality, the<br />
location of the southerly part of the bow is<br />
more towards the east in the model. The bow<br />
is less sharp in the model than in the<br />
measured radar images. The intensity is<br />
somewhat stronger in WRF than in reality,<br />
possibly related to the underestimation of the<br />
Dutch radar. The simulated images show a<br />
second system with heavy precipitation (area B<br />
in Figure 3), which is less intense and rotated<br />
somewhat more to the north in reality.<br />
However, this second system is not<br />
accompanied by strong winds, which makes it<br />
less relevant for the present study.<br />
To examine the timing of the system, the<br />
passage of maximum wind speeds at 10 meter<br />
height in the surroundings of Vethuizen is<br />
studied. This passage is around 16.15 UTC.<br />
The radar reflectivity over Vethuizen also<br />
attains a maximum around 16.15 UTC in the<br />
model, while this is around 16.40 UTC in the<br />
measured radar images.<br />
Figure 4: Wind direction (vectors) and maximum<br />
wind speed (in m/s, colors) during the last 5<br />
minutes for 14 July 2010 16.15 UTC at 10 meter<br />
height for WRF at 1 km resolution.<br />
The occurrence of a certain precipitation<br />
system or wind field in the WRF model should<br />
not be seen as an exact solution for the<br />
weather on 14 July 2010. The occurrence of<br />
certain weather phenomena within a large<br />
scale structure in WRF gives an indication of<br />
the physical possibility of these phenomena,<br />
but not of the exact location. Small changes in<br />
the initial condition or land use and topography<br />
could cause a shift in time or space of a certain<br />
system.<br />
The structure of the system is also seen in the<br />
model wind speed, which shows high values in<br />
a narrow band at the front of the precipitating<br />
system (see Figure 4). For a certain location<br />
the duration of the passage with highest wind<br />
speeds is limited to a few minutes. These<br />
maximum wind speeds can be quite local, and<br />
seem to be organized in lines.<br />
These line structures are visible in Figure 5,<br />
which shows the maximum wind speed<br />
between 14 and 22 UTC in the 1 km run at 10<br />
meter height. This figure basically gives an<br />
indication of the progression of the maximum<br />
wind speed in time, since the system passes<br />
over the country in a few hours. These line<br />
structures are also present in the 500 m run,<br />
but practically absent in the 3 km run.<br />
Apparently the highest wind speeds occur with<br />
individual showers within the system, that<br />
persist up to 2 hours and are not resolved by<br />
the model at 3 km resolution. A model at very<br />
high resolution is thus required to obtain an<br />
indication of the strength of wind gusts. WRF<br />
at 1 km or 500 m resolution is suitable for this.<br />
Figure 5: Maximum wind speed (in m/s)<br />
between 14 and 22 UTC at 10 meter height,<br />
for WRF at 1 km resolution.<br />
The maximum wind speeds in the model are of<br />
comparable strength for the 1 km and 500 m<br />
runs, while lower maxima are obtained in the 3<br />
km run. The maximum wind speed occurs in<br />
the 1 km run and amounts to 134 km/hour (~37<br />
m/s) at 10 meter height. Turbulent structures at
smaller scales than solved by the model, like<br />
mesovortices, could lead to additional local<br />
intensifications of the wind speed [Hamid,<br />
2010]. That the maximum wind speed is found<br />
in the 1 km model run is probably related to<br />
different initial conditions and a different<br />
development of precipitating systems in the 1<br />
km and 500 m runs. Similar wind speed<br />
maxima could however occur in the 500 m run.<br />
The present study does not indicate whether<br />
the results of the 500 m run are more realistic<br />
than those of the 1 km run.<br />
During the passage of the highest wind speeds<br />
near Vethuizen, the wind direction varied from<br />
southwesterly in the east of the precipitation<br />
system to more south-southeasterly in the west<br />
of the system (Figure 4). This is typical for a<br />
downburst connected to a squall line. The<br />
southwesterly flow is perpendicular to the<br />
orientation of the high voltage line Doetinchem-<br />
Ulft (the pylons that were blown down<br />
belonged to this line).<br />
The wind patterns that are found at 35 and 70<br />
meter height are similar in structure to the<br />
pattern at 10 meter, but with higher wind<br />
speeds (maxima of 160 km/h at 35 m and 171<br />
km/h at 70 m).<br />
5. Summary and conclusion<br />
WRF seems capable of simulating the complex<br />
weather of 14 July 2010. The shape (e.g. the<br />
bow echo structure), intensity and timing of the<br />
precipitation system were resolved quite well<br />
by WRF. Compared with the observed radar,<br />
the location of the extreme weather system<br />
was simulated a little more to the east. The<br />
simulation results showed a large area,<br />
spreading from west to east, with high wind<br />
speeds that moved rapidly towards the north<br />
east. The high resolution runs (500 m and 1<br />
km) revealed micro-burst structures in<br />
combination with streaks of high wind speed.<br />
The maximum simulated wind speed at 10<br />
meter height is about 134 km/h. The wind<br />
patterns at 35 and 70 meter are similar in<br />
shape, only the wind speed increases with<br />
height. During the passage of the bow echo<br />
near Vethuizen, the simulated wind direction<br />
was south-southwest, and this is in agreement<br />
with the observed damage.<br />
To conclude, WRF has proven its potential in<br />
resolving the complex weather system down to<br />
the scale of micro bursts. The maximum wind<br />
speed in the model exceeded 130 km/h at 10<br />
meter height and 170 km/h at 70 meter height.<br />
It can thus be concluded that it is<br />
meteorologically possible that wind speeds of<br />
this order of magnitude occurred in the<br />
surroundings of Vethuizen on 14 July 2010.<br />
References<br />
Chen, F., Dudhia, J., 2001. Coupling an advanced<br />
land-surface/ hydrology model with the Penn<br />
State/ NCAR MM5 modeling system. Part I:<br />
Model description and implementation,<br />
Monthly Weather Review, 129, 569–585.<br />
Chou, M.D., Suarez, M.J., Liang, X.Z., Yan, M.,<br />
1994. An Efficient Thermal Infrared Radiation<br />
Parameterization for Use in General<br />
Circulation Models, Technical Report Series on<br />
Global Modeling and Data Assimilation, NASA<br />
Technical Memorandum 104606, 3.<br />
Hamid, K., 2010. Klimatologie en morfologie van<br />
MCSs in Belgie, Meteorologica, 19 (3) (in<br />
Dutch).<br />
Holleman, I., 2007. Bias adjustment and long-term<br />
verification of radar-based precipitation<br />
estimates, Meteorological Applications, 14,<br />
195-203.<br />
Hong, S.Y., Dudhia, J., Chen, S.H., 2004. A<br />
Revised Approach to Ice Microphysical<br />
Processes for the Bulk Parameterization of<br />
Clouds and Precipitation, Monthly Weather<br />
Review, 132, 103-120.<br />
Hong, S.Y., Juang, H.M.H., Zhao, Q., 1998.<br />
Implementation of prognostic cloud scheme for<br />
a regional spectral model, Monthly Weather<br />
Review, 126, 2621-2639.<br />
Lankamp, B., Voerman, S., Nienhuis, H., 2010.<br />
Onweersoverzicht 14 juli: Derecho,<br />
omgeblazen hoogspanningsmasten, doden en<br />
zeer plaatselijk flinke schade, Weerspiegel, 37<br />
(9), 15-17 (in Dutch).<br />
Mlawer, E.J., Taubman, S.J., Brown, P.D., Iacono,<br />
M.J., Clough, S.A., 1997. Radiative transfer for<br />
inhomogeneous atmosphere. RRTM, a<br />
validated correlated-k model for the longwave,<br />
Journal of Geophysical Research -<br />
Atmospheres, 102, 16663–16682.<br />
Monin, A.S., Obukhov, A.M., 1954. Osnovnye<br />
zakonomernosti turbulentnogo<br />
peremeshivaniia v prizemnom sloe atmosfery,<br />
Akademii´a nauk SSSR, Geofizicheskii<br />
institute, USSR, Translated version by; Miller,<br />
J., 1959. Basic laws of turbulent mixing in the<br />
ground layer of the atmosphere, American<br />
meteorological Society, Cambridge, Boston,<br />
42pp, USA.<br />
Skamarock, W.C., Klemp, J.B., Dudhia, J., Gill,<br />
D.O., Barker, D.M., Wang, W., Powers, J.G.,<br />
2005. A Description of the Advanced Research<br />
WRF Version 2, NCAR Technical Note, June<br />
2005.