Appendix G - Clemson University
Appendix G - Clemson University
Appendix G - Clemson University

You also want an ePaper? Increase the reach of your titles
YUMPU automatically turns print PDFs into web optimized ePapers that Google loves.
G-34 ■ <strong>Appendix</strong> G Vector Processors<br />
Processor Compiler<br />
Completely<br />
vectorized<br />
Partially<br />
vectorized<br />
Not<br />
vectorized<br />
CDC CYBER 205 VAST-2 V2.21 62 5 33<br />
Convex C-series FC5.0 69 5 26<br />
Cray X-MP CFT77 V3.0 69 3 28<br />
Cray X-MP CFT V1.15 50 1 49<br />
Cray-2 CFT2 V3.1a 27 1 72<br />
ETA-10 FTN 77 V1.0 62 7 31<br />
Hitachi S810/820 FORT77/HAP V20-2B 67 4 29<br />
IBM 3090/VF VS FORTRAN V2.4 52 4 44<br />
NEC SX/2 FORTRAN77 / SX V.040 66 5 29<br />
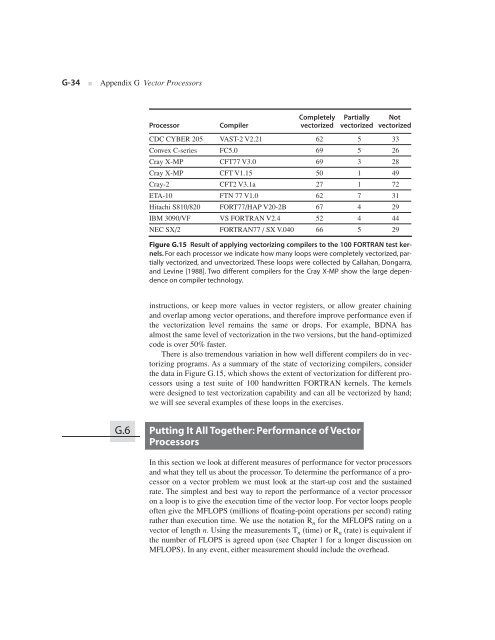
Figure G.15 Result of applying vectorizing compilers to the 100 FORTRAN test kernels.<br />
For each processor we indicate how many loops were completely vectorized, partially<br />
vectorized, and unvectorized. These loops were collected by Callahan, Dongarra,<br />
and Levine [1988]. Two different compilers for the Cray X-MP show the large dependence<br />
on compiler technology.<br />
instructions, or keep more values in vector registers, or allow greater chaining<br />
and overlap among vector operations, and therefore improve performance even if<br />
the vectorization level remains the same or drops. For example, BDNA has<br />
almost the same level of vectorization in the two versions, but the hand-optimized<br />
code is over 50% faster.<br />
There is also tremendous variation in how well different compilers do in vectorizing<br />
programs. As a summary of the state of vectorizing compilers, consider<br />
the data in Figure G.15, which shows the extent of vectorization for different processors<br />
using a test suite of 100 handwritten FORTRAN kernels. The kernels<br />
were designed to test vectorization capability and can all be vectorized by hand;<br />
we will see several examples of these loops in the exercises.<br />
G.6 Putting It All Together: Performance of Vector<br />
Processors<br />
In this section we look at different measures of performance for vector processors<br />
and what they tell us about the processor. To determine the performance of a processor<br />
on a vector problem we must look at the start-up cost and the sustained<br />
rate. The simplest and best way to report the performance of a vector processor<br />
on a loop is to give the execution time of the vector loop. For vector loops people<br />
often give the MFLOPS (millions of floating-point operations per second) rating<br />
rather than execution time. We use the notation R n for the MFLOPS rating on a<br />
vector of length n. Using the measurements T n (time) or R n (rate) is equivalent if<br />
the number of FLOPS is agreed upon (see Chapter 1 for a longer discussion on<br />
MFLOPS). In any event, either measurement should include the overhead.