Changing Landscapes: Recent Immigrants Living in York Region
Changing Landscapes: Recent Immigrants Living in York Region
Changing Landscapes: Recent Immigrants Living in York Region
You also want an ePaper? Increase the reach of your titles
YUMPU automatically turns print PDFs into web optimized ePapers that Google loves.
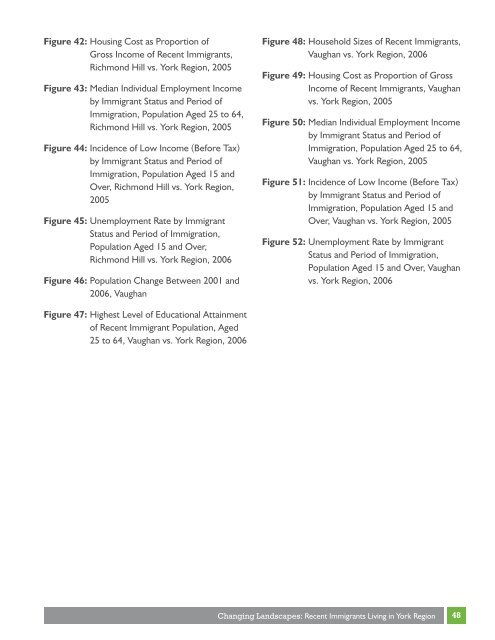
Figure 42: Hous<strong>in</strong>g Cost as Proportion of<br />
Gross Income of <strong>Recent</strong> <strong>Immigrants</strong>,<br />
Richmond Hill vs. <strong>York</strong> <strong>Region</strong>, 2005<br />
Figure 43: Median Individual Employment Income<br />
by Immigrant Status and Period of<br />
Immigration, Population Aged 25 to 64,<br />
Richmond Hill vs. <strong>York</strong> <strong>Region</strong>, 2005<br />
Figure 44: Incidence of Low Income (Before Tax)<br />
by Immigrant Status and Period of<br />
Immigration, Population Aged 15 and<br />
Over, Richmond Hill vs. <strong>York</strong> <strong>Region</strong>,<br />
2005<br />
Figure 45: Unemployment Rate by Immigrant<br />
Status and Period of Immigration,<br />
Population Aged 15 and Over,<br />
Richmond Hill vs. <strong>York</strong> <strong>Region</strong>, 2006<br />
Figure 46: Population Change Between 2001 and<br />
2006, Vaughan<br />
Figure 47: Highest Level of Educational Atta<strong>in</strong>ment<br />
of <strong>Recent</strong> Immigrant Population, Aged<br />
25 to 64, Vaughan vs. <strong>York</strong> <strong>Region</strong>, 2006<br />
Figure 48: Household Sizes of <strong>Recent</strong> <strong>Immigrants</strong>,<br />
Vaughan vs. <strong>York</strong> <strong>Region</strong>, 2006<br />
Figure 49: Hous<strong>in</strong>g Cost as Proportion of Gross<br />
Income of <strong>Recent</strong> <strong>Immigrants</strong>, Vaughan<br />
vs. <strong>York</strong> <strong>Region</strong>, 2005<br />
Figure 50: Median Individual Employment Income<br />
by Immigrant Status and Period of<br />
Immigration, Population Aged 25 to 64,<br />
Vaughan vs. <strong>York</strong> <strong>Region</strong>, 2005<br />
Figure 51: Incidence of Low Income (Before Tax)<br />
by Immigrant Status and Period of<br />
Immigration, Population Aged 15 and<br />
Over, Vaughan vs. <strong>York</strong> <strong>Region</strong>, 2005<br />
Figure 52: Unemployment Rate by Immigrant<br />
Status and Period of Immigration,<br />
Population Aged 15 and Over, Vaughan<br />
vs. <strong>York</strong> <strong>Region</strong>, 2006<br />
<strong>Chang<strong>in</strong>g</strong> <strong>Landscapes</strong>: <strong>Recent</strong> <strong>Immigrants</strong> <strong>Liv<strong>in</strong>g</strong> <strong>in</strong> <strong>York</strong> <strong>Region</strong><br />
48


