

Changing Landscapes: Recent Immigrants Living in York Region
Changing Landscapes: Recent Immigrants Living in York Region
Changing Landscapes: Recent Immigrants Living in York Region

Create successful ePaper yourself
Turn your PDF publications into a flip-book with our unique Google optimized e-Paper software.
Town of Aurora<br />
Demographics:<br />
» In 2006, 47,035 people lived <strong>in</strong> Aurora and<br />
22 per cent of them were immigrants.<br />
» In 2006, there were 1,285 recent immigrants<br />
liv<strong>in</strong>g <strong>in</strong> Aurora, which represented almost<br />
three per cent of <strong>York</strong> <strong>Region</strong>’s recent immigrant<br />
population. Aurora had the smallest number<br />
of recent immigrants among the five local<br />
municipalities be<strong>in</strong>g profiled.<br />
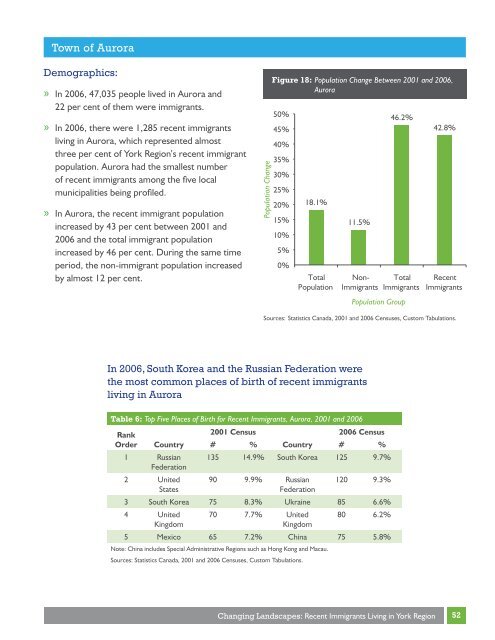
» In Aurora, the recent immigrant population<br />
<strong>in</strong>creased by 43 per cent between 2001 and<br />
2006 and the total immigrant population<br />
<strong>in</strong>creased by 46 per cent. Dur<strong>in</strong>g the same time<br />
period, the non-immigrant population <strong>in</strong>creased<br />
by almost 12 per cent.<br />
Figure 18: Population Change Between 2001 and 2006,<br />
Aurora<br />
Sources: Statistics Canada, 2001 and 2006 Censuses, Custom Tabulations.<br />
In 2006, South Korea and the Russian Federation were<br />
the most common places of birth of recent immigrants<br />
liv<strong>in</strong>g <strong>in</strong> Aurora<br />
Population Change<br />
50%<br />
45%<br />
40%<br />
35%<br />
30%<br />
25%<br />
20%<br />
15%<br />
10%<br />
5%<br />
0%<br />
18.1%<br />
Total<br />
Population<br />
11.5%<br />
Non-<br />
<strong>Immigrants</strong><br />
Table 6: Top Five Places of Birth for <strong>Recent</strong> <strong>Immigrants</strong>, Aurora, 2001 and 2006<br />
Rank<br />
Order<br />
46.2%<br />
Total<br />
<strong>Immigrants</strong><br />
Population Group<br />
2001 Census 2006 Census<br />
Country # % Country # %<br />
1 Russian<br />
Federation<br />
2 United<br />
States<br />
135 14.9% South Korea 125 9.7%<br />
90 9.9% Russian<br />
Federation<br />
120 9.3%<br />
3 South Korea 75 8.3% Ukra<strong>in</strong>e 85 6.6%<br />
4 United 70 7.7% United 80 6.2%<br />
K<strong>in</strong>gdom<br />
K<strong>in</strong>gdom<br />
5 Mexico 65 7.2% Ch<strong>in</strong>a 75 5.8%<br />
Note: Ch<strong>in</strong>a <strong>in</strong>cludes Special Adm<strong>in</strong>istrative <strong>Region</strong>s such as Hong Kong and Macau.<br />
Sources: Statistics Canada, 2001 and 2006 Censuses, Custom Tabulations.<br />
<strong>Chang<strong>in</strong>g</strong> <strong>Landscapes</strong>: <strong>Recent</strong> <strong>Immigrants</strong> <strong>Liv<strong>in</strong>g</strong> <strong>in</strong> <strong>York</strong> <strong>Region</strong><br />
42.8%<br />
<strong>Recent</strong><br />
<strong>Immigrants</strong><br />
52


