Changing Landscapes: Recent Immigrants Living in York Region
Changing Landscapes: Recent Immigrants Living in York Region
Changing Landscapes: Recent Immigrants Living in York Region
You also want an ePaper? Increase the reach of your titles
YUMPU automatically turns print PDFs into web optimized ePapers that Google loves.
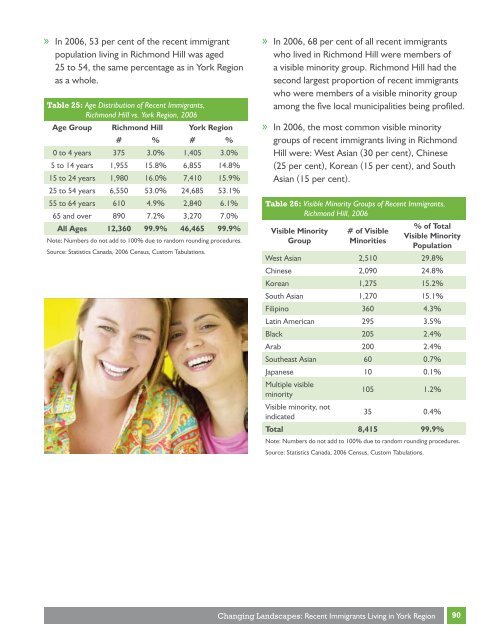
» In 2006, 53 per cent of the recent immigrant<br />
population liv<strong>in</strong>g <strong>in</strong> Richmond Hill was aged<br />
25 to 54, the same percentage as <strong>in</strong> <strong>York</strong> <strong>Region</strong><br />
as a whole.<br />
Table 25: Age Distribution of <strong>Recent</strong> <strong>Immigrants</strong>,<br />
Richmond Hill vs. <strong>York</strong> <strong>Region</strong>, 2006<br />
Age Group Richmond Hill <strong>York</strong> <strong>Region</strong><br />
# % # %<br />
0 to 4 years 375 3.0% 1,405 3.0%<br />
5 to 14 years 1,955 15.8% 6,855 14.8%<br />
15 to 24 years 1,980 16.0% 7,410 15.9%<br />
25 to 54 years 6,550 53.0% 24,685 53.1%<br />
55 to 64 years 610 4.9% 2,840 6.1%<br />
65 and over 890 7.2% 3,270 7.0%<br />
All Ages 12,360 99.9% 46,465 99.9%<br />
Note: Numbers do not add to 100% due to random round<strong>in</strong>g procedures.<br />
Source: Statistics Canada, 2006 Census, Custom Tabulations.<br />
» In 2006, 68 per cent of all recent immigrants<br />
who lived <strong>in</strong> Richmond Hill were members of<br />
a visible m<strong>in</strong>ority group. Richmond Hill had the<br />
second largest proportion of recent immigrants<br />
who were members of a visible m<strong>in</strong>ority group<br />
among the five local municipalities be<strong>in</strong>g profiled.<br />
» In 2006, the most common visible m<strong>in</strong>ority<br />
groups of recent immigrants liv<strong>in</strong>g <strong>in</strong> Richmond<br />
Hill were: West Asian (30 per cent), Ch<strong>in</strong>ese<br />
(25 per cent), Korean (15 per cent), and South<br />
Asian (15 per cent).<br />
Table 26: Visible M<strong>in</strong>ority Groups of <strong>Recent</strong> <strong>Immigrants</strong>,<br />
Richmond Hill, 2006<br />
Visible M<strong>in</strong>ority<br />
Group<br />
# of Visible<br />
M<strong>in</strong>orities<br />
% of Total<br />
Visible M<strong>in</strong>ority<br />
Population<br />
West Asian 2,510 29.8%<br />
Ch<strong>in</strong>ese 2,090 24.8%<br />
Korean 1,275 15.2%<br />
South Asian 1,270 15.1%<br />
Filip<strong>in</strong>o 360 4.3%<br />
Lat<strong>in</strong> American 295 3.5%<br />
Black 205 2.4%<br />
Arab 200 2.4%<br />
Southeast Asian 60 0.7%<br />
Japanese 10 0.1%<br />
Multiple visible<br />
m<strong>in</strong>ority<br />
105 1.2%<br />
Visible m<strong>in</strong>ority, not<br />
<strong>in</strong>dicated<br />
35 0.4%<br />
Total 8,415 99.9%<br />
Note: Numbers do not add to 100% due to random round<strong>in</strong>g procedures.<br />
Source: Statistics Canada, 2006 Census, Custom Tabulations.<br />
<strong>Chang<strong>in</strong>g</strong> <strong>Landscapes</strong>: <strong>Recent</strong> <strong>Immigrants</strong> <strong>Liv<strong>in</strong>g</strong> <strong>in</strong> <strong>York</strong> <strong>Region</strong><br />
90


