

PDF: 3548 KB - Bureau of Infrastructure, Transport and Regional ...
PDF: 3548 KB - Bureau of Infrastructure, Transport and Regional ...
PDF: 3548 KB - Bureau of Infrastructure, Transport and Regional ...

You also want an ePaper? Increase the reach of your titles
YUMPU automatically turns print PDFs into web optimized ePapers that Google loves.
• 14 •<br />
BITRE • Road deaths Australia 2011 statistical summary<br />
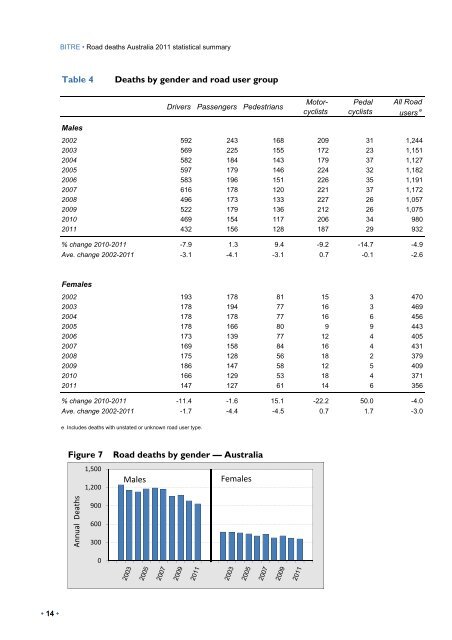
Table 4 Deaths by gender <strong>and</strong> road user group<br />
Males<br />
Drivers Passengers Pedestrians<br />
Motorcyclists<br />
Pedal<br />
cyclists<br />
All Road<br />
users e<br />
2002 592 243 168 209 31 1,244<br />
2003 569 225 155 172 23 1,151<br />
2004 582 184 143 179 37 1,127<br />
2005 597 179 146 224 32 1,182<br />
2006 583 196 151 226 35 1,191<br />
2007 616 178 120 221 37 1,172<br />
2008 496 173 133 227 26 1,057<br />
2009 522 179 136 212 26 1,075<br />
2010 469 154 117 206 34 980<br />
2011 432 156 128 187 29 932<br />
% change 2010-2011 -7.9 1.3 9.4 -9.2 -14.7 -4.9<br />
Ave. change 2002-2011 -3.1 -4.1 -3.1 0.7 -0.1 -2.6<br />
Females<br />
2002 193 178 81 15 3 470<br />
2003 178 194 77 16 3 469<br />
2004 178 178 77 16 6 456<br />
2005 178 166 80 9 9 443<br />
2006 173 139 77 12 4 405<br />
2007 169 158 84 16 4 431<br />
2008 175 128 56 18 2 379<br />
2009 186 147 58 12 5 409<br />
2010 166 129 53 18 4 371<br />
2011 147 127 61 14 6 356<br />
% change 2010-2011 -11.4 -1.6 15.1 -22.2 50.0 -4.0<br />
Ave. change 2002-2011 -1.7 -4.4 -4.5 0.7 1.7 -3.0<br />
e Includes deaths with unstated or unknown road user type.<br />
Figure 7 Road deaths by gender — Australia<br />
Annual Deaths<br />
1,500<br />
1,200<br />
900<br />
600<br />
300<br />
0<br />
Males<br />
Females


