

PDF: 3548 KB - Bureau of Infrastructure, Transport and Regional ...
PDF: 3548 KB - Bureau of Infrastructure, Transport and Regional ...
PDF: 3548 KB - Bureau of Infrastructure, Transport and Regional ...

You also want an ePaper? Increase the reach of your titles
YUMPU automatically turns print PDFs into web optimized ePapers that Google loves.
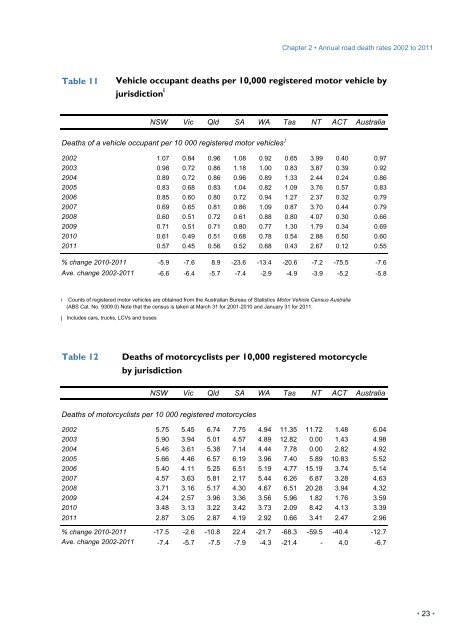
Chapter 2 • Annual road death rates 2002 to 2011<br />
Table 11 Vehicle occupant deaths per 10,000 registered motor vehicle by<br />
jurisdiction i<br />
NSW Vic Qld SA WA Tas NT ACT Australia<br />
Deaths <strong>of</strong> a vehicle occupant per 10 000 registered motor vehicles j<br />
2002 1.07 0.84 0.96 1.08 0.92 0.65 3.99 0.40 0.97<br />
2003 0.98 0.72 0.86 1.18 1.00 0.83 3.87 0.39 0.92<br />
2004 0.89 0.72 0.86 0.96 0.89 1.33 2.44 0.24 0.86<br />
2005 0.83 0.68 0.83 1.04 0.82 1.09 3.76 0.57 0.83<br />
2006 0.85 0.60 0.80 0.72 0.94 1.27 2.37 0.32 0.79<br />
2007 0.69 0.65 0.81 0.86 1.09 0.87 3.70 0.44 0.79<br />
2008 0.60 0.51 0.72 0.61 0.88 0.80 4.07 0.30 0.66<br />
2009 0.71 0.51 0.71 0.80 0.77 1.30 1.79 0.34 0.69<br />
2010 0.61 0.49 0.51 0.68 0.78 0.54 2.88 0.50 0.60<br />
2011 0.57 0.45 0.56 0.52 0.68 0.43 2.67 0.12 0.55<br />
% change 2010-2011 -5.9 -7.6 8.9 -23.6 -13.4 -20.6 -7.2 -75.5 -7.6<br />
Ave. change 2002-2011 -6.6 -6.4 -5.7 -7.4 -2.9 -4.9 -3.9 -5.2 -5.8<br />
i Counts <strong>of</strong> registered motor vehicles are obtained from the Australian <strong>Bureau</strong> <strong>of</strong> Statistics Motor Vehicle Census Australia<br />
(ABS Cat. No. 9309.0) Note that the census is taken at March 31 for 2001-2010 <strong>and</strong> January 31 for 2011.<br />
j Includes cars, trucks, LCVs <strong>and</strong> buses<br />
Table 12 Deaths <strong>of</strong> motorcyclists per 10,000 registered motorcycle<br />
by jurisdiction<br />
NSW Vic Qld SA WA Tas NT ACT Australia<br />
Deaths <strong>of</strong> motorcyclists per 10 000 registered motorcycles<br />
2002 5.75 5.45 6.74 7.75 4.94 11.35 11.72 1.48 6.04<br />
2003 5.90 3.94 5.01 4.57 4.89 12.82 0.00 1.43 4.98<br />
2004 5.46 3.61 5.38 7.14 4.44 7.78 0.00 2.82 4.92<br />
2005 5.66 4.46 6.57 6.19 3.96 7.40 5.89 10.83 5.52<br />
2006 5.40 4.11 5.25 6.51 5.19 4.77 15.19 3.74 5.14<br />
2007 4.57 3.63 5.81 2.17 5.44 6.26 6.87 3.28 4.63<br />
2008 3.71 3.16 5.17 4.30 4.67 6.51 20.28 3.94 4.32<br />
2009 4.24 2.57 3.96 3.36 3.56 5.96 1.82 1.76 3.59<br />
2010 3.48 3.13 3.22 3.42 3.73 2.09 8.42 4.13 3.39<br />
2011 2.87 3.05 2.87 4.19 2.92 0.66 3.41 2.47 2.96<br />
% change 2010-2011 -17.5 -2.6 -10.8 22.4 -21.7 -68.3 -59.5 -40.4 -12.7<br />
Ave. change 2002-2011 -7.4 -5.7 -7.5 -7.9 -4.3 -21.4 - 4.0 -6.7<br />
• 23 •


