

PDF: 3548 KB - Bureau of Infrastructure, Transport and Regional ...
PDF: 3548 KB - Bureau of Infrastructure, Transport and Regional ...
PDF: 3548 KB - Bureau of Infrastructure, Transport and Regional ...

Create successful ePaper yourself
Turn your PDF publications into a flip-book with our unique Google optimized e-Paper software.
• 50 •<br />
BITRE • Road deaths Australia 2011 statistical summary<br />
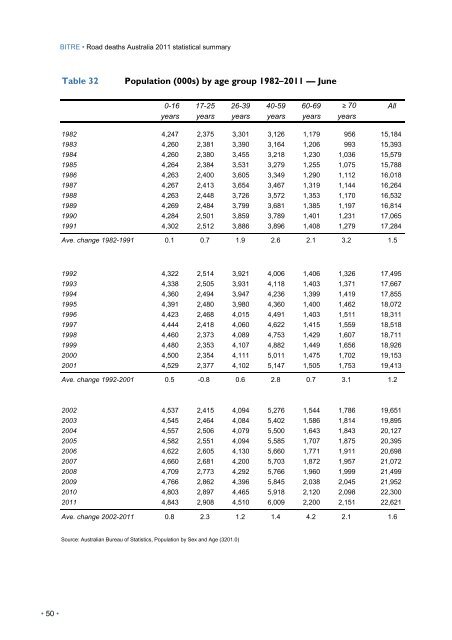
Table 32 Population (000s) by age group 1982–2011 — June<br />
0-16 17-25 26-39 40-59 60-69 ≥ 70 All<br />
years years years years years years<br />
1982 4,247 2,375 3,301 3,126 1,179 956 15,184<br />
1983 4,260 2,381 3,390 3,164 1,206 993 15,393<br />
1984 4,260 2,380 3,455 3,218 1,230 1,036 15,579<br />
1985 4,264 2,384 3,531 3,279 1,255 1,075 15,788<br />
1986 4,263 2,400 3,605 3,349 1,290 1,112 16,018<br />
1987 4,267 2,413 3,654 3,467 1,319 1,144 16,264<br />
1988 4,263 2,448 3,726 3,572 1,353 1,170 16,532<br />
1989 4,269 2,484 3,799 3,681 1,385 1,197 16,814<br />
1990 4,284 2,501 3,859 3,789 1,401 1,231 17,065<br />
1991 4,302 2,512 3,886 3,896 1,408 1,279 17,284<br />
Ave. change 1982-1991 0.1 0.7 1.9 2.6 2.1 3.2 1.5<br />
1992 4,322 2,514 3,921 4,006 1,406 1,326 17,495<br />
1993 4,338 2,505 3,931 4,118 1,403 1,371 17,667<br />
1994 4,360 2,494 3,947 4,236 1,399 1,419 17,855<br />
1995 4,391 2,480 3,980 4,360 1,400 1,462 18,072<br />
1996 4,423 2,468 4,015 4,491 1,403 1,511 18,311<br />
1997 4,444 2,418 4,060 4,622 1,415 1,559 18,518<br />
1998 4,460 2,373 4,089 4,753 1,429 1,607 18,711<br />
1999 4,480 2,353 4,107 4,882 1,449 1,656 18,926<br />
2000 4,500 2,354 4,111 5,011 1,475 1,702 19,153<br />
2001 4,529 2,377 4,102 5,147 1,505 1,753 19,413<br />
Ave. change 1992-2001 0.5 -0.8 0.6 2.8 0.7 3.1 1.2<br />
2002 4,537 2,415 4,094 5,276 1,544 1,786 19,651<br />
2003 4,545 2,464 4,084 5,402 1,586 1,814 19,895<br />
2004 4,557 2,506 4,079 5,500 1,643 1,843 20,127<br />
2005 4,582 2,551 4,094 5,585 1,707 1,875 20,395<br />
2006 4,622 2,605 4,130 5,660 1,771 1,911 20,698<br />
2007 4,660 2,681 4,200 5,703 1,872 1,957 21,072<br />
2008 4,709 2,773 4,292 5,766 1,960 1,999 21,499<br />
2009 4,766 2,862 4,396 5,845 2,038 2,045 21,952<br />
2010 4,803 2,897 4,465 5,918 2,120 2,098 22,300<br />
2011 4,843 2,908 4,510 6,009 2,200 2,151 22,621<br />
Ave. change 2002-2011 0.8 2.3 1.2 1.4 4.2 2.1 1.6<br />
Source: Australian <strong>Bureau</strong> <strong>of</strong> Statistics, Population by Sex <strong>and</strong> Age (3201.0)


