

PDF: 3548 KB - Bureau of Infrastructure, Transport and Regional ...
PDF: 3548 KB - Bureau of Infrastructure, Transport and Regional ...
PDF: 3548 KB - Bureau of Infrastructure, Transport and Regional ...

You also want an ePaper? Increase the reach of your titles
YUMPU automatically turns print PDFs into web optimized ePapers that Google loves.
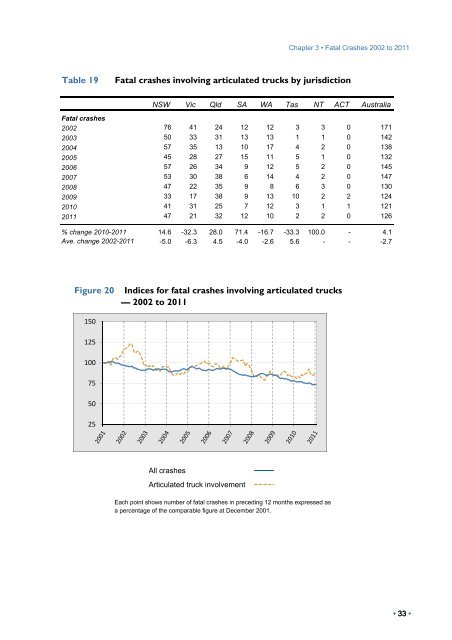
Chapter 3 • Fatal Crashes 2002 to 2011<br />
Table 19 Fatal crashes involving articulated trucks by jurisdiction<br />
NSW Vic Qld SA WA Tas NT ACT Australia<br />
Fatal crashes<br />
2002 76 41 24 12 12 3 3 0 171<br />
2003 50 33 31 13 13 1 1 0 142<br />
2004 57 35 13 10 17 4 2 0 138<br />
2005 45 28 27 15 11 5 1 0 132<br />
2006 57 26 34 9 12 5 2 0 145<br />
2007 53 30 38 6 14 4 2 0 147<br />
2008 47 22 35 9 8 6 3 0 130<br />
2009 33 17 38 9 13 10 2 2 124<br />
2010 41 31 25 7 12 3 1 1 121<br />
2011 47 21 32 12 10 2 2 0 126<br />
% change 2010-2011 14.6 -32.3 28.0 71.4 -16.7 -33.3 100.0 - 4.1<br />
Ave. change 2002-2011 -5.0 -6.3 4.5 -4.0 -2.6 5.6 - - -2.7<br />
Figure 20 Indices for fatal crashes involving articulated trucks<br />
— 2002 to 2011<br />
150<br />
125<br />
100<br />
75<br />
50<br />
25<br />
All crashes<br />
Articulated truck involvement<br />
Each point shows number <strong>of</strong> fatal crashes in preceding 12 months expressed as<br />
a percentage <strong>of</strong> the comparable figure at December 2001.<br />
• 33 •


