HGS van Genuchten - FEFlow
HGS van Genuchten - FEFlow
HGS van Genuchten - FEFlow
Create successful ePaper yourself
Turn your PDF publications into a flip-book with our unique Google optimized e-Paper software.
2 nd<br />
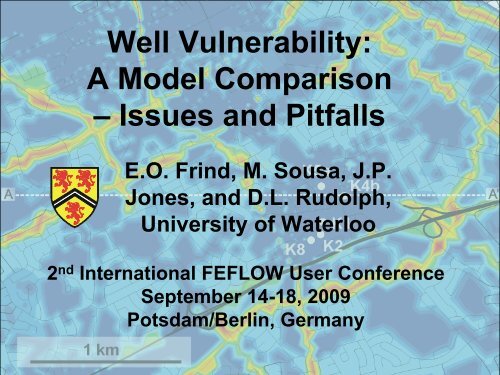
Well Vulnerability:<br />
A Model Comparison<br />
–<br />
Issues and Pitfalls<br />
E.O. Frind, M. Sousa, J.P.<br />
Jones, and D.L. Rudolph,<br />
University of Waterloo<br />
International FEFLOW User Conference<br />
September 14-18, 2009<br />
Potsdam/Berlin, Germany
Wellhead<br />
protection,<br />
standard<br />
approach<br />
Apply particle<br />
tracking,<br />
delineate<br />
capture zone<br />
Possible<br />
sources?
The Real<br />
World:<br />
Cape Cod<br />
example<br />
(USGS Circular<br />
1174, 1998)<br />
A: K=50 ft/d<br />
B: K=150 ft/d<br />
Small change<br />
in head can<br />
cause large<br />
change in<br />
particle tracks
•<br />
•<br />
•<br />
•<br />
•<br />
Key Issues<br />
Sensitivity: Small changes in heads can cause large<br />
changes in capture zone<br />
Uncertainty:<br />
–<br />
–<br />
Effect of heterogeneities<br />
Stochastic approaches (mostly 2D)<br />
Physical approach: represent small-scale heterogeneities by<br />
macrodispersion (Gelhar and Axness 1983); large-scale by scenario<br />
analysis (always 3D)<br />
Determinism: Meaning of a source just inside vs. a source<br />
just outside of capture zone boundary<br />
Impact:<br />
–<br />
How critical will a contaminant source be?<br />
Well Vulnerability Concept gives actual impact on well<br />
Model performance:<br />
against each other?<br />
How do commercial models stack up
Illustrative Example: Mannheim Well Field<br />
Grand River<br />
Watershed<br />
Chicago<br />
Ontario<br />
Detroit<br />
Cleveland<br />
Toronto<br />
Grand River<br />
Conservation Authority<br />
Dundalk<br />
Waterloo<br />
Kitchener<br />
Kitchener<br />
Waterloo<br />
50 km<br />
Guelph<br />
Cambridge<br />
Brantford<br />
• 6800 km2 drainage area<br />
• 10% of Lake Erie<br />
Local Drainage<br />
• Population = 800,000<br />
• 38 local/regional<br />
Grand River<br />
Watershed<br />
governments<br />
• Major reservoirs<br />
regulate 27% of<br />
watershed area<br />
•82% of watershed residents<br />
reliant on groundwater for<br />
their drinking water supply.<br />
Waterloo Moraine model<br />
Mannheim<br />
well field<br />
Dunnville
Waterloo Moraine Model<br />
N<br />
Paul Martin,<br />
1995<br />
Mannheim<br />
well field<br />
Alder<br />
Creek<br />
watershed
Uncertainty due to Local Heterogeneities<br />
N<br />
Total Particles 1760<br />
Reaching Limit 17.95 %<br />
Reaching Top 82.05 %<br />
Reaching Side 0.00 %<br />
Well<br />
K22<br />
Mannheim North<br />
K23<br />
K93<br />
K24<br />
K94<br />
K91<br />
K92<br />
K26<br />
K21<br />
K25<br />
K29<br />
Mannheim South<br />
2km<br />
Mannheim Well Field,<br />
100-yr Capture Zone<br />
by backward particle<br />
tracking (older model)<br />
Can draw envelope<br />
curve around particle<br />
end positions<br />
But first consider<br />
uncertainty due to<br />
local heterogeneities
Uncertainty due to Local Heterogeneities<br />
N<br />
0.1<br />
0.01<br />
Well<br />
0.3<br />
0.5<br />
0.9<br />
0.7<br />
K22<br />
Capture probability<br />
0.01 0.1 0.2 0.3 0.4 0.5 0.6 0.7 0.8 0.9<br />
K93<br />
K23<br />
K24<br />
K94<br />
K92<br />
K91<br />
K26<br />
K21<br />
K29<br />
K25<br />
2km<br />
Transport parameters:<br />
α L = 20 m, α Th = 5 m, α TV = 0.02 m, D m = 10 -10<br />
(Frind et al., 2002)<br />
100-yr Probability-of<br />
Capture plume by<br />
backward advectivedispersive<br />
transport<br />
modelling<br />
Obtain capture zone<br />
outline by mass balance<br />
(not necessarily 0.5<br />
contour)<br />
m 2 /s
Particle Tracking vs Backward Transport Model<br />
N<br />
100-yr<br />
Total Particles 1760<br />
Reaching Limit 17.95 %<br />
Reaching Top 82.05 %<br />
Reaching Side 0.00 %<br />
Well<br />
K22<br />
Mannheim North<br />
K94 K21<br />
K93<br />
K92<br />
K29<br />
K91<br />
K25<br />
K23<br />
Mannheim South<br />
K24<br />
K26<br />
2km<br />
Capture zone from<br />
transport model is<br />
larger due to<br />
dispersion<br />
- accounts for<br />
uncertainty due to<br />
local scale<br />
heterogeneity<br />
- more conservative<br />
than particle tracking
N<br />
100-yr<br />
Source<br />
Well<br />
The Well Vulnerability Concept<br />
K22<br />
K23<br />
K94 K21<br />
K93 K92<br />
K91<br />
K29<br />
K25<br />
K24<br />
K26<br />
2km<br />
(Frind et al., 2006)<br />
Known source:<br />
- Apply pulse at source<br />
- Record breakthrough at<br />
well (forward method)<br />
Unknown source:<br />
- Apply pulse at well<br />
- Record breakthrough at<br />
any point within capture<br />
zone (backward method)<br />
Forward and backward<br />
breakthrough curves will be<br />
the same (Adjoint theory)
Concentration (gm -3 )<br />
Well Vulnerability: Forward Mode<br />
5.0E-04<br />
4.0E-04<br />
3.0E-04<br />
2.0E-04<br />
1.0E-04<br />
C<br />
dws<br />
C<br />
peak<br />
0.0E+00<br />
0<br />
Texceed<br />
50<br />
Tpeak<br />
100 150<br />
Time (days)<br />
200<br />
T<br />
expo<br />
Breakthrough curve<br />
at well due to pulse<br />
source within<br />
capture zone:<br />
• Max concentration<br />
expected at well<br />
• Time to reach max<br />
concentration<br />
• Time to breach<br />
drinking water limit<br />
• Time of exposure
•<br />
•<br />
FEFLOW<br />
–<br />
–<br />
Model Comparison:<br />
Apply to Prediction of Well<br />
Galerkin<br />
Vulnerability<br />
Finite Elements<br />
requires specified recharge function<br />
HydroGeoSphere (<strong>HGS</strong>) (Therrien<br />
–<br />
–<br />
–<br />
Control Volume Finite Elements<br />
and Sudicky, 2003)<br />
integrated groundwater / surface water model<br />
distributes recharge by means of diffusion-wave<br />
equation
•<br />
•<br />
•<br />
Model Functions Tested<br />
Unsaturated flow/transport<br />
–<br />
1D column<br />
3D homogeneous system<br />
–<br />
box model, average Mannheim aquifer properties<br />
3D heterogeneous system<br />
–<br />
actual Mannheim aquifer, Alder Creek model
Recharge 200 mm/yr<br />
Flux concentration 1 mg/L for 20 years<br />
1 m 2<br />
Water<br />
Table<br />
Unsaturated Flow/Transport<br />
40m<br />
Silty Sand:<br />
K = 5 x 10⁻⁴ m/s<br />
Porosity = 0.37<br />
Residual Saturation = 0.049<br />
Van <strong>Genuchten</strong> parameters:<br />
A = 3.475, n = 1.746<br />
Molecular diffusion = 1.2 x 10⁻⁹ m2 /s<br />
Longitudinal dispersivity = 10 m<br />
Transverse dispersivity = 1 m<br />
Vertical discretization 20m
Van <strong>Genuchten</strong> vs Modified <strong>van</strong> <strong>Genuchten</strong> Model<br />
δ = 5.4 δ = 4.0 δ = 1.1<br />
VG<br />
Improving<br />
convergence<br />
MVG<br />
δ
Effect of <strong>van</strong> <strong>Genuchten</strong> δ<br />
Changing δ from 5.4 to 1.1 will change the unsaturated<br />
hydraulic conductivity by up to 7 orders of magnitude<br />
This should have a big impact on travel time?<br />
Not necessarily!<br />
With a specified recharge boundary condition, the same flux<br />
will enter the column, regardless of the K value<br />
–<br />
–<br />
changing K will simply change the gradient<br />
travel time and breakthrough curve will be the same
10m<br />
20m<br />
Breakthrough curve at water table<br />
1m<br />
FEFLOW<br />
5m Modified <strong>van</strong> <strong>Genuchten</strong><br />
Effect of vertical<br />
discretization<br />
Solution converges for<br />
Δz = 1m
Breakthrough curve at water table<br />
1m<br />
<strong>HGS</strong><br />
5m Modified <strong>van</strong> <strong>Genuchten</strong><br />
10m<br />
20m<br />
Effect of vertical<br />
discretization<br />
Solution converges for<br />
Δz = 1m
10m<br />
20m<br />
1m<br />
5m<br />
FEFLOW vs. <strong>HGS</strong><br />
Modified <strong>van</strong><br />
<strong>Genuchten</strong><br />
FEFLOW<br />
<strong>HGS</strong>
1m<br />
5m<br />
10m<br />
20m<br />
<strong>HGS</strong><br />
<strong>van</strong> <strong>Genuchten</strong><br />
<strong>HGS</strong> Solution<br />
converges for<br />
Δz = 1m<br />
Feflow requires<br />
Δz = 0.005m for<br />
convergence<br />
(not practical)
<strong>HGS</strong><br />
Van <strong>Genuchten</strong> vs<br />
Modified <strong>van</strong> <strong>Genuchten</strong><br />
Mod. <strong>van</strong> <strong>Genuchten</strong><br />
Van <strong>Genuchten</strong>
<strong>HGS</strong><br />
Van <strong>Genuchten</strong> vs<br />
Modified <strong>van</strong> <strong>Genuchten</strong><br />
Effect of unsat zone thickness<br />
Van <strong>Genuchten</strong><br />
40m<br />
5m<br />
Mod. Van <strong>Genuchten</strong><br />
40m<br />
5m
Findings: Unsaturated Flow/Transport<br />
•<br />
•<br />
•<br />
•<br />
•<br />
Feflow works best with MVG<br />
<strong>HGS</strong> works with both options<br />
Difference between VG and MVG declines with<br />
unsat zone thickness<br />
δ<br />
used with MVG does not affect results if flux<br />
boundary is chosen<br />
Overall, both models give equivalent results
3D Homogeneous System:<br />
Box Model representing average<br />
conditions for Mannheim aquifer<br />
4km<br />
Pumping Well<br />
500 m 3 /day<br />
1km<br />
Top BC<br />
Recharge 200 mm/yr<br />
400m<br />
25m<br />
Default BC No-Flow<br />
Side:<br />
Constant Head 20m
Finite Element Model<br />
Horizontal grid spacing: 15m
Source Conditions<br />
Source centered within capture zone<br />
Apply 1yr-pulse of specified recharge concentration of 1 g/m 3<br />
Source outside capture zone (OCZ)<br />
Apply 1yr-pulse of specified recharge concentration of 1 g/m 3<br />
Well<br />
Well
Inside Source<br />
FEFLOW vs <strong>HGS</strong>,<br />
Upwind vs No-Upwind<br />
Upstream weighting<br />
Feflow no-upwind option<br />
provides best accuracy<br />
Feflow full-upwind and<br />
<strong>HGS</strong> upstream weighting<br />
are equivalent
Outside Source FEFLOW vs <strong>HGS</strong>,<br />
Upwind vs No-Upwind<br />
Upstream weighting<br />
Mass spread to outside<br />
source by transverse<br />
dispersion: upwind<br />
options spread more<br />
mass
FEFLOW, Plume at 8 years<br />
No upwind<br />
Some oscillations and<br />
negative concentrations
FEFLOW, Plume at 8 years<br />
Full upwind<br />
Negligible oscillations but<br />
significant smearing
•<br />
•<br />
•<br />
•<br />
•<br />
Findings: Homogeneous System<br />
Feflow no-upwind option gives the best accuracy<br />
Feflow full-upwind and <strong>HGS</strong> upstream weighting<br />
give essentially the same results<br />
Upwinding reduces oscillations, but increases<br />
smearing<br />
Transverse dispersion transfers mass to outside<br />
source, upwinding increases the transfer<br />
Overall, model results are comparable
3D Heterogeneous System<br />
N<br />
Waterloo<br />
Moraine<br />
model<br />
Mannheim<br />
well field<br />
Alder<br />
Creek<br />
watershed
•<br />
•<br />
•<br />
Setup:<br />
–<br />
–<br />
–<br />
3D Heterogeneous System:<br />
Alder Creek Model<br />
recharge distribution generated by <strong>HGS</strong>, transferred<br />
to Feflow<br />
MVG for Feflow and <strong>HGS</strong><br />
dispersive form for Feflow (mass flux specified)<br />
Upwinding:<br />
–<br />
–<br />
Feflow: full upwinding (no-upwind required very small<br />
time step (0.1 day)<br />
<strong>HGS</strong>: upstream weighting<br />
Max time step:<br />
–<br />
–<br />
10 days: 3 weeks execution time<br />
100 days: 6 days execution time, same results
Alder Creek Watershed: Ground Surface Elevations
Alder Creek Watershed: Municipal Wells
Alder Creek Watershed: Recharge Distribution<br />
Recharge distribution generated by <strong>HGS</strong> from DEM
87 layers (incl unsat zone)<br />
7216 elements/layer<br />
1204428 elements total<br />
3D Finite<br />
Element Grid<br />
J.P. Jones, 2004<br />
Study<br />
Area<br />
Elevation masl<br />
Area 78 km 2
Alder Creek Watershed: Finite Element Grid<br />
Study<br />
Area
Sources for Vulnerability Study<br />
2 nd<br />
source<br />
1 st<br />
source<br />
K22A<br />
K23<br />
K24<br />
2 nd<br />
source:<br />
14m unsat<br />
zone<br />
1st source:<br />
12m unsat<br />
zone
2 nd<br />
Recharge Distribution<br />
source<br />
1 st<br />
source<br />
K22A<br />
K23<br />
K24<br />
Recharge distribution transferred from <strong>HGS</strong> to Feflow
Mannheim Well Field: Particle Tracks<br />
N<br />
Total Particles 1760<br />
Reaching Limit 27.44 %<br />
Reaching Top 65.91 %<br />
Reaching Side 6.65 %<br />
Well<br />
K22<br />
Mannheim North<br />
K94 K21<br />
K93<br />
K92<br />
K29<br />
K91<br />
K25<br />
K23<br />
K24<br />
Mannheim South<br />
K26<br />
2km<br />
From older<br />
model,<br />
uniform<br />
recharge<br />
100-year<br />
particle tracks<br />
2 nd<br />
1 st<br />
source<br />
source
30 y<br />
K24<br />
K24<br />
Other<br />
wells<br />
FEFLOW<br />
<strong>HGS</strong><br />
1 st<br />
Source<br />
Mass at<br />
300 yrs Feflow <strong>HGS</strong><br />
input (g) 9788 100% 9828 100%<br />
K22A 4 0% 10 0%<br />
K23 70 1% 382 4%<br />
K24 1142 12% 1552 16%<br />
K26 131 1% 281 3%<br />
First arrival of critical conc ?<br />
Arrival of max conc: ~30 years<br />
Max concentration ?<br />
Exposure time ?
60 y<br />
K22A<br />
K23<br />
FEFLOW<br />
<strong>HGS</strong><br />
Other<br />
wells<br />
2 nd<br />
Source<br />
Mass at<br />
400 yrs Feflow <strong>HGS</strong><br />
input (g) 8597 100% 8327 100%<br />
K22A 1697 20% 1396 17%<br />
K23 2823 33% 4814 58%<br />
K24 550 6% 289 3%<br />
K26 404 5% 175 2%<br />
First arrival of critical conc ?<br />
Arrival of max conc: ~60 years<br />
Max concentration ?<br />
Exposure time ?
1 st<br />
Source, Plume at 30 years<br />
K22A<br />
K23<br />
K24<br />
Feflow,<br />
full<br />
upwind<br />
Plume<br />
moves<br />
south: -<br />
this<br />
explains<br />
mass<br />
loss
2 nd<br />
Source, Plume at 75 years<br />
K22A<br />
K23<br />
K24<br />
Feflow,<br />
full<br />
upwind<br />
Plume<br />
moves<br />
east and<br />
south
•<br />
•<br />
•<br />
•<br />
Why the smearing in Feflow?<br />
Effect of heterogeneities?<br />
–<br />
smearing increases with Feflow when going to<br />
heterogeneous system, less so with <strong>HGS</strong><br />
Upwinding?<br />
–<br />
both models use upwinding<br />
Numerical approach?<br />
–<br />
–<br />
Feflow uses Galerkin FE (globally mass conservative)<br />
<strong>HGS</strong> uses Control Volume FE (locally and globally<br />
mass conservative)<br />
Increasing smearing with distance:<br />
–<br />
2nd source is twice as far away as 1st , so numerical<br />
dispersion increases
•<br />
•<br />
•<br />
•<br />
•<br />
Findings: 3D Heterogeneous Model<br />
Recharge distribution has controlling influence on flow<br />
field<br />
Placement of sources within capture zone does not<br />
guarantee capture of input mass by wells<br />
Upwinding seems to be a major factor in transverse<br />
spreading of plume<br />
Accuracy of well vulnerability measures is questionable<br />
Max concentrations at well are all much lower than<br />
source concentrations – dispersion plays a major role
•<br />
•<br />
•<br />
•<br />
•<br />
Reflections on Key Issues<br />
Sensitivity: Recharge distribution has a major impact on<br />
flow field and vulnerability functions<br />
Uncertainty: Macrodispersion is useful, but other<br />
sources of uncertainty may be controlling<br />
Determinism: Sources both inside and outside of<br />
capture zone can contribute to well contamination<br />
Impact: Source location inside capture zone does not<br />
mean that contamination will be critical<br />
Model performance:<br />
different results<br />
Different models can give very
•<br />
•<br />
•<br />
•<br />
•<br />
•<br />
•<br />
•<br />
•<br />
What does it all mean?<br />
Be aware of uncertainty and sensitivity in wellhead<br />
protection work<br />
Use the most complete data available<br />
Use realistic recharge distributions and boundary<br />
conditions<br />
Use the best models available<br />
Select model settings carefully<br />
Consider scenario analyses (windows etc?)<br />
Never take model results at face value<br />
Remember that particle tracks only tell half the story<br />
Use sufficient margins of safety in wellhead protection
Thanks, that’s it for now<br />
We have come a long<br />
way in this journey<br />
Acknowledgements:<br />
Hans-Joerg Diersch<br />
Peter Schaetzl


