community and household-level income & asset status baseline
community and household-level income & asset status baseline
community and household-level income & asset status baseline

You also want an ePaper? Increase the reach of your titles
YUMPU automatically turns print PDFs into web optimized ePapers that Google loves.
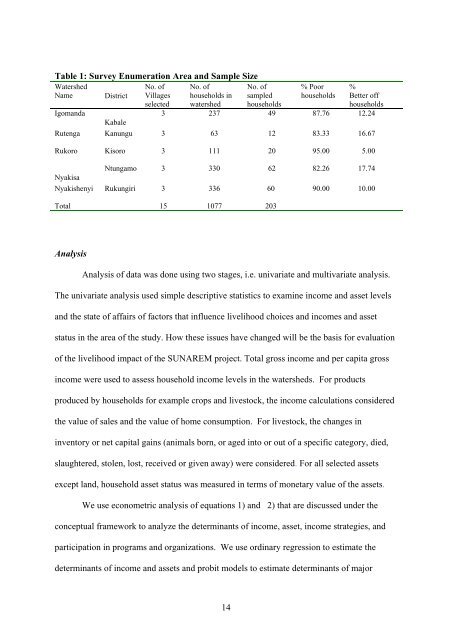
Table 1: Survey Enumeration Area <strong>and</strong> Sample Size<br />
Watershed<br />
Name District<br />
Igom<strong>and</strong>a<br />
Kabale<br />
Rutenga Kanungu<br />
Rukoro Kisoro<br />
Ntungamo<br />
Nyakisa<br />
Nyakishenyi Rukungiri<br />
No. of<br />
Villages<br />
selected<br />
No. of<br />
<strong>household</strong>s in<br />
watershed<br />
No. of<br />
sampled<br />
<strong>household</strong>s<br />
% Poor<br />
<strong>household</strong>s<br />
%<br />
Better off<br />
<strong>household</strong>s<br />
3 237 49 87.76 12.24<br />
3 63 12 83.33 16.67<br />
3 111 20 95.00 5.00<br />
3 330 62 82.26 17.74<br />
3 336 60 90.00 10.00<br />
Total 15 1077 203<br />
Analysis<br />
Analysis of data was done using two stages, i.e. univariate <strong>and</strong> multivariate analysis.<br />
The univariate analysis used simple descriptive statistics to examine <strong>income</strong> <strong>and</strong> <strong>asset</strong> <strong>level</strong>s<br />
<strong>and</strong> the state of affairs of factors that influence livelihood choices <strong>and</strong> <strong>income</strong>s <strong>and</strong> <strong>asset</strong><br />
<strong>status</strong> in the area of the study. How these issues have changed will be the basis for evaluation<br />
of the livelihood impact of the SUNAREM project. Total gross <strong>income</strong> <strong>and</strong> per capita gross<br />
<strong>income</strong> were used to assess <strong>household</strong> <strong>income</strong> <strong>level</strong>s in the watersheds. For products<br />
produced by <strong>household</strong>s for example crops <strong>and</strong> livestock, the <strong>income</strong> calculations considered<br />
the value of sales <strong>and</strong> the value of home consumption. For livestock, the changes in<br />
inventory or net capital gains (animals born, or aged into or out of a specific category, died,<br />
slaughtered, stolen, lost, received or given away) were considered. For all selected <strong>asset</strong>s<br />
except l<strong>and</strong>, <strong>household</strong> <strong>asset</strong> <strong>status</strong> was measured in terms of monetary value of the <strong>asset</strong>s.<br />
We use econometric analysis of equations 1) <strong>and</strong> 2) that are discussed under the<br />
conceptual framework to analyze the determinants of <strong>income</strong>, <strong>asset</strong>, <strong>income</strong> strategies, <strong>and</strong><br />
participation in programs <strong>and</strong> organizations. We use ordinary regression to estimate the<br />
determinants of <strong>income</strong> <strong>and</strong> <strong>asset</strong>s <strong>and</strong> probit models to estimate determinants of major<br />
14