community and household-level income & asset status baseline
community and household-level income & asset status baseline
community and household-level income & asset status baseline

You also want an ePaper? Increase the reach of your titles
YUMPU automatically turns print PDFs into web optimized ePapers that Google loves.
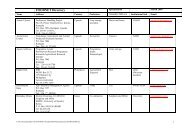
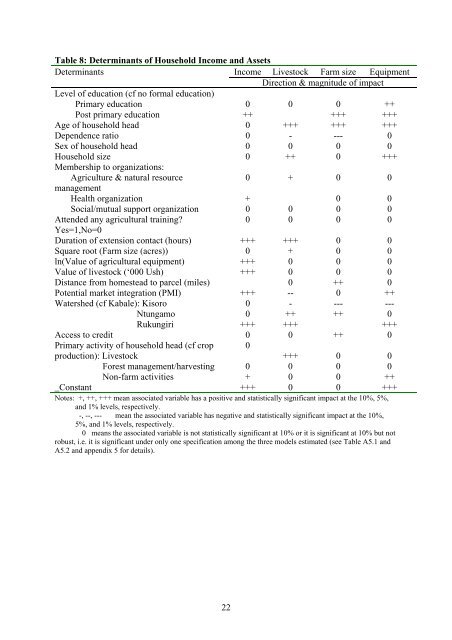
Table 8: Determinants of Household Income <strong>and</strong> Assets<br />
Determinants<br />
Income Livestock Farm size Equipment<br />
Direction & magnitude of impact<br />
Level of education (cf no formal education)<br />
Primary education<br />
0 0 0 ++<br />
Post primary education ++ +++ +++<br />
Age of <strong>household</strong> head 0 +++ +++ +++<br />
Dependence ratio 0 - --- 0<br />
Sex of <strong>household</strong> head 0 0 0 0<br />
Household size<br />
Membership to organizations:<br />
0 ++ 0 +++<br />
Agriculture & natural resource<br />
management<br />
0 + 0<br />
0<br />
Health organization + 0 0<br />
Social/mutual support organization 0 0 0 0<br />
Attended any agricultural training?<br />
Yes=1,No=0<br />
0 0 0 0<br />
Duration of extension contact (hours) +++ +++ 0 0<br />
Square root (Farm size (acres)) 0 + 0 0<br />
ln(Value of agricultural equipment) +++ 0 0 0<br />
Value of livestock (‘000 Ush) +++ 0 0 0<br />
Distance from homestead to parcel (miles) 0 ++ 0<br />
Potential market integration (PMI) +++ -- 0 ++<br />
Watershed (cf Kabale): Kisoro 0 - --- ---<br />
Ntungamo 0 ++ ++ 0<br />
Rukungiri +++ +++ +++<br />
Access to credit 0 0 ++ 0<br />
Primary activity of <strong>household</strong> head (cf crop 0<br />
production): Livestock<br />
+++ 0<br />
0<br />
Forest management/harvesting 0 0 0 0<br />
Non-farm activities + 0 0 ++<br />
_Constant +++ 0 0 +++<br />
Notes: +, ++, +++ mean associated variable has a positive <strong>and</strong> statistically significant impact at the 10%, 5%,<br />
<strong>and</strong> 1% <strong>level</strong>s, respectively.<br />
-, --, --- mean the associated variable has negative <strong>and</strong> statistically significant impact at the 10%,<br />
5%, <strong>and</strong> 1% <strong>level</strong>s, respectively.<br />
0 means the associated variable is not statistically significant at 10% or it is significant at 10% but not<br />
robust, i.e. it is significant under only one specification among the three models estimated (see Table A5.1 <strong>and</strong><br />
A5.2 <strong>and</strong> appendix 5 for details).<br />
22