community and household-level income & asset status baseline
community and household-level income & asset status baseline
community and household-level income & asset status baseline

Create successful ePaper yourself
Turn your PDF publications into a flip-book with our unique Google optimized e-Paper software.
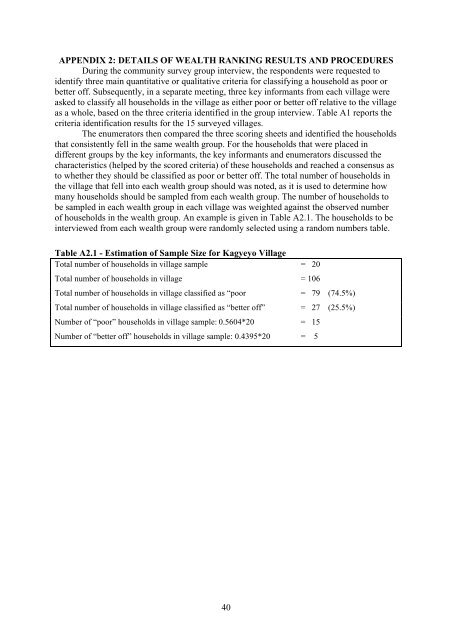
APPENDIX 2: DETAILS OF WEALTH RANKING RESULTS AND PROCEDURES<br />
During the <strong>community</strong> survey group interview, the respondents were requested to<br />
identify three main quantitative or qualitative criteria for classifying a <strong>household</strong> as poor or<br />
better off. Subsequently, in a separate meeting, three key informants from each village were<br />
asked to classify all <strong>household</strong>s in the village as either poor or better off relative to the village<br />
as a whole, based on the three criteria identified in the group interview. Table A1 reports the<br />
criteria identification results for the 15 surveyed villages.<br />
The enumerators then compared the three scoring sheets <strong>and</strong> identified the <strong>household</strong>s<br />
that consistently fell in the same wealth group. For the <strong>household</strong>s that were placed in<br />
different groups by the key informants, the key informants <strong>and</strong> enumerators discussed the<br />
characteristics (helped by the scored criteria) of these <strong>household</strong>s <strong>and</strong> reached a consensus as<br />
to whether they should be classified as poor or better off. The total number of <strong>household</strong>s in<br />
the village that fell into each wealth group should was noted, as it is used to determine how<br />
many <strong>household</strong>s should be sampled from each wealth group. The number of <strong>household</strong>s to<br />
be sampled in each wealth group in each village was weighted against the observed number<br />
of <strong>household</strong>s in the wealth group. An example is given in Table A2.1. The <strong>household</strong>s to be<br />
interviewed from each wealth group were r<strong>and</strong>omly selected using a r<strong>and</strong>om numbers table.<br />
Table A2.1 - Estimation of Sample Size for Kagyeyo Village<br />
Total number of <strong>household</strong>s in village sample = 20<br />
Total number of <strong>household</strong>s in village = 106<br />
Total number of <strong>household</strong>s in village classified as “poor = 79 (74.5%)<br />
Total number of <strong>household</strong>s in village classified as “better off” = 27 (25.5%)<br />
Number of “poor” <strong>household</strong>s in village sample: 0.5604*20 = 15<br />
Number of “better off” <strong>household</strong>s in village sample: 0.4395*20 = 5<br />
40