Annual Report 2012 - City University of Hong Kong
Annual Report 2012 - City University of Hong Kong
Annual Report 2012 - City University of Hong Kong

You also want an ePaper? Increase the reach of your titles
YUMPU automatically turns print PDFs into web optimized ePapers that Google loves.
Guy Carpenter<br />
Asia-Pacific Climate<br />
Impact Centre<br />
<strong>Annual</strong> <strong>Report</strong> <strong>2012</strong><br />
Published May 2013
Executive Summary<br />
This is the fourth annual report issued by the Guy Carpenter Asia-Pacific Climate Impact Centre and covers the<br />
activities <strong>of</strong> the Centre in <strong>2012</strong>. During the year, we continued to work on various climate problems on both the<br />
regional (the Asia-Pacific region) and global scales. In the area <strong>of</strong> typhoon prediction, we investigated the possibility<br />
<strong>of</strong> real-time dynamical seasonal forecasting <strong>of</strong> typhoon activity and studied the possibility <strong>of</strong> using pre-season sea-<br />
surface temperature to predict typhoon activity. We also identified how typhoon activities (genesis, intensity, track<br />
and landfall) can be modified by various atmospheric oscillations. On more general climate problems, we analyzed<br />
how the moisture transport anomalies in the Asia-Pacific region modified the rainfall, and established the climatology<br />
and characteristics <strong>of</strong> the blocking events over Ural-Siberia that are crucial in understanding the cold weather in<br />
China. We continued to run both global and regional models in efforts to understand the global-scale phenomena as<br />
well as to develop capability to perform downscaling (statistical and dynamical) predictions <strong>of</strong> precipitation. We have<br />
been expanding our efforts in studying how local and regional air pollution can affect local and regional climate, both<br />
from measurements and modeling perspectives. As in the past, the main results from each <strong>of</strong> the projects are briefly<br />
described in this report. The papers produced from these projects are available either from the CD attached to the<br />
report or from our website.<br />
1
Contents<br />
1 Executive Summary<br />
5 I. Introduction<br />
5 II. Research Projects<br />
A. Tropical Cyclones<br />
A1. Dynamical downscaling forecasts <strong>of</strong> Western North Pacific tropical cyclone genesis and landfall<br />
A2. Relation between pre-season sea-surface temperature and tropical cyclone activity over the western<br />
North Pacific<br />
A3. Modulation <strong>of</strong> Western North Pacific tropical cyclone activities<br />
A3.1 Genesis and intensity<br />
A3.2 Tracks and landfalls<br />
A3.3 Effects <strong>of</strong> Pacific-Japan teleconnection pattern on tropical cyclone activity<br />
B. Global Circulation<br />
B1. Moisture transport anomalies over Asia-Pacific regions<br />
B1.1 Atmospheric water vapor transport associated with two decadal rainfall shifts over East China<br />
B1.2 Comparison <strong>of</strong> the moisture supply over Southwest and Southeast China<br />
B2. Climatology and characteristics <strong>of</strong> Northern hemisphere blocking events<br />
B2.1 Characteristics <strong>of</strong> atmospheric blocking over Ural-Siberia<br />
B2.2 Climatology <strong>of</strong> atmospheric blocking over Ural-Siberia<br />
C. Modeling and Prediction<br />
C1. A new perspective on the excitation <strong>of</strong> low-tropospheric mixed rossby-gravity waves in association<br />
with energy dispersion<br />
C2. Development <strong>of</strong> a multi-model-based seasonal prediction system for extreme droughts and floods<br />
C3. Six-month lead downscaling prediction <strong>of</strong> winter-spring drought based on multi-model ensemble<br />
C4. Regional climate simulations <strong>of</strong> summer diurnal rainfall variations over East Asia and Southeast China<br />
D. Air Quality<br />
D1. On-road plume chasing and analysis system (OPCAS) for on-road vehicle emission and ambient air<br />
quality inspection<br />
D2. Black carbon source identification during biomass burning episodes using an integrated approach<br />
D3. Black carbon mixing state and size distribution for climate forcing estimation<br />
D4. A novel approach by dispersive absorption spectroscopy (DAS) for water interference free greenhouse<br />
gas measurement<br />
D5. Regional climate and local air quality study<br />
D5.1 South China flooding<br />
D5.2 Hydrometeorological extremes over the Korean peninsula<br />
D5.3 Local air quality<br />
D6. Climatic impacts from the change <strong>of</strong> tropical cyclone on regional air quality<br />
D7. Regional climate change on future air quality in East Asia<br />
33 Publications<br />
36 Staff List<br />
3
I. Introduction<br />
The Guy Carpenter Asia-Pacific Climate Impact Centre was established in June 2008. Since 2009, we have been<br />
issuing an annual report that describes our activities during the year, and this is our fourth one that describes the<br />
activities <strong>of</strong> the Centre in <strong>2012</strong>. During the year, we continued to work on climate problems related to the Asia-Pacific<br />
region as well as those on a global scale, with a total <strong>of</strong> 22 projects. For each project, we present a brief description<br />
<strong>of</strong> the main results for the reader to have a quick introduction <strong>of</strong> the subject. Further details <strong>of</strong> each project can be<br />
found in the list <strong>of</strong> publications. A copy <strong>of</strong> each <strong>of</strong> the publications is included in the CD attached to the report and is<br />
also available online at http://www.cityu.edu.hk/gcacic/publications.htm.<br />
We hope that this report will provide the reader with an overall picture <strong>of</strong> the activities <strong>of</strong> the Centre. Suggestions and<br />
comments on the projects are most welcome.<br />
II. Research Projects<br />
A. Tropical Cyclones<br />
A1. Dynamical downscaling forecasts <strong>of</strong> Western North Pacific tropical cyclone genesis and<br />
landfall<br />
(PI: Johnny CHAN)<br />
This study evaluates the<br />
capability <strong>of</strong> RegCM3 driven<br />
by NCEP CFS reanalysis and<br />
hindcast data in forecasting<br />
Western North Pacific tropical<br />
cyclone activity.<br />
In this study, we evaluate the potential use <strong>of</strong> the RegCM3 driven by (1) the<br />
NCEP Climate Forecast System Reanalysis (CFSR) data during 1982-2001<br />
and (2) the NCEP Climate Forecast System Version 2 (CFS2) hindcast data<br />
during 2000-2010 in forecasting western North Pacific (WNP) tropical<br />
cyclone (TC) activity. Results show that the use <strong>of</strong> RegCM3 driven by the<br />
CFSR achieves a better simulation on the temporal and spatial variation <strong>of</strong><br />
WNP-TC genesis during 1982-2001, as compared to previous studies using<br />
the same model but driven by the ERA40 reanalysis. In addition, diagnoses<br />
on the use <strong>of</strong> RegCM3 driven by the CFS2 point out that the 2000-2010 WNP-TC genesis locations and numbers from<br />
the model are very similar to those from the observation (Figure 1). The skill <strong>of</strong> RegCM3 in the forecasts <strong>of</strong> landfalling<br />
TCs is higher over the Southeast Asian region than over the other sub-regions <strong>of</strong> East Asia. Potential causes for such<br />
regional differences are discussed. Most importantly, statistical analyses show that the use <strong>of</strong> RegCM3 driven by the<br />
CFS2 gives a better forecast skill than the use <strong>of</strong> CFS2 alone for the prediction <strong>of</strong> WNP-TCs making landfall in East<br />
Asia (Table 1). This indicates that the use <strong>of</strong> a dynamical downscaling method for the global forecast data would likely<br />
lead to a higher forecast skill <strong>of</strong><br />
regional TC landfalls in most <strong>of</strong><br />
the East Asian region.<br />
Figure 1. Spatial distribution <strong>of</strong><br />
the May to October (MJJASO)<br />
accumulated frequency <strong>of</strong> TC<br />
genesis averaged during 2000-<br />
2010 in the western North Pacific<br />
(WNP) extracted from (a) the<br />
JTWC data and (b) the RegCM3<br />
driven by CFS2 hindcast data<br />
5
6<br />
(i.e. Exp2). (c) is the difference between (b) and (a). In (c), the area with difference significant at the 95% confidence<br />
interval is marked with red open triangle. (d) is the climatological month to month evolution <strong>of</strong> TC genesis number<br />
averaged over the time periods <strong>of</strong> 2000-2010 obtained from<br />
JTWC (blue bar) and Exp2 (red line).<br />
Table 1. The skill <strong>of</strong> forecast for Exp2 compared to CFS2<br />
Reference:<br />
Huang, W.-R. and Johnny C. L. Chan, 2013: Dynamical downscaling forecasts <strong>of</strong> western North Pacific tropical<br />
cyclone genesis and landfall (in press).<br />
A2. Relation between pre-season sea-surface temperature and tropical cyclone activity over<br />
the western North Pacific<br />
(PI: Johnny CHAN)<br />
This study investigates the relation between the oceanic conditions<br />
prior to the tropical cyclone (TC) season and the annual TC activity<br />
over the western North Pacific (WNP) and an index based on sea-<br />
surface temperature (SST) is proposed for the seasonal forecast<br />
<strong>of</strong> TC activity. The TC activity, measured as the annual number <strong>of</strong><br />
tropical storms, is correlated with the Apr-May SST anomalies in<br />
various ocean basins. Horseshoe-shaped positive correlations are<br />
found over the North Pacific while negative correlations are observed in the region east <strong>of</strong> Australia and in the North<br />
Indian Ocean (Figure 2a). Based on this correlation map, a SST index is defined as the standardized value <strong>of</strong> [SSTA<br />
(15°-25°N, 170°-140°W) + SSTA (40°-50°N, 170°-140°W)] × 0.5 -SSTA (35°-15°S, 150°-165°E) -SSTA (5°S-20°N, 50°-<br />
100°E). This index is highly correlated with the TC number (r = 0.75) and show the similar interannual and interdecadal<br />
variations (Figure 2b). A year is defined as the positive (negative) SST index year if the Apr-May SST index is greater<br />
than 0.4 (less than -0.4). The mean TC number for the positive SST index years is 31.1, which is significantly higher<br />
than the climatological mean (~ 27). Indeed, <strong>of</strong> the 19 positive SST index years, 15 are associated with above-normal<br />
TC activity and 4 are associated with normal TC activity. In contrast, the mean TC number for the negative SST<br />
index years (22.4) is significantly lower than the climatological mean. Of the 16 negative SST index years, 13 are<br />
associated with below-normal TC activity and 3 are associated with normal TC activity. Thus, for a positive (negative)<br />
SST index year, the TC season tends to be above (below) normal or normal and the chance to have a below-normal<br />
(an above-normal) TC activity is low. It is worth to note that the SST index is generally negative starting from 1998<br />
and correspondingly, the TC activity is generally below normal in this period (Figure 2b), which is consistent with the<br />
results <strong>of</strong> Liu and Chan (<strong>2012</strong>).<br />
Forecast<br />
Type <strong>of</strong><br />
skill<br />
landfalling TCs<br />
NTC<br />
MTC<br />
STC<br />
ATC<br />
RMSEExp2<br />
S= 1- x100%<br />
( )<br />
RMSECFS2<br />
18.9%<br />
6.2%<br />
48.0%<br />
11.7%<br />
This study proposes a sea-surface<br />
temperature index for the seasonal<br />
forecast <strong>of</strong> tropical cyclone activity<br />
over the western North Pacific.
(a)<br />
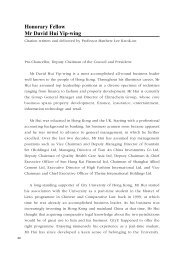
Figure 2. (a) Correlation map between the annual number <strong>of</strong> tropical storms and the Apr-May SST anomalies.<br />
Shadings indicate the correlations with 95% confidence level. The boxes are the areas used to define the SST index.<br />
(b) Time series <strong>of</strong> the SST index (solid circle) and annual number <strong>of</strong> tropical storms (empty square).<br />
To understand the relation between the SST index and the atmospheric circulations, the composites <strong>of</strong> the flow<br />
patterns for the positive and negative SST index years are compared. For the positive SST index years, the North<br />
Pacific is characterized by an anomalous low centered at about 25°N, 170°W and westerly anomalies are found on its<br />
southern flank over the tropical WNP (Figure 3a). In the Southern Hemisphere, an anomalous low is also observed<br />
over the South Pacific, forming the twin lows on opposite sides <strong>of</strong> the equator. The anomalous northerly winds<br />
northeast <strong>of</strong> Australia may enhance the cross-equatorial flow and hence the westerly winds over the tropical WNP.<br />
At the upper level, easterly anomalies are found over the tropical WNP (Figure 3c). Climatologically, the tropical WNP<br />
is dominated by westerly shear and the vertical wind shear is therefore reduced. This atmospheric pattern generally<br />
persists into the TC season (not shown) and the atmospheric conditions are therefore favorable for TC genesis. The<br />
flow pattern is almost the opposite for the negative SST index years, with an anomalous high over the North Pacific<br />
and easterly anomalies over the tropical WNP at 850 hPa (Figure 3b) and westerly anomalies over the tropical WNP at<br />
200 hPa (Figure 3d). As a result, the vertical wind shear is stronger and these atmospheric conditions tend to persist<br />
into the TC season, which are not favorable for TC genesis. It may be concluded that the SST index may have a<br />
significant relation with the change in vertical wind shear and hence the TC activity.<br />
(a)<br />
(c)<br />
Figure 3. 850-hPa wind (vector) and geopotential height (shading) anomalies for (a) positive SST index years and (b)<br />
negative SST index years. (c) and (d) As in (a) and (b) except for the 200-hPa level.<br />
(b)<br />
(b)<br />
(d)<br />
7
8<br />
Reference:<br />
Liu, K. S. and J. C. L. Chan, <strong>2012</strong>: Inactive period <strong>of</strong> western North Pacific tropical cyclone activity in 1998-2011.<br />
J. Climate. doi:10.1175/JCLI-D-12-00053.1.<br />
A3. Modulation <strong>of</strong> Western North Pacific tropical cyclone activities<br />
(PI: Wen ZHOU)<br />
A3.1 Genesis and intensity<br />
Results suggest that these two ISO modes exhibit different origins,<br />
spatial scales, and propagation characteristics, which result in distinctive<br />
TC modulation in the Western North Pacific (WNP). The northeastward-<br />
propagating MJO predominantly controls the basin-wide TC frequency.<br />
The significant increase (reduction) in cyclogenesis in the convective<br />
(nonconvective) phase is found to be associated with the concomitant<br />
strengthening (weakening) <strong>of</strong> the monsoon trough. In addition, the<br />
large contrast in TC frequency also results in a significant difference in<br />
daily accumulated cyclone energy (ACE) between the convective and<br />
nonconvective MJO phases. The northwestward-propagating QBWO, in<br />
contrast, is characterized by alternating signals <strong>of</strong> positive and negative<br />
convection. It leads to the opposite TC modulation in the WNP1 (120°–<br />
150°E, 0°–30°N) and WNP2 (150°–180°E, 0°–30°N) and results in a northwestward shift in TC genesis locations, which<br />
in turn causes substantial differences in intensity distribution and daily ACE for different QBWO phases. Finally, a brief<br />
examination <strong>of</strong> the dual mode situation suggests that the QBWO generally exerts modulation upon the background<br />
MJO, and the modulation seems to vary under different MJO conditions (See Figure 4). For more details, please refer<br />
to Li and Zhou (2013).<br />
Figure 4. (a) Meridional average (5°–20°N) <strong>of</strong> 30–60-day filtered OLR anomalies (shading; units: W/m2) together with<br />
the cyclogenesis locations for a complete MJO cycle, and (b) Meridional average (5°–20°N) <strong>of</strong> 10–20-day filtered OLR<br />
anomalies (shading; units: W/m2) together with the cyclogenesis locations for a complete QBWO cycle.<br />
Reference:<br />
Li, C.Y. and W. Zhou, 2013: Modulation <strong>of</strong> western North Pacific tropical cyclone activities by the ISO. Part I: Genesis<br />
and intensity. J. Climate. (In press).<br />
This study investigates the<br />
intraseasonal variability <strong>of</strong><br />
tropical cyclones (TCs) by<br />
systematically examining the<br />
two major components <strong>of</strong><br />
the intraseasonal oscillation<br />
(ISO), the 30–60-day Madden-<br />
Julian Oscillation (MJO) and<br />
the 10–20-day quasi-biweekly<br />
oscillation (QBWO).
A3.2 Tracks and landfalls<br />
In the convective phases <strong>of</strong> the MJO (phase 7+8<br />
and phase 1+2), the WNP is mainly clustered with<br />
westward-moving and northwestward-moving TCs.<br />
The strong easterlies (southeasterlies) in the southern<br />
flank <strong>of</strong> the subtropical high lead to an increase in TC<br />
activity and landfalls in the Philippines and Vietnam<br />
(China and Japan) in phase 7+8 (phase 1+2). In the<br />
nonconvective phases (phase 3+4 and phase 5+6), TCs change from the original straight-moving type to the recurving<br />
type, such that the tendency for landfalls is significantly reduced. The QBWO, on the other hand, has a significant<br />
influence on TC landfalls in the Philippines and Japan. The strengthening <strong>of</strong> the subtropical high in phase 1+2 favors<br />
the development <strong>of</strong> westward-moving TCs and results in an increase in landfalls in the Philippines, while in phase 3+4<br />
(phase 5+6), there is an increase (decrease) in TC activity and landfalls in Japan due to changes in genesis locations<br />
and large-scale circulations. Our results suggest that both the MJO and QBWO exert distinctive impacts on TCs in the<br />
WNP (See Figures 5 and 6). For more details, please refer to Li and Zhou (2013).<br />
Reference:<br />
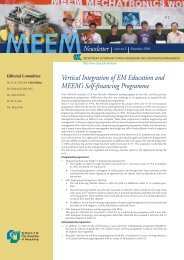
Figure 5. TC tracks and landfall<br />
locations for different MJO phases:<br />
(a) phase 1+2; (b) phase 3+4; (c)<br />
phase 5+6; (d) phase 7+8. The<br />
numbers in parentheses denote<br />
the total number <strong>of</strong> landfalls, while<br />
the colors <strong>of</strong> the triangles represent<br />
different landfall locations (red:<br />
China; orange: the Philippines;<br />
yellow: Korea; green: Vietnam;<br />
purple: Japan).<br />
Figure 6. Same as Figure 5,<br />
except showing the TC tracks<br />
and landfall locations for different<br />
QBWO phases: (a) phase 1+2;<br />
(b) phase 3+4; (c) phase 5+6; (d)<br />
phase 7+8.<br />
Li, C.Y. and W. Zhou, 2013: Modulation <strong>of</strong> western North Pacific tropical cyclone activities by the ISO. Part II : Tracks<br />
and landfalls. J. Climate. (In press).<br />
This study investigates how tropical cyclone<br />
(TC) tracks and landfalls are modulated by the<br />
two major components <strong>of</strong> the intraseasonal<br />
oscillation (ISO), the 30–60-day Madden-<br />
Julian Oscillation (MJO) and the 10–20-day<br />
quasi-biweekly oscillation (QBWO).<br />
9
10<br />
A3.3 Effects <strong>of</strong> Pacific-Japan teleconnection pattern on tropical cyclone activity<br />
In this study, an exploratory analysis<br />
was carried out to gain better<br />
understanding <strong>of</strong> the potential<br />
impacts <strong>of</strong> the two phases (negative<br />
and positive phase) <strong>of</strong> the Pacific-<br />
Japan (PJ) pattern on western North<br />
Pacific (WNP) tropical cyclone (TC)<br />
activities and TC-induced extreme<br />
moisture fluxes over Korea’s five<br />
major river basins.<br />
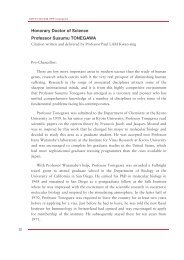
The results presented here show that the large-scale atmospheric<br />
environments during the years with the positive phase (referred to<br />
as positive PJ years) are more favorable for the TC activities than<br />
those during the years with the negative PJ phase (referred to as<br />
negative PJ years). It is found that the wind shear is weaker, rising<br />
motion is stronger, and relative humidity is higher over the Korean<br />
peninsula (KP) in the positive PJ years than in the negative PJ years.<br />
KP-influenced TCs during the positive (negative) PJ years tend<br />
to occur more southwestward (northeastward), recurve at more<br />
northwestward (northeastward) locations, and indicate increase<br />
(decrease) in frequency over Korea and Japan. As a result, TCs<br />
making landfall are found very <strong>of</strong>ten over the southeastern parts<br />
<strong>of</strong> South Korea during the positive PJ years. Despite the relatively<br />
modest sample size used in this study, we expect that insights and results obtained herein will be useful in developing<br />
a critical support system for the effective reduction and mitigation <strong>of</strong> TC-caused disasters as well as for water supply<br />
management in coupled human and natural systems (See Figure 7). For more details, please refer to Kim et al. (<strong>2012</strong>).<br />
Figure 7. Percentage changes in composite anomalies for the climatology (1966-2007) <strong>of</strong> the typhoon-induced<br />
seasonal precipitation totals during the June-September period. a. Typhoon-induced precipitation in the positive<br />
PJ years. b. Typhoon-induced precipitation in the negative PJ years. The hatched polygons represent statistically<br />
significant changes in TC-induced rainfall based on a 90% confidence level. Note: NA means no data is available.<br />
Reference:<br />
Kim, J. S., C. Y. Li and W. Zhou, <strong>2012</strong>: Effects <strong>of</strong> the Pacific-Japan teleconnection pattern on tropical cyclone activity and<br />
extreme precipitation events over the Korean peninsula. J. Geophys. Res., 117, D18109, doi:10.1029/<strong>2012</strong>JD017677
B. Global Circulation<br />
B1. Moisture transport anomalies over Asia-Pacific regions<br />
(PI: Wen ZHOU)<br />
B1.1 Atmospheric water vapor transport associated with two decadal rainfall shifts over East China<br />
After 1978/79, summer precipitation increased abruptly in the Yangtze-<br />
Huaihe River valley (YH) but decreased in South China (SC) and North<br />
China (NC). Associated with this rainfall shift, southerly water vapor<br />
transport over East China was weakened; an anticyclonic moisture<br />
circulation anomaly along with decreasing moisture convergence<br />
existed in SC; abnormal water vapor from western SC converged in YH<br />
with that from western NC, then turned eastward, instead <strong>of</strong> northward<br />
to NC. After 1992/93, rainfall over SC increased dramatically. It is<br />
closely related to two abnormal anticyclonic moisture circulations to the south and the north with their northwesterly<br />
and southwesterly outflows converging over SC. During these two regime shifts, it was the variation <strong>of</strong> meridional<br />
water vapor flux, located mainly in the lower troposphere, which played an important role in the rainfall anomalies over<br />
YH, SC, and NC. The water vapor transport anomalies were mainly controlled by the disturbance wind field instead <strong>of</strong><br />
the disturbance moisture field (See Figure 8). For more details, please refer to Li et al. (<strong>2012</strong>):<br />
Figure 8. Differences <strong>of</strong> the summer regional water vapor balance and moisture budget via each regional boundary<br />
associated with the two rainfall regime changes. (a) 1979–1992 minus 1958–1978, (b) 1993–2002 minus 1979–1992.<br />
Dark arrows indicate the direction <strong>of</strong> the net horizontal transport across each face <strong>of</strong> the volume. Magnitudes are<br />
presented as 1.0×10 +13 kg s -1. Numbers in panes indicate the net flux convergence (positive numbers) and divergence<br />
(negative numbers) for the three regions.<br />
Reference:<br />
(a)<br />
In this study, the atmospheric<br />
water vapor transport and<br />
moisture budget associated with<br />
two decadal summer rainfall shifts<br />
in 1978/79 and 1992/93 over East<br />
China were investigated.<br />
Li, X. Z., Z. P. Wen, W. Zhou and D. X. Wang, <strong>2012</strong>: Atmospheric water vapor transport associated with two decadal<br />
rainfall shifts over East China. J. Meteor. Soc. Japan, 90, 587−602. Doi: 10.2151/jmsj.<strong>2012</strong>-501.<br />
(b)<br />
11
12<br />
B1.2 Comparison <strong>of</strong> the moisture supply over Southwest and Southeast China<br />
Consistent with the differences between southwest and southeast China in<br />
the dry/wet conditions and the rainfall belt activity, the monthly variation in<br />
the moisture budget via each boundary differs widely between two regions,<br />
as do the roles played by the zonal and meridional moisture budgets in<br />
the regional moisture sink. The moisture input over southwest China is<br />
dominated by the zonal moisture budget from June to September and by the<br />
meridional moisture budget in the pre-summer monsoon and post-summer<br />
monsoon stages; moisture over southeast China comes mainly from the<br />
surplus <strong>of</strong> the meridional moisture budget in the wet season and from the<br />
surplus <strong>of</strong> the zonal moisture budget in the dry season.<br />
Energetic cold air activity is beneficial for strong moisture convergence<br />
over southwest China, while weakened cold air activity is favorable to the<br />
moisture sink over southeast China in winter. The west-to-east displacement <strong>of</strong> the western Pacific subtropical high<br />
determines the existence <strong>of</strong> abnormal moisture convergence over southwest China or southeast China in the fall. The<br />
anticyclonic circulation anomaly over the Philippine Sea, which is attributed to the remote forcing <strong>of</strong> El Niño, is crucial<br />
to the strong moisture sink over southeast China from fall to spring. However, it does not play a key role in the moisture<br />
sink over southwest China (See Figures 9 and 10). For more details, please refer to Li et al. (2013).<br />
Figure 9. Monthly moisture budget via each boundary <strong>of</strong> Southwest China. Blue: input; red: output. The direction<br />
and length <strong>of</strong> the vectors show the direction and strength <strong>of</strong> the moisture transport. The value along each vector also<br />
indicates the strength <strong>of</strong> the moisture transport and the value inside the rectangle indicates the regional moisture<br />
budget. Unit: mm/month.<br />
In this study, the<br />
characteristics <strong>of</strong> the<br />
moisture budget over<br />
southwest and southeast<br />
China are compared, and<br />
the moisture circulations<br />
responsible for the regional<br />
budget over southwest and<br />
southeast China are also<br />
investigated.
Figure 10. Same as Figure 9, but for Southeast China.<br />
Reference:<br />
Li, X. Z, W. Zhou, C.Y. Li, and J. Song, 2013: Comparison <strong>of</strong> the moisture supply over Southwest and Southeast China.<br />
J. Climate (under review)<br />
B2. Climatology and characteristics <strong>of</strong> Northern hemisphere blocking events<br />
(PI: Wen ZHOU)<br />
B2.1 Characteristics <strong>of</strong> atmospheric blocking over Ural-Siberia<br />
The climatology <strong>of</strong> the characteristics <strong>of</strong> blocking events,<br />
including duration, intensity, and extension, in four seasons<br />
over the Northern Hemisphere was analyzed for the period<br />
1950–2009. The seasonality and spatial variations <strong>of</strong> these<br />
characteristics were studied according to their longitudinal<br />
distributions. The blocking not only occurred more frequently<br />
but also underwent stronger amplification in winter; likewise,<br />
the blocking occurred less frequently and underwent weaker<br />
This study shows that there are<br />
sharp discrepancies in the blocking<br />
characteristics between winter and<br />
summer, and these differences are more<br />
prominent over the Atlantic and Pacific<br />
Oceans.<br />
13
14<br />
amplification in summer. There are very strong interrelationships among different blocking characteristics, suggesting<br />
that they are supported by similar physical factors. In addition, the relationship between blocking over different regions<br />
and East Asian circulation was examined. Ural–Siberia is a major blocking formation region in all seasons that may<br />
exert a downstream impact on East Asia. The impact is generally weak in summer, which is due to its lower intensity<br />
and smaller duration. However, the extratropical circulation over East Asia in summer can be disturbed persistently<br />
by the frequent occurrence <strong>of</strong> blocking over the Asian continent or the Western Pacific. In particular, the blocking<br />
frequency over the Western Pacific underwent a significantly increased during the study period. This climatological<br />
information provides a background for studying the impact <strong>of</strong> blocking on East Asian circulation under both present<br />
and future climate conditions (See Figure 11). For more details, please refer to Cheung et al. (2013).<br />
Figure 11. 60-yr climatology <strong>of</strong> Northern Hemisphere blocking frequency in four seasons as a function <strong>of</strong> longitude:<br />
(a) spring (MAM), (b) summer (JJA), (c) autumn (SON) and (d) winter (DJF), where the solid line indicates the median,<br />
blue error bars denote the 25-th and 75-th percentile and red error bars denote the 75-th and 95-th percentile. Unit:<br />
days.<br />
Reference:<br />
Cheung, H.N., W. Zhou, Y. P. Shao, W. Chen , H. Y. Mok and M. C. Wu, 2013: Observational climatology and<br />
characteristics <strong>of</strong> wintertime atmospheric blocking over Ural-Siberia. Clim. Dyn. DOI 10.1007/s00382-012-1587-6. (In<br />
Press).
B2.2 Climatology <strong>of</strong> atmospheric blocking over Ural-Siberia<br />
This study investigates the climatological aspects and temporal<br />
characteristics <strong>of</strong> wintertime Ural-Siberian blocking (USB, centered over<br />
30°–100°E), for the period 1980/81–2009/10. Sixty-eight events are<br />
identified and their physical structure is diagnosed using thermodynamic<br />
and geostrophic vorticity tendency equations. In climatology, horizontal<br />
advections play a fundamental role in constructing a USB event, in which<br />
the anticyclonic center is a warm core in the troposphere and a cold core<br />
in the lower stratosphere. The decay <strong>of</strong> the thermal structure is related<br />
to diabatic cooling along the vertical structure and warm advection in<br />
the lower stratosphere. Meanwhile, the collapse <strong>of</strong> the height structure is<br />
caused primarily by cyclonic vorticity advection.<br />
A strong interrelationship exists between the intensity and extension <strong>of</strong> USB events. The temporal characteristics <strong>of</strong><br />
USB events are analyzed by examining strong and weak events, which are <strong>of</strong> high and low intensity. The strong events<br />
are probably preceded by an open ridge over Europe and a cyclogenesis over the Mediterranean Sea, and their<br />
formation is followed by the stronger amplification <strong>of</strong> a Rossby wave packet across Eurasia. On the other hand, the<br />
weak events are likely to be triggered by surface cold anomalies over Siberia. These results advance our understanding<br />
<strong>of</strong> USB and its relationship with East Asian winter monsoon (EAWM) activities (See Figure 12). For more details, please<br />
refer to Cheung et al. (2013).<br />
Figure 12. Climatological structure <strong>of</strong> wintertime USB events. The vertical pr<strong>of</strong>iles <strong>of</strong> (a) temperature (unit: °C) and (b)<br />
height (unit: m) across their centers, where the contours and shading indicate the tendencies and anomalies. For the<br />
tendency term, the solid (dashed) contours represent positive (negative) values and the zero contours are omitted,<br />
where the unit is °C day -1 in (a) and m day -1 in (b). (c) A composite map on day 0: geopotential height at 500 hPa<br />
(contours; unit: m) and thickness air temperature anomalies in the 1000–300 hPa layer (shading; unit: °C). In (c), the<br />
cross indicates the mean center, the square box encloses the central region <strong>of</strong> the blocking high, and the arrow line<br />
represents the median <strong>of</strong> the extension.<br />
The evolution <strong>of</strong> a Ural-<br />
Siberian blocking event forms<br />
a dynamic linkage with the<br />
Siberian high, in which the<br />
decay stage <strong>of</strong> the blocking<br />
event is accompanied by a<br />
southeastward migration<br />
<strong>of</strong> the Siberian high and a<br />
subsequent cold air outbreak<br />
in East Asia.<br />
15
16<br />
Reference:<br />
Cheung, H. N., W. Zhou, H. Y. Mok, M. C. Wu and Y. P. Shao, 2013: Revisiting the climatology <strong>of</strong> atmospheric blocking<br />
in the northern hemisphere. Adv. Atmos. Sci., 30, 397–410, doi: 10.1007/s00376-012-2006-y.<br />
C. Modeling and Prediction<br />
C1. A new perspective on the excitation <strong>of</strong> low-tropospheric mixed rossby-gravity waves in<br />
association with energy dispersion<br />
(PI: Francis TAM)<br />
A number <strong>of</strong> observational studies have indicated that TCs in WNP<br />
can sometimes lead to dispersion <strong>of</strong> energy mediated by low-level<br />
Rossby waves, thereby inducing disturbances or even TC genesis<br />
events in the southeast direction. It has been proposed that TCs<br />
can be an important source <strong>of</strong> wave activity in WNP (Sobel and<br />
Bretherton, 1999). This study investigates the synoptic-scale<br />
equatorial response to Rossby wave energy dispersion associated<br />
with <strong>of</strong>f-equatorial wave activity sources and proposes a new<br />
mechanism for triggering low-level mixed Rossby gravity (MRG)<br />
waves. First, a case study based on observations reveals the<br />
southeastward energy dispersion and generation <strong>of</strong> a coherent<br />
wave train associated with a tropical cyclogenesis event in the<br />
western north Pacific. The southeastward-propagating energy<br />
packet gave rise to the equatorial atmospheric response with a<br />
similar temporal scale and a structure resembling an equatorially-trapped MRG wave (figure not shown).<br />
The MRG excitation mechanism due to <strong>of</strong>f-equatorial energy dispersion was then verified by using a baroclinic<br />
multilevel anomaly model. In addition, the sensitivity <strong>of</strong> the equatorial responses under different background flow<br />
conditions corresponding to the El Niño and La Niña years was also examined. Figure 13 shows the time evolution<br />
<strong>of</strong> the low-level wind response to a heating impulse (peaking on “day 5” <strong>of</strong> modeling time) at an <strong>of</strong>f-equatorial WNP<br />
location, based on integration <strong>of</strong> the baroclinic anomaly model. In the early stage, low-level cyclonic circulations are<br />
seen north <strong>of</strong> 10ºN. However, note that the wave responses gradually become sensitive to the imposed El Niño/La<br />
Niña-like background flow. On day 8, during El Niño years, the energy dispersion generates the maximum equatorial<br />
meridional winds southeast <strong>of</strong> the heating source, leading to a cyclonic circulation symmetric about the equator<br />
at 170ºE. The equatorial response is consistent with the MRG wave structure and continues to expand eastward<br />
while the MRG phase propagates westward. On day 10, the MRG response shifts eastward to the dateline. In sharp<br />
contrast, during La Niña years, the low-tropospheric equatorial response is confined to the west <strong>of</strong> 160ºE; moreover,<br />
the equatorial wave packet migrates westward, indicating westward energy propagation. The above suggests that<br />
the prevalence <strong>of</strong> the low-level westerly flow, the associated zonal wind convergence and the easterly vertical wind<br />
shear (all <strong>of</strong> which typically occur during El Niño events) can be favorable for the southeastward-propagating energy<br />
dispersion and equatorial MRG response. In addition, the mean flow can strongly affect the extent <strong>of</strong> equatorial wave<br />
response and modulate its phase and group velocity due to the “Doppler shift effect”.<br />
The western north Pacific (WNP)<br />
is one region over which tropical<br />
cyclones (TC) are particularly active.<br />
Here we study the properties <strong>of</strong><br />
a type <strong>of</strong> tropical disturbances in<br />
WNP which are closely related with<br />
TC activities. Our results could<br />
lead to better understanding <strong>of</strong> the<br />
relationship between TC genesis<br />
and the ambient circulation in the<br />
Tropics.
Figure 13. Time evolution <strong>of</strong> the anomaly model wind vectors (see scale arrow at upper right) and normalized<br />
meridional wind (contour, with the interval <strong>of</strong> 0.2ms -1) for the El Niño (left panel) and La Niña (right panel) runs at day<br />
6, 8, 10 and 12. The wind vectors with wind speed less than 0.01 m s -1 are masked.<br />
Reference:<br />
Chen, G., and C.-Y. Tam, <strong>2012</strong>: A new perspective on the excitation <strong>of</strong> low-tropospheric MRG waves in association<br />
with energy dispersion, J. Atmos. Sci. 69, 1397-1403. DOI: 10.1175/JAS-D-11-0331.1<br />
Sobel, A. H., and C. S. Bretherton, 1999: Development <strong>of</strong> synoptic-scale disturbances over the summertime tropical<br />
northwest Pacific. J. Atmos. Sci., 56, 3106–3127.<br />
17
18<br />
C2. Development <strong>of</strong> a multi-model-based seasonal prediction system for extreme droughts<br />
and floods<br />
(PI: Francis TAM)<br />
It is known that the MME method can usually result in<br />
more accurate forecasts owning to better sampling <strong>of</strong><br />
uncertainties related to model formulations. In addition,<br />
statistical post-processing can lead to further reduction<br />
<strong>of</strong> model biases, and in many cases, can tap into the<br />
predictability <strong>of</strong> some local variable if the latter is related<br />
to the large-scale circulation patterns that are well-<br />
resolved by coarse-resolution numerical models. In this<br />
study, an experimental, district-level DMME prediction<br />
system was developed to forecast droughts and floods<br />
over South Korea in order to properly represent local<br />
precipitation extremes. Based on the APEC Climate<br />
Center (APCC) MME seasonal prediction products,<br />
three-month lead precipitation forecasts for 60 stations<br />
in South Korea for the season <strong>of</strong> March to May are first<br />
obtained from the coarse-scale MME prediction using<br />
statistical downscaling. Because <strong>of</strong> the relatively small variance <strong>of</strong> the MME and regression-based downscaling<br />
outputs, the statistically downscaled MME (DMME) products need to be further processed using variance inflation.<br />
The final station-scale precipitation predictions are then used to produce drought and flood forecasts on the basis <strong>of</strong><br />
the Standardized Precipitation Index (SPI).<br />
Extreme droughts and floods result<br />
in tremendous economic, social, and<br />
environmental losses. Developing a reliable<br />
Figure 14 shows the performance <strong>of</strong> SPI predictions based one the non-inflated DMME output, as well as those<br />
from three different inflation schemes M1, M2 and M3. In M1, DMME results are inflated by a factor that is inversely<br />
proportional to the correlation between the original and downscaled time series. In M2, DMME products are multiplied<br />
by the ratio between the standard deviation <strong>of</strong> the observations and that <strong>of</strong> the prediction product values. For M3,<br />
the inflation factor in M2 is further multiplied by a weighting factor which depends on the magnitude <strong>of</strong> local variability<br />
<strong>of</strong> the DMME results. Of these three schemes, M2 which simply rescales the variance <strong>of</strong> predicted rainfall to that<br />
based on climate records, irrespective <strong>of</strong> the prediction skill or the DMME variance itself at a particular station, gives<br />
the best overall improvement in the SPI predictions. However, systematic biases in the prediction system cannot be<br />
removed by variance inflation. This implies that DMME techniques must be further improved in order to correct the<br />
bias in extreme drought/flood predictions. Overall, it is seen that DMME, in conjunction with variance inflation, can<br />
predict hydrological extremes with reasonable skill. Our results could inform the development <strong>of</strong> a reliable early-<br />
warning system for droughts and floods, which is invaluable to policymakers and stakeholders in agricultural and<br />
water management sectors, and is important for mitigation and adaptation measures.<br />
prediction system for hydrological extremes is<br />
essential to the preparedness <strong>of</strong> stakeholders<br />
and policymakers in agricultural planning,<br />
water management, etc. Here we seek to<br />
develop a reliable long-lead, multi-model<br />
ensemble (MME)-based seasonal prediction<br />
system for drought and flood occurrences<br />
in South Korea, using the downscaled MME<br />
(DMME) method and the inflation <strong>of</strong> the<br />
variability <strong>of</strong> the prediction products.
Reference:<br />
Figure 14. TCCs <strong>of</strong> SPI3s ending in May during 1983-<br />
2003 between observations and for (a) not-inflated and<br />
(b) M1, (c) M2, and (d) M3 inflated DMME predictions.<br />
The temporal correlations averaged over 60 stations<br />
are provided in bottom right <strong>of</strong> each panel.<br />
Sohn, S.-J., C.-Y. Tam and J.-B. Ahn, <strong>2012</strong>: Development <strong>of</strong> a multi-model-based seasonal prediction system for<br />
extreme droughts and floods: A case study for South Korea, Int. J. Climatol., DOI: 10.1002/joc.3464.<br />
C3. Six-month lead downscaling prediction <strong>of</strong> winter-spring drought based on multi-model<br />
ensemble<br />
(PI: Francis TAM)<br />
In this study, we investigated the use <strong>of</strong> the APEC<br />
Climate Center (APCC) 1-Tier multi-model ensemble<br />
(MME) products for predicting winter-to-spring<br />
drought events over East Asia. Extreme droughts were<br />
identified by computing the values <strong>of</strong> the standardized<br />
precipitation evapotranspiration index (SPEI; Vicente-<br />
Serrano et al., 2010). SPEI is found based on both<br />
precipitation and temperature changes. Thus, by<br />
using SPEI in assessing hydrological variations, the<br />
impact <strong>of</strong> global warming on the balance between<br />
Precipitation deficits have impacts on several<br />
hydrological sectors such as the ground water,<br />
reservoir storage, soil moisture, snowpack, and<br />
streamflow. Over many extratropical East Asian<br />
locations, rainfall accumulated in winter can be<br />
very important in determining the springtime<br />
drought condition. Here we investigate the<br />
potential <strong>of</strong> using statistically post-processed<br />
seasonal forecast model outputs for long-lead<br />
drought prediction.<br />
19
20<br />
precipitation and evapotranspiration is incorporated. We found that 1-Tier MME has difficulties in capturing the local<br />
temperature and rainfall variations over East Asian extratropical land areas, and has no skill in predicting SPEI during<br />
boreal winter and spring. On the other hand, temperature and precipitation predictions were substantially improved<br />
in the downscaled MME (DMME). Thus, DMME, in conjunction with variance inflation, was used for predicting SPEI in<br />
the winter-to-spring period over 60 stations in South Korea.<br />
Figure 15 shows the temporal correlation coefficients and also the linear error in probability score (LEPS) for the six-<br />
month SPEI ending in May from raw MME and DMME. It can be seen that there is marked skill improvement in SPEI<br />
predictions brought about by DMME. Thus is due to the fact that statistical downscaling can correct a large part <strong>of</strong><br />
the systematic errors in temperature and precipitation. The difference between raw MME- and DMME- based SPEI<br />
is shown in Figure 15b. Overall, DMME, in conjunction with variance inflation, can significantly improve the skill <strong>of</strong> the<br />
six-month-lead forecasts <strong>of</strong> SPEI in the most <strong>of</strong> regions. Our results could lead to more reliable hydrological extreme<br />
predictions for policymaker and stakeholders in the water management sector, and for better mitigation and climate<br />
adaptations.<br />
Figure 15. Scatter plots <strong>of</strong> temporal correlation coefficients (x-axis) and LEPS scores (y-axis) between the observed<br />
and predicted 6-month SPEI, for (a) original skills and (b) those difference between DMME and MME. In panel (a), each<br />
red (blue) point represents the results based on downscaled (raw) MME predictions for one station location.<br />
Reference:<br />
Sohn, S.-J., J.-B. Ahn and C.-Y. Tam, 2013: Six-month lead downscaling prediction <strong>of</strong> winter-spring drought in South<br />
Korea based on multi-model ensemble, Geophys. Res. Lett., in press.<br />
Vicente-Serrano, S. M., S. Begueria, and J. I. Lopez-Moreno (2010), A multiscalar drought index sensitive to global warming:<br />
The Standardized Precipitation Evapotranspiration Index, J. Climate, 23, 1696-1718, doi:10.1175/2009JCLI2909.1.
C4. Regional climate simulations <strong>of</strong> summer diurnal rainfall variations over East Asia and<br />
Southeast China<br />
(PI: Johnny CHAN)<br />
In this study, the evaluation focuses on the sensitivity <strong>of</strong> the choice <strong>of</strong><br />
cumulus parameterizations and model domain. With the right setup, the<br />
spatial and temporal evolution <strong>of</strong> diurnal rainfall over Southeast China, which<br />
has not been well simulated by past studies, can be accurately simulated<br />
by RegCM3. Results show that the Emanuel cumulus scheme has a more<br />
realistic simulation <strong>of</strong> summer mean rainfall in East Asia, while the GFC (Grell<br />
scheme with the Frisch-Chappell convective closure assumption) scheme<br />
is better in simulating the diurnal variations <strong>of</strong> rainfall over Southeast China<br />
(Table 2). The better performance <strong>of</strong> these two schemes [relative to the other<br />
two schemes in RegCM3: the Kuo scheme and the GAS (Grell scheme with<br />
the Arakawa–Schubert closure assumption) scheme] can be attributed to<br />
the reasonable reproduction <strong>of</strong> the major formation mechanism <strong>of</strong> rainfall —<br />
the moisture flux convergence — over Southeast China. Furthermore, when<br />
the simulation domain covers the entire Tibetan Plateau, the diurnal variations <strong>of</strong> rainfall over Southeast China are<br />
found to exhibit a noticeable improvement without changes in the physics schemes.<br />
Table 2. Selected statistical variables for measuring the ability <strong>of</strong> model in simulating different components <strong>of</strong><br />
precipitation formation over the domain <strong>of</strong> SEC.<br />
Comp. Field<br />
Obs EMU1 GFC1 GAS1 AK1 EMU2 GFC2 GAS2 AK2<br />
P Value (unit: mmh-1) –<br />
0.39 0.37 0.31 0.22 0.48 0.43 0.19 0.31 0.30<br />
Scorr 0.52 0.44 0.35 0.46 0.41 0.28 0.32 0.38<br />
RMSE (unit: mmh -1) 0.09 0.11 0.15 0.14 0.11 0.22 0.18 0.16<br />
ΔP Tcorr 0.82 0.90 0.15 0.43 0.61 0.76 0.11 0.38<br />
Scorr at 09 UTC 0.54 0.91 0.12 -0.07 0.47 0.62 0.05 -0.03<br />
RMSE at 09 UTC (unit: mmh -1) 0.28 0.14 0.47 0.45 0.46 0.41 0.60 0.59<br />
S1 Var[S1(P)]/Var[ΔP] (unit: %) 64.8 75.1 69.7 44.9 73.5 72.4 57.7 61.6 72.7<br />
Ampitude (unit: mmh -1) 0.19 0.16 0.20 0.02 0.08 0.22 0.17 0.03 0.09<br />
Tcorr 0.87 0.93 -0.54 -0.10 0.66 0.78 -0.15 -0.34<br />
Scorr at 09 UTC 0.49 0.93 -0.61 -0.14 0.33 0.86 -0.14 -0.02<br />
RMSE at 09UTC (unit: mmh -1) 0.24 0.12 0.41 0.43 0.35 0.32 0.42 0.45<br />
S2 Var[S2(P)]/Var[ΔP] (unit: %) 31.1 18.9 26.2 48.1 21.4 24.3 30.3 28.5 21.2<br />
Ampitude (unit: mmh -1) 0.13 0.07 0.12 0.01 0.05 0.08 0.11 0.01 0.04<br />
Tcorr 0.94 0.90 0.82 0.91 0.68 0.73 0.62 0.69<br />
Scorr at 09 UTC 0.63 0.84 0.65 0.64 0.54 0.65 0.51 0.52<br />
RMSE at 09 UTC (unit: mmh -1) 0.03 0.02 0.04 0.03 0.11 0.09 0.18 0.14<br />
Note: The smallest value <strong>of</strong> RMSE and the Scorr, as well as Tcorr (temporal correlation), exceeding the 95% confidence<br />
–<br />
level is in bold. The spatial pattern <strong>of</strong> P, S1(P) at 09 UTC and S2(P) at 09 UTC is referred to Fig. 8, Fig. 9 and Fig. 10 in<br />
Huang et al. (<strong>2012</strong>) respectively.<br />
Obs vs. Simulations<br />
This study evaluates the<br />
capability <strong>of</strong> RegCM3 in<br />
simulating the summer<br />
precipitation over East<br />
Asia, with focus on diurnal<br />
variations <strong>of</strong> precipitation<br />
over Southeast China during<br />
the 1998-2002 summer<br />
seasons.<br />
21
22<br />
Reference:<br />
Huang WR, Chan JCL, Au-Yeung AYM (<strong>2012</strong>) Regional climate simulations <strong>of</strong> summer diurnal rainfall variations over<br />
East Asia and Southeast China. Clim. Dyn DOI: 10.1007/s00382-012-1457-2<br />
D. Air Quality<br />
D1. On-road plume chasing and analysis system (OPCAS) for on-road vehicle emission and<br />
ambient air quality inspection<br />
(PI: Zhi NING)<br />
Deteriorating air quality in major urban cities in mainland China and in <strong>Hong</strong><br />
<strong>Kong</strong> has raised increasing concerns <strong>of</strong> their impact on the environment and<br />
public health. Major components <strong>of</strong> the air pollutants with special concerns<br />
are Particulate Matter (PM) and Volatile Organic Compounds (VOC). PM 2.5<br />
(particles with aerodynamic diameter< 2.5μm) plays a significant role in the<br />
impairment <strong>of</strong> visibility and causing adverse human health due to their ability<br />
to penetrate into the respiratory system. VOC are important precursors for<br />
ozone formation. It has been well recognized that major sources <strong>of</strong> PM 2.5<br />
and co-pollutants in urban environment are from vehicle emissions, in particular diesel vehicles. Current emission<br />
inspection methods include chassis dynamometer, Portable emissions measurement system (PEMS), remote sensing<br />
etc. However, these methods have their limitations in terms <strong>of</strong> high operational cost, long installation time, limited<br />
emission detection capabilities etc. We introduce a complimentary and novel approach <strong>of</strong> on-road plume chasing<br />
system for fast inspection <strong>of</strong> on-road vehicle emissions and traffic source emissions through a mobile platform with<br />
on-board high time resolution, low detection limit equipment. Combined with fuel carbon balance method as in<br />
Equation 1, we are able to quantify the vehicle emission factors <strong>of</strong> PM mass, number, black carbon, criteria gas<br />
pollutants etc. It provides a unique platform for fast and efficient determination <strong>of</strong> vehicle emissions with different fleet<br />
and fuels (diesel and biodiesel, LPG and petrol), different operating conditions etc. Current on-going research will<br />
develop the on-road vehicle emission inventory and the tunnels emission factors in <strong>Hong</strong> <strong>Kong</strong>.<br />
Equation 1<br />
EFp: emission factors <strong>of</strong> pollutant with unit “g <strong>of</strong> pollutants per kg <strong>of</strong> fuel burnt”; w c : carbon in fuel; MW: molecular<br />
weight; ∆: Concentration plume – Concentration baseline<br />
Figure 16. The setup <strong>of</strong> the OPCS in a mobile platform.<br />
This study delivers a novel<br />
mobile source emission test<br />
platform to complement<br />
existing methodologies and<br />
provide real world emission<br />
information <strong>of</strong> on-road fleets.
Figure 17. A typical time series pollutants measurement (PM and VOC) in cross-harbor tunnel in <strong>Hong</strong> <strong>Kong</strong>.<br />
Reference:<br />
PM, NOx, and butane emissions from on-road vehicles using plume chasing approach and their implications on<br />
emission control policy. Zhi Ning, Maimaitireyimu Wubulihairen, Fenhuan Yang. Better Air Quality Conference, <strong>Hong</strong><br />
<strong>Kong</strong>. December, <strong>2012</strong>. Poster.<br />
23
24<br />
D2. Black carbon source identification during biomass burning episodes using an integrated<br />
approach<br />
(PI: Zhi NING)<br />
Biomass burning is the largest source <strong>of</strong> primary fine<br />
carbonaceous particles and the second largest source <strong>of</strong><br />
trace gases on a global scale, contributing to climate change<br />
and regional air pollution. This study investigated the most<br />
serious black carbon episodes in <strong>Hong</strong> <strong>Kong</strong> (HK) that<br />
occurred on 22 February, 18 March and 6, 20, 21 December<br />
2010. The contributing sources were identified using an integrated approach <strong>of</strong> ground-based measurement,<br />
satellite data analysis and model simulations. Hourly maximum Black Carbon (BC) concentrations from ground-<br />
based measurement in <strong>Hong</strong> <strong>Kong</strong> ranged from 15.6 to 18.9 µg m -3 in the episodic days, while the correlation<br />
coefficients between hourly BC and carbon monoxide (CO) concentrations, vary from 0.88 to 0.97 during and daily<br />
ΔBC/ΔCO ratios for these episodes were between 9.05 to 13.1 ng m -3/ppbv, significantly higher than their seasonal<br />
averages. Nss-K + (daily), another indicator, correlates positively with BC (R =0.52) for nss-K + concentrations above<br />
the 80th percentile. Fire pixel counts from satellite measurement showed the intensity <strong>of</strong> biomass burning in 2010 was<br />
strongest in Africa, Southwest China and Indochina, followed by North/Central, South China and India. Except for<br />
North/Central China, all sources are upwind <strong>of</strong> <strong>Hong</strong> <strong>Kong</strong>/Pearl River Delta (HK/PRD) when the northeast monsoon<br />
and the mid/upper-tropospheric westerlies (subtropical jet) prevail. GEOS-Chem simulations were also performed<br />
and the results indicate that biomass burning sources contribute most significantly to the BC episodes in the spring<br />
<strong>of</strong> 2010, with Indochina being the major contributor <strong>of</strong> surface BC in <strong>Hong</strong> <strong>Kong</strong> for both winter and spring. Our<br />
model sensitivity analysis complementary with MODIS–based fire map(s), high-level vector wind plots and backward<br />
trajectory analysis suggests that these BCs are not only contributed by Indochina, but also contributed by Indian<br />
subcontinent, South China and Africa (particularly for the December episodes).<br />
Figure 18. Black carbon and carbon monoxide relation during normal period and biomass<br />
burning episodes.<br />
This study has set a model <strong>of</strong> integrated<br />
approach to identify the black carbon<br />
episodes in an urban area.
Reference:<br />
Figure 19. GEOS-Chem simulations: source regions <strong>of</strong> BC from biomass burning.<br />
An integrated approach to identify the biomass burning sources contributing to black carbon episodes in <strong>Hong</strong> <strong>Kong</strong><br />
(South China), Y.C. Lee, Y.F. Lam, Gerrit Kuhlmann, Z. Ning, Mark Wenig, K.L.Chan, Atmos. Environ. (submitted).<br />
D3. Black carbon mixing state and size distribution for climate forcing estimation<br />
(PI: Zhi NING)<br />
Particle bound black carbon (BC) has dominant anthropogenic origins<br />
from fossil fuel combustion and biomass burning sources. It is an<br />
important component <strong>of</strong> the light absorbing aerosols in the atmosphere,<br />
playing a role in the earth’s radiative balance and climate change.<br />
While the mixing states <strong>of</strong> the BC largely determine the coating on the<br />
particles, knowledge <strong>of</strong> the size distribution <strong>of</strong> BC is key to the accurate<br />
modelling <strong>of</strong> their absorption <strong>of</strong> solar radiation. Also, BC is a major<br />
component <strong>of</strong> the diesel PM emissions, recently classified by World<br />
Health Organization as Category I Carcinogen, and has been widely<br />
documented with association <strong>of</strong> a variety <strong>of</strong> adverse health effects.<br />
This study has presented a<br />
novel and efficient approach to<br />
measure the black carbon size<br />
distribution and made use <strong>of</strong> the<br />
method to identify the evolution<br />
<strong>of</strong> possible coating on black<br />
carbon from source to ambient.<br />
Their sizes also determine the fraction <strong>of</strong> lung deposition. Due to the limited information <strong>of</strong> the mixing state and size<br />
distribution <strong>of</strong> BC, there still exists large uncertainty <strong>of</strong> the role <strong>of</strong> BC in climate change modelling. This study presents<br />
a novel approach <strong>of</strong> the direct and continuous measurement <strong>of</strong> atmospheric BC size distribution and coating by<br />
tandem operation <strong>of</strong> a differential mobility analyzer and a modified aethalometer. A condensation particle counter<br />
was deployed concurrently with the aethalometer to determine the particle number size distribution. A wide range <strong>of</strong><br />
particle sizes (15-700nm) was investigated to determine the BC mass size distribution in fresh diesel engine tailpipe<br />
emissions and different ambient environments including urban and roadside. The results showed the evolution <strong>of</strong> BC<br />
25
26<br />
mixing state and size distribution from fresh engine emissions to the roadside and urban ambient environments with<br />
increased mode diameter <strong>of</strong> black carbon particles indicating the increased coating layer due to condensation and<br />
external mixing processes. The results provide important Reference for climate modelling to better determine the<br />
effect <strong>of</strong> radiative forcing from urban aerosols.<br />
Figure 20. Reduction <strong>of</strong> noise from aethalometer by flow adjustment and running average filtering.<br />
Figure 21. The particle number and black carbon size distributions from (a) fresh diesel engine emissions with BC<br />
peak at 120nm; and (b) roadside environment with BC peak at 200 nm.<br />
Reference:<br />
(a)<br />
(a)<br />
Black carbon size distribution and mixing states in fresh and aged particles using a novel tandem differential mobility<br />
analyzer and aethalometere. Zhi Ning, Dane Westerdahl, Ka Chun Joe, K.L. Chan. Atmos. Environ. (submitted).
D4. A novel approach by dispersive absorption spectroscopy (DAS) for water interference<br />
free greenhouse gas measurement.<br />
(PI: Zhi NING)<br />
This study delivers a very<br />
promising method to measure the<br />
greenhouse gas concentration in the<br />
atmosphere with effective removal<br />
<strong>of</strong> interference from water vapor for<br />
long term and field deployment.<br />
Increasing greenhouse gas concentration in a global scale in<br />
the last century has been largely regarded as responsible for<br />
the climate change, extreme weather events and rise <strong>of</strong> global<br />
temperatures. The greenhouse gases are emitted mainly from<br />
anthropogenic combustion processes with carbon dioxide being<br />
the major component. The mitigation <strong>of</strong> global climate change<br />
and reduction <strong>of</strong> carbon emissions are the most urgent agenda<br />
for the sustainable development on a global scale. These efforts<br />
require a massively expanded monitoring (and modeling) effort<br />
spanning fundamental laboratory research as well as extensive and remote monitoring. The currently existing CO 2<br />
and other greenhouse gas measurement methods are mostly based on non-dispersive infrared (NDIR) absorption<br />
approach. However, the interference <strong>of</strong> water vapor has been a major issue limiting the accuracy and stability <strong>of</strong> such<br />
method. We have proposed a new design <strong>of</strong> dispersive absorption spectroscopy using Febry-Perot Interferometer<br />
(FPI) to differentiate the CO 2 and water vapor absorption, and achieve interference free measurement <strong>of</strong> CO 2 gases.<br />
62 channel <strong>of</strong> mid infrared range wavelengths were selected to cover the absorption spectrum <strong>of</strong> both CO 2 and water<br />
vapor by scanning at a frequency <strong>of</strong> 8 seconds. The raw absorption spectral and 2 order polynomial fitting technique<br />
were used to identify the individual molecular intensity through the gas cell for concentration determination. A great<br />
agreement <strong>of</strong> this new method was achieved with comparison to commercially available products.<br />
Figure 22. The working principle <strong>of</strong> Febry-Petot Interferometer.<br />
Figure 23. Typical fitting curve and residuals <strong>of</strong> CO 2 measurement.<br />
27
28<br />
Figure 24. Comparison <strong>of</strong> the DAS and NDIR measurement.<br />
Figure 25. Photos <strong>of</strong> the DAS prototype.<br />
D5. Regional climate and local air quality study<br />
(PI: Wen ZHOU)<br />
D5.1 South China flooding<br />
Results show that the large-scale circulation pattern favorable for<br />
precipitation was maintained. In the upper level, the South Asian<br />
High and westerly jet stream provided a divergent circulation<br />
over South China. In the middle and low levels, an anomalous<br />
strong subtropical high (STH) extended to the South China Sea.<br />
The southwesterly monsoon flow along the northwest bank <strong>of</strong><br />
the STH transported abundant water vapor from the western<br />
The climatic anomalies and related<br />
mechanism responsible for June<br />
heavy rainfall in South China are<br />
analyzed in this study.<br />
North Pacific, the Bay <strong>of</strong> Bengal, and the South China Sea to South China. The precipitation can be classfied into two<br />
types: the West Siberia low (WSL)-induced low-level cyclone mode, and the STH-induced low-level jet mode. STH<br />
and WSL indices are defined to estimate the infuence <strong>of</strong> these two systems, respectively. Analysis shows that both are<br />
critical for precipitation, but their respective contributions differ from year to year. In 2010, both were important factors<br />
for the heavy rainfall in Jun (See Figure 26). For more details, please refer to Yuan et al. (<strong>2012</strong>).
Figure 26. Precipitation <strong>of</strong> (a) June 2010 (mm), (b) long-term mean condition (1981-2010, mm), (c) precipitation<br />
anomaly <strong>of</strong> 2010, and (d) precipitation anomaly percentage <strong>of</strong> 2010.<br />
Reference:<br />
Yuan, F., W. Chen and W. Zhou, <strong>2012</strong>: Analysis <strong>of</strong> the role played by circulation in the persistent precipitation over<br />
South China in June 2010. Adv. Atmos. Sci. 29, 769-781<br />
D5.2 Hydrometeorological extremes over the Korean peninsula<br />
Recent studies that characterize central tropical Pacific warming<br />
(<strong>of</strong>ten referred to as El Niño Modoki) and its teleconnections<br />
to East Asia show coherent teleconnection patterns during<br />
boreal summer. Observed increases in the frequency <strong>of</strong> El Niño<br />
Modoki and a lack <strong>of</strong> understanding regarding its impacts on<br />
precipitation over the Korean Peninsula motivate our work. In<br />
this study, we investigate the regional precipitation patterns over<br />
South Korea associated with El Niño and El Niño Modoki events<br />
during the June-September season. The results show significant<br />
and consistent increases in the seasonal precipitation totals and<br />
The analysis presented here<br />
provides an improved understanding<br />
<strong>of</strong> the potential impacts <strong>of</strong> the<br />
tropical Pacific sea surface<br />
temperature on warm-season (June-<br />
September) water availability and<br />
hydrometeorological extremes over<br />
the Korean Peninsula.<br />
29
30<br />
maximum precipitation as well as extreme rainy days during the decay <strong>of</strong> El Niño Modoki. In contrast, moisture flux<br />
into South Korea is weaker in the case <strong>of</strong> the eastern Pacific El Niño (See Figure 27). For more details, please refer to<br />
Kim et al. (<strong>2012</strong>).<br />
Figure 27. Empirical probability density function for the seasonal rainfall composite anomalies (June-September) for<br />
the five major river basins in South Korea. The red line indicates the distribution <strong>of</strong> seasonal rainfall anomalies during<br />
the canonical El Niño. The blue line shows precipitation variability during ENSO Modoki events. In each figure, symbols<br />
on the bottom line represent rainfall anomalies corresponding to El Niño years (red circles) and ENSO Modoki years<br />
(blue triangles).<br />
Reference:<br />
Kim, J. S., W. Zhou, X. Wang, and Shaleen Jain, <strong>2012</strong>: El Niño modoki and the summer precipitation variability over<br />
South Korea: A diagnostic study. J. Meteor. Soc. Japan. 90, 673-684. Doi: 10.2151/jmsj.<strong>2012</strong>-507<br />
D5.3 Local air quality<br />
Results shows that significantly negative correlations were found when<br />
Niño 3 led particulate matter ≤10 μm PM 10) and NO 2 by 2–3 months over<br />
the <strong>Hong</strong> <strong>Kong</strong> territory, while the other pollutants (e.g., O 3, SO 2) showed<br />
modest correlations. A significant decreasing trend in visibility was<br />
observed during the autumn and winter, which has potential implications<br />
for the air-quality degradation and the endangerment <strong>of</strong> human health<br />
in <strong>Hong</strong> <strong>Kong</strong>. In an El Niño summer, the visibility was relatively better,<br />
This study presents an<br />
exploratory analysis aimed at<br />
improving understanding <strong>of</strong><br />
the variability <strong>of</strong> <strong>Hong</strong> <strong>Kong</strong><br />
air quality associated with<br />
different climate conditions.
while visibility in other seasons was diminished. On the other hand, in La Niña events, significant changes occurred<br />
in visibility in winter and autumn. Air pollution indices were less sensitive to the South China Summer Monsoon<br />
(SCSM), but a relatively good relationship existed between the East Asian Winter Monsoon (EAWM) and air pollutants.<br />
Rainfall was lower during most <strong>of</strong> the strong EAWM years compared to the weak years. This result suggests that the<br />
pollutants that accumulate in <strong>Hong</strong> <strong>Kong</strong> are not easy to be washed out, so concentrations remain at a higher level.<br />
Finally, based on the conditional Air Pollution Index (API) risk assessment, site-specific vulnerabilities were analyzed<br />
to facilitate the development <strong>of</strong> the air-quality warning systems in <strong>Hong</strong> <strong>Kong</strong> (See Figure 28). For more details, please<br />
refer to Kim et al (2013).<br />
Figure 28. Correlation between ENSO (lag −2) and air pollution indices (PM 10, O 3, NO 2, SO 2) in <strong>Hong</strong> <strong>Kong</strong> during<br />
the period 2001–2009. For each case, only values that are at least 90% significant are marked with a colored circle.<br />
Reference:<br />
Kim, J.-S., W. Zhou, H. N. Cheung, and C.H. Chow, 2013: Variability and risk analysis <strong>of</strong> <strong>Hong</strong> <strong>Kong</strong> air-quality based<br />
on monsoon and El Niño conditions. Adv. Atmos. Sci., 30, 280-290. Doi: 10.1007/s00376-012-2074-z<br />
31
32<br />
D6. Climatic impacts from the change <strong>of</strong> tropical cyclone on regional air quality<br />
(PI: Nicky LAM)<br />
The main objective <strong>of</strong> this project is to study the effect <strong>of</strong><br />
climate change on tropical cyclones (TC) and its subsequent<br />
effect to regional air quality in Pearl River Delta (PRD). The<br />
analyses were based on the long-term TC track records<br />
from the <strong>Hong</strong> <strong>Kong</strong> Observatory along with the air quality<br />
monitoring data obtained from <strong>Hong</strong> <strong>Kong</strong> Environmental<br />
Protection Department (HKEPD). Previous research has<br />
shown that the frequency <strong>of</strong> TC track has been shifted due to<br />
the increase <strong>of</strong> Sea Surface Temperature (SST) in the Pacific<br />
Ocean (Tu et al., 2009). On the other hand, there are some case studies on the development <strong>of</strong> pollution episodes in<br />
PRD induced by TC (Lee et al. 2002; Lee and Savtchenko, 2005; Yang et al. <strong>2012</strong>). Figure 29 shows the change <strong>of</strong> TC<br />
track density from 1991 to 2010. The data have been intentionally divided into two groups for investigating the impact<br />
<strong>of</strong> climate change on TC track (10 years/group; 1991-2000 and 2001-2010). Apparently, a decrease <strong>of</strong> TC track density<br />
has been observed in the South China Sea (region 1) and east <strong>of</strong> the Philippines (region 3) from 1991-2000, shown in cold<br />
color, while the increase <strong>of</strong><br />
TC track density has been<br />
found in the Taiwan region<br />
(region 2) and parts <strong>of</strong> the<br />
Pacific Ocean, shown in<br />
warm color. The average<br />
change <strong>of</strong> TC track<br />
densities in region 1 & 3<br />
and region 2 were about<br />
-0.3 TC and +0.6 TC,<br />
respectively.<br />
Figure 29. TC track<br />
density difference for the<br />
period <strong>of</strong> 2001-2010 minus<br />
1991-2000 from May –<br />
August<br />
During summer, the occurrence <strong>of</strong> TC in the Taiwan Strait or the west <strong>of</strong> Taiwan (region 2) has an effect on regional<br />
atmospheric circulation. It results in the change <strong>of</strong> prevailing wind from southerly to northwesterly, bringing large<br />
amounts <strong>of</strong> air pollutants from industrial areas <strong>of</strong> southern China to the PRD areas. Moreover, the outer high-pressure<br />
condition induced by TC also traps the air pollutants, preventing it to disperse vertically and causing elevated air<br />
pollution levels. Figure 30 shows the O 3 concentration in summer (i.e., May to August) from 1995 to 2010 from the<br />
monitoring station at Yuen Long. The result indicated that the number <strong>of</strong> exceedance in summer from region 2 was<br />
much higher than the ones from region 1, region 3 and non-TC period. The average O 3 occurrence from region 1, 2,<br />
3 and non-TC period was “2.1”, “5.2”, “0.3” and “2.0”.<br />
The relationship <strong>of</strong> the passage <strong>of</strong><br />
Tropical Cyclone in the western North<br />
Pacific and air quality in Pearl River Delta<br />
in 1991-2010 is investigated. The result<br />
shows that the change <strong>of</strong> TC passage<br />
increases the number <strong>of</strong> exceedance <strong>of</strong><br />
ozone level.
Figure 30. The number <strong>of</strong> exceedance <strong>of</strong> O 3 in Yuen<br />
Long beyond 110 g/m 3<br />
Reference:<br />
Tu, J. Y., C. Chou, and P. S. Chu, 2009: The abrupt<br />
shift <strong>of</strong> typhoon activity in the vicinity <strong>of</strong> Taiwan and<br />
its association with western North Pacific–East Asian<br />
climate change. J. Climate, 22, 3617–3628.<br />
Lee, Y. C., G. Calori, P. Hills, and G. R. Carmichael, 2002: Ozone episodes in urban <strong>Hong</strong> <strong>Kong</strong> 1994-1999. Atmos.<br />
Environ., 36, 1957-1968.<br />
Lee, Y. C., A. Savtchenko, 2006: Relationship between Air Pollution in <strong>Hong</strong> <strong>Kong</strong> and in the Pearl River Delta Region<br />
<strong>of</strong> South China in 2003 and 2004: An Analysis. J. Appl. Meteor. Climatol., 45, 269–282.<br />
Yang, J. X., A.K.H. Lau, J.C.H. fung, W. Zhou, M. Wenig, <strong>2012</strong>. An air pollution episode and its formation mechanism<br />
during the tropical cyclone Nuri’s landfall in a coastal city <strong>of</strong> south China. Atmos. Environ., 54, 746-753.<br />
D7. Regional climate change on future air quality in East Asia<br />
(PI: Nicky YF LAM; CO-I: Francis TAM; CO-I: Wen ZHOU)<br />
In this on-going work, the regional climate change and air quality<br />
are simulated for investigating the future climate change under the<br />
IPCC AR5 scenario (i.e., RCP8.5) using high-resolution numerical<br />
models. We have carried out dynamical downscaling on Earth<br />
System Model (CESM), for regional Weather Research Forecasting<br />
(WRF) and Community Multi-scale Air Quality (CMAQ) models. An<br />
example <strong>of</strong> simulated air quality (i.e., ozone) in the present climate<br />
simulation is shown in Figure 31, where high average ozone<br />
concentration is observed in the South China. Both climatological<br />
and air pollution are simulated through a two-way coupling under the WRF-CMAQ framework. The resolutions <strong>of</strong><br />
the simulation reach 27 km for the entire area <strong>of</strong> Asia, and 9 km for Southern China, as shown in Figure 32. We will<br />
examine the effects <strong>of</strong> aerosol feedback on future climate and how it affects the East Asian monsoon and heat wave.<br />
Moreover, it will also look into the effect <strong>of</strong> future climate on future air quality in East Asia.).<br />
Figure 31. Output (i.e., average ozone in October) from<br />
CMAQ air quality simulation in present climate in ppbv<br />
The implementation <strong>of</strong> WRF-CMAQ<br />
coupled with CESM downscaling<br />
has been completed. We will use<br />
this system to examine the effects<br />
<strong>of</strong> aerosol feedback on future<br />
climate (i.e., IPCC AR5 scenarios) in<br />
East Asia.<br />
Figure 32. The study domain<br />
33
34<br />
Publications<br />
Journal Papers<br />
Au-Yeung, A. Y. M. and J. C. L. Chan, <strong>2012</strong>: Potential use <strong>of</strong> a regional climate model in seasonal tropical cyclone<br />
activity predictions in the western North Pacific. Clim. Dyn., 39, 783-794.<br />
Chen, G., and C.-Y. Tam, <strong>2012</strong>: A new perspective on the excitation <strong>of</strong> low-tropospheric MRG waves in association<br />
with energy dispersion, J. Atmos. Sci. 69, 1397-1403. DOI: 10.1175/JAS-D-11-0331.1<br />
Cheng, C. K. M. and J. C. L. Chan, <strong>2012</strong>: Impacts <strong>of</strong> land use changes and synoptic forcing on the seasonal climate<br />
over the Pearl River Delta <strong>of</strong> China. Atmos. Environ., 60, 25-36.<br />
Cheung H.N., Zhou W., Mok H.Y. and Wu M.C., <strong>2012</strong>: Relationship between Ural-Siberian blocking and the East Asian<br />
winter monsoon in relation to the Arctic oscillation and the El Niño-Southern Oscillation, J. Climate. Doi: 10.1175/<br />
JCLI-D-11-00225.1. 25, 4242-4257.<br />
Deng Y., Shi P., Zhou W., Du Y., Xie Q., Zhuang W., Wang D.X., <strong>2012</strong>: A dipole wind curl pattern induced by Taiwan<br />
Island and its effect on upper stratification in the northeastern South China Sea. Chinese Journal <strong>of</strong> Oceanology<br />
and Limnology. 30, 944-952.<br />
Ha, K.-J., S.-J. Yoon, K.-S. Yun, J.-S. Kug, Y.-S. Jang and J. C. L. Chan, <strong>2012</strong>: Dependency <strong>of</strong> typhoon intensity and<br />
genesis locations on El Niño phase and SST shift over the western North Pacific. Theo. Appl. Climatol., 109,<br />
383-395.<br />
Huang, W.-R. and J. C. L. Chan, <strong>2012</strong>: Seasonal variation <strong>of</strong> diurnal and semidiurnal rainfall over Southeast China.<br />
Clim. Dyn., 39, 1913-1927, DOI: 10.1007/s00382-011-1236-5<br />
Jiang N.B., Cheung K., Luo K.H., Beggs. P. L. and Zhou W., <strong>2012</strong>: On two different objective procedures for classifying<br />
synoptic weather types over east Australia. Int. J. Climatol. Doi: 10.1002/joc.2373. 32, 1475-1494.<br />
Kim J. S., Li C. Y., and Zhou W., <strong>2012</strong>: Effects <strong>of</strong> the Pacific-Japan teleconnection pattern on tropical cyclone activity<br />
and extreme precipitation events over the Korean peninsula. Journal <strong>of</strong> Geophysical Research. 117. Doi:<br />
10.1029/<strong>2012</strong>JD017677.<br />
Kim, J. S., W. Zhou, X. Wang and Shaleen Jain, <strong>2012</strong>: El Niño Modoki and the Summer Precipitation Variability over<br />
South Korea: A diagnostic study. J. Meteorol. Soc. Japan. 90, 673-684. Doi: 10.2151/jmsj.<strong>2012</strong>-507<br />
Li C.Y. and Zhou W., <strong>2012</strong>: Changes in western Pacific tropical cyclones associated with the El Nino-Southern<br />
oscillation cycle. J. Climate. 25, 5864-5878. Doi: 10.1175/JCLI-D-11-00430.1.<br />
Li C. Y., Zhou W., Chan J.C .L. and Huang P., <strong>2012</strong>: Asymmetric modulation <strong>of</strong> the Western North Pacific<br />
cyclogenesis by the Madden-Julian Oscillation under ENSO conditions. J. Climate. 25, 5374-5385. Doi: 10.1175/<br />
JCLI-D-11-00337.1.<br />
Li, X. Z., Z. P. Wen, W. Zhou and D. X. Wang, <strong>2012</strong>: Atmospheric water vapor transport associated with two decadal<br />
rainfall shifts over East China. J. Meteorol. Soc. Japan. 90, 587−602. Doi: 10.2151/jmsj.<strong>2012</strong>-501.<br />
Li X.Z. and Zhou W., <strong>2012</strong>: Quasi-4-yr coupling between El Niño-Southern Oscillation and water vapor transport over<br />
East Asia-WNP, J. Climate. 25, 5879-5891. Doi: 10.1175/JCLI-D-11-00433.1.
Sohn, S.-J., C.-Y. Tam and J.-B. Ahn, <strong>2012</strong>: Development <strong>of</strong> a multi-model-based seasonal prediction system for<br />
extreme droughts and floods: A case study for South Korea, Int. J. Climatol., DOI: 10.1002/joc.3464.<br />
Sohn, S.-J., Y.-M. Min, J.-Y. Lee, C.-Y. Tam, I.-S. Kang, B. Wang, J.-B. Ahn and T. Yamagata, <strong>2012</strong>: Assessment <strong>of</strong> the<br />
long-lead probabilistic prediction based on the APCC multi-model system and a statistical model for the Asian<br />
summer monsoon precipitation (1983-2010), J. Geophys. Res., 117, D04102, doi:10.1029/2011JD016308.<br />
Wang X., Wang D.X., Zhou W. and Li C.Y., <strong>2012</strong>: Interdecadal modulation <strong>of</strong> the influence <strong>of</strong> La Nina events on Mei-yu<br />
rainfall over the Yangtze River Valley. Advances in Atmospheric Sciences, 29, 157-168, doi: 10.1007/s00376-011-<br />
1021-8.<br />
Wang X., Zhou W., Li C.Y. and Wang D.X., <strong>2012</strong>: Effects <strong>of</strong> the East Asian summer monsoon on tropical cyclone<br />
genesis over the South China Sea on interdecadal timescales, Adv. Atmos. Sci., 29, 249-262.<br />
Wu Q.Z., Wang Z.F., Chen H.S., Zhou W. and Wenig M., <strong>2012</strong>: An evaluation <strong>of</strong> air quality modeling over the Pearl River<br />
Delta during November 2006. Meteorol Atmos Phys. Doi: 10.1007/s00703-011-0179-z. 116, 113-132.<br />
Yan Y. F., Qi. Y.Q. and Zhou W., <strong>2012</strong>: Variability <strong>of</strong> tropical cyclone occurrence date in the South China Sea and its<br />
relationship with SST warming. Dynamics <strong>of</strong> Atmospheres and Oceans. 55-56,45-59.<br />
Yang J.X., Lau,AKH, Fung JCH, Zhou W, Wenig M., <strong>2012</strong>: An air pollution episode and its formation mechanism during<br />
the tropical cyclone Nun’s landfall in a coastal city <strong>of</strong> south China. Atmos. Environ., 54, 746-753.<br />
Yuan F., Chen W. and Zhou W., <strong>2012</strong>: Analysis <strong>of</strong> the role played by circulation in the persistent precipitation over<br />
South China in June 2010. Adv. Atmos. Sci. 29, 769-781.<br />
Yun, K.-S., J. C. L. Chan and K.-J. Ha, <strong>2012</strong>: Effects <strong>of</strong> SST magnitude and gradient on typhoon tracks around East<br />
Asia: A case study for Typhoon Maemi (2003). Atmos. Res., 109-110, 36-51.<br />
Zhou W., Chen W. and Wang D.X., <strong>2012</strong>: The implications <strong>of</strong> ENSO signal for South China monsoon climate, Aquatic<br />
Ecosystem Health & Management. 15, 14-19. Doi: 10.1080/14634988.<strong>2012</strong>.652050.<br />
35
36<br />
Staff list<br />
Director<br />
Pr<strong>of</strong>. Johnny CHAN Dean, School <strong>of</strong> Energy and Environment<br />
Members<br />
Chair Pr<strong>of</strong>essor <strong>of</strong> Atmospheric Science<br />
Pr<strong>of</strong>. Ronghui HUANG Honorary Pr<strong>of</strong>essor (Academician, Chinese Academy <strong>of</strong> Sciences)<br />
Pr<strong>of</strong>. Chongyin LI Honorary Pr<strong>of</strong>essor (Academician, Chinese Academy <strong>of</strong> Sciences)<br />
Dr. Nicky LAM Assistant Pr<strong>of</strong>essor<br />
Dr. Zhi NING Assistant Pr<strong>of</strong>essor<br />
Dr. Francis TAM Assistant Pr<strong>of</strong>essor<br />
Dr. Wen ZHOU Assistant Pr<strong>of</strong>essor<br />
Advisory Committee<br />
Pr<strong>of</strong>. Yihui DING Academician, Chinese Academy <strong>of</strong> Engineering<br />
Lord Pr<strong>of</strong>. Julian HUNT Pr<strong>of</strong>essor, <strong>University</strong> College London, Fellow <strong>of</strong> Royal Society<br />
Researchers<br />
Appointed by Centre<br />
Dr Andreas HARTL Research Fellow<br />
Dr Wan-Ru, Judy HUANG Research Fellow<br />
Dr Yuk Chun LEE Research Fellow<br />
Mr H<strong>of</strong>fman Ho-nam CHEUNG Research Associate<br />
Mr Kin Sik LIU Senior Research Assistant<br />
Ms Jie HE Research Assistant<br />
Mr Ka Wai, Eric NG Research Assistant<br />
Mr Kunhui YE Research Assistant
Guy Carpenter Asia-Pacific Climate Impact Centre<br />
<strong>City</strong> <strong>University</strong> <strong>of</strong> <strong>Hong</strong> <strong>Kong</strong><br />
Tat Chee Avenue, Kowloon,<br />
<strong>Hong</strong> <strong>Kong</strong>, China.<br />
Tel: (852) 3442 7359<br />
Email: gcacic@cityu.edu.hk<br />
Website: http://www.cityu.edu.hk/gcacic/<br />
Printed on FSC Certified Paper with SOY INK