Gulf and European Energy Supply Security - Feem-project.net
Gulf and European Energy Supply Security - Feem-project.net
Gulf and European Energy Supply Security - Feem-project.net

You also want an ePaper? Increase the reach of your titles
YUMPU automatically turns print PDFs into web optimized ePapers that Google loves.
<strong>Gulf</strong> Research Center Foundation
© <strong>Gulf</strong> Research Center Foundation 2010<br />
All rights reserved. No part of this publication may be reproduced, stored in a<br />
retrieval system, or transmitted in any form or by any means, electronic, mechanical,<br />
photocopying, recording or otherwise, without the prior written permission of the <strong>Gulf</strong><br />
Research Center Foundation.<br />
<strong>Gulf</strong> Research Center Foundation<br />
49, Avenue Blanc<br />
1202 Geneva, Switzerl<strong>and</strong>.<br />
Tel.: +41 227162730, Fax: +41 227162739<br />
Website: www.grcf.ch<br />
The opinions expressed in this publication are those of the author(s) alone <strong>and</strong> do not<br />
state or reflect the opinions or position of the <strong>Gulf</strong> Research Center Foundation.
Contents<br />
Introduction 5<br />
I. The <strong>European</strong> <strong>Energy</strong> Sector <strong>and</strong> the Climate-<strong>Security</strong> Nexus in the SECURE Scenarios 9<br />
II. Threats to Oil <strong>Supply</strong> <strong>Security</strong> 31<br />
III. Functioning of the International Oil Markets <strong>and</strong> <strong>Security</strong> Implications 57<br />
IV. Geopolitical Issues of Europe’s Future Gas <strong>Supply</strong> 73<br />
V. Overview of RES Characteristics <strong>and</strong> Future Scenarios 93<br />
Appendix: SECURE Project: Draft Policy Recommendations 113
Introduction<br />
the seCURe Project<br />
SECURE (<strong>Security</strong> of <strong>Energy</strong> Considering its<br />
Uncertainty, Risk <strong>and</strong> Economic Implications) is a<br />
research <strong>project</strong> funded by the <strong>European</strong> Commission<br />
under the Seventh Framework Program.<br />
The <strong>project</strong>, which started in January 2008 <strong>and</strong> will<br />
finish by December 2010, is carried out by a consortium<br />
of 15 prestigious partners from 11 countries (see list<br />
on Page 8). The Observatoire Méditerranéen de<br />
l’Energie is the <strong>project</strong> coordinator, while the scientific<br />
coordinator is Fondazione Eni Enrico Mattei.<br />
The ambition of the SECURE <strong>project</strong> has been<br />
to build a comprehensive framework that considers<br />
most of the issues related to security of supply,<br />
including geopolitics, price formation <strong>and</strong> the<br />
economic <strong>and</strong> technical design of energy markets<br />
inside <strong>and</strong> outside the EU.<br />
The <strong>project</strong> develops tools, methods, <strong>and</strong><br />
models to evaluate the vulnerability of the EU to<br />
Structure of the SECURE <strong>project</strong><br />
Value of energy security<br />
(Univ. Bath)<br />
Estimation of consumers’ risk aversion<br />
<strong>and</strong> willingness to pay for security<br />
Long term policy lines<br />
(CEPS)<br />
Qualitative analysis of energy policy<br />
options <strong>and</strong> scenarios for the EU<br />
Quantitative global models<br />
(Univ. Grenoble CNRS/LEPII)<br />
- Long term energy scenarios based on<br />
policy lines<br />
- Adaptation of the POLES model to<br />
include risk assessment<br />
-Quantitative analysis of policy<br />
recommendations<br />
Methodological developments (FEEM)<br />
Definition of concepts <strong>and</strong> general methodology of the <strong>project</strong><br />
Models <strong>and</strong> tools by energy source (FEEM)<br />
Oil (GRCF)<br />
Natural gas (Ramboll)<br />
Coal (TUD)<br />
Nuclear (LEI)<br />
Renewable energy (FHI-ISI)<br />
Electricity (RSE)<br />
- External supply<br />
- Internal supply<br />
- Geopolitical<br />
risks<br />
- Technical risks<br />
- Economic &<br />
regulatory risks<br />
Impact of accidents <strong>and</strong> terrorist threats (PSI)<br />
Dem<strong>and</strong> dimension of energy security (FEEM)<br />
Results <strong>and</strong> policy recommendations (FEEM)<br />
Stakeholders consultations <strong>and</strong> dissemination (CEPS)<br />
Scientific coordination (FEEM) Administrative management (OME)<br />
Introduction<br />
the different risks which affect energy supplies, in<br />
order to help optimize the Union’s energy insecurity<br />
mitigation strategies, including infrastructure<br />
investment, dem<strong>and</strong> side management <strong>and</strong> dialogue<br />
with producing countries.<br />
All major energy sources <strong>and</strong> technologies (oil,<br />
natural gas, coal, nuclear, renewables <strong>and</strong> electricity)<br />
are addressed from upstream to downstream<br />
by means of both global <strong>and</strong> sectoral analysis of<br />
technical, economic/regulatory <strong>and</strong> geopolitical<br />
risks. The analysis is not limited to supply issues,<br />
but also integrates dem<strong>and</strong> issues related to energy<br />
security.<br />
The diagram ‘Structure of the SECURE Project’<br />
illustrates the different modules of the SECURE<br />
<strong>project</strong>, their interactions, <strong>and</strong> the coordinating <strong>and</strong><br />
responsible organization for each module.<br />
The SECURE <strong>project</strong> has both strong quantitative<br />
<strong>and</strong> qualitative components <strong>and</strong> is designed not only<br />
to provide a comprehensive methodological<br />
<strong>and</strong> quantitative framework to measure<br />
energy security of supply, but also to propose<br />
relevant policy recommendations on how to<br />
improve energy security taking into account<br />
4<br />
costs, benefits <strong>and</strong> risks of various policy<br />
choices<br />
Consultation among stakeholders is an<br />
important element of the SECURE <strong>project</strong>.<br />
Several workshops have been organized both<br />
in Europe <strong>and</strong> in the main energy supplying<br />
regions for Europe (Russia, North Africa <strong>and</strong><br />
the <strong>Gulf</strong>) in order to discuss <strong>and</strong> test draft<br />
<strong>project</strong> results.<br />
The SECURE <strong>project</strong> will thus provide<br />
the <strong>European</strong> Commission, as well as EU<br />
governments <strong>and</strong> regulators, with a tool to
<strong>Energy</strong> <strong>Security</strong>: Potential for EU-GCC Cooperation<br />
support their decision-making process towards<br />
the definition of energy policies <strong>and</strong> strategies.<br />
In particular, the results of the <strong>project</strong> will<br />
be useful to achieve the appropriate energy<br />
mix regarding energy security of supply <strong>and</strong><br />
sustainability requirements; to improve the<br />
internal energy market regulatory framework; to<br />
develop stable relations with energy exporting<br />
countries <strong>and</strong> external partners; <strong>and</strong> to optimize<br />
the synergies between member states to improve<br />
security of supply.<br />
<strong>Energy</strong> <strong>Security</strong> – Potential for EU-GCC<br />
Cooperation<br />
The present book has been prepared as an adhoc<br />
background document for the “Conference<br />
on <strong>Energy</strong> <strong>Security</strong> – Potential for EU-GCC<br />
Cooperation” organized in cooperation with the<br />
Bahrain Center for Strategic, International <strong>and</strong><br />
<strong>Energy</strong> Studies. It is a collection <strong>and</strong> summary<br />
of those SECURE <strong>project</strong> results which have a<br />
specific relevance for EU-GCC cooperation.<br />
The first paper contains the highlights of the<br />
energy scenarios developed in the context of<br />
the <strong>project</strong>. Work for this paper was conducted<br />
primarily by LEPII-CNRS. This paper describes<br />
the set of world energy scenarios that have been<br />
developed under the SECURE research <strong>project</strong><br />
in order to study the “Climate Policy <strong>and</strong> <strong>Energy</strong><br />
<strong>Security</strong> Nexus” in a <strong>European</strong> perspective. It<br />
is based on the statement that it is impossible<br />
to examine the energy security issue without<br />
developing a full set of consistent hypotheses on<br />
the intensity of emission reduction policies in the<br />
different world regions. This is underst<strong>and</strong>able as<br />
these policies, if they are sufficiently ambitious<br />
to have an impact on GHG emissions <strong>and</strong> on<br />
the climate, will also have a noticeable impact<br />
on the international energy markets. The paper<br />
examines the impacts of three main scenarios<br />
–- Muddling Through (low intensity climate<br />
policies), Europe Alone, <strong>and</strong> Global Regime -– on<br />
the world <strong>and</strong> <strong>European</strong> energy systems. The<br />
study confirms that the world energy future will<br />
be fully different in the two extreme cases <strong>and</strong><br />
that the Global Regime helps to alleviate both the<br />
climate problem <strong>and</strong> the long-term sustainability<br />
problem of hydrocarbon production. The Europe<br />
Alone case does not solve the latter problem, but it<br />
makes Europe less vulnerable to the risks associated<br />
with future energy shocks.<br />
The second <strong>and</strong> third papers, which are primarily<br />
the responsibility of GRCF, are devoted to the<br />
security of oil supplies – an item of intense common<br />
interest for EU-GCC cooperation. The second paper<br />
focuses in particular on threats to oil supply security.<br />
It follows an analytical approach, distinguishing<br />
different types of threats rather than bundling all<br />
together in an undifferentiated scare scenario. The<br />
primary distinction is between geopolitical <strong>and</strong><br />
military threats: the former are linked to political<br />
developments <strong>and</strong> the adoption or reform of policies<br />
affecting oil production <strong>and</strong> exports (resource<br />
nationalism, political instability). The latter are<br />
linked to the use of military force or violence on<br />
the part of either state or non-state actors. A third<br />
section of the paper deals with potential threats to<br />
oil transportation on the high seas.<br />
The paper argues that there is no easy<br />
<strong>and</strong> immediate connection between resource<br />
nationalism <strong>and</strong>/or political instability, <strong>and</strong> global<br />
supply of oil <strong>and</strong> gas. This is not because political<br />
developments are irrelevant for influencing oil <strong>and</strong><br />
gas supplies, but because this influence is highly<br />
variable <strong>and</strong> unpredictable. Political instability <strong>and</strong><br />
resource nationalism are shown to have rarely been<br />
associated with acute supply crises or shortfalls. Their<br />
effect is rather gradual <strong>and</strong> normally compensated<br />
by action in other parts of the system.<br />
Concerning threats subsequent to the use of<br />
military force, the paper argues that oil <strong>and</strong> gas<br />
installations appear to be much more resilient to<br />
armed conflict than is normally acknowledged.<br />
Interstate wars are a low-probability event; they<br />
are generally confined to two main belligerents <strong>and</strong><br />
contained. In contrast, civil wars or violent action<br />
on the part of non-state actors are phenomena<br />
whose frequency has not diminished at the global<br />
level. Cases in which violent action on the part of<br />
non-state actors has inflicted significant damage to<br />
existing installations include the “insurgency” phase
in Iraq <strong>and</strong> the activities of MEND in Nigeria. If oil<br />
installations are in remote or inhabited locations,<br />
the cost-benefit balance of attacking oil installations<br />
is not very attractive for the non-state actor.<br />
However, it is very obvious that a government’s<br />
inability to overcome or reabsorb violent opposition<br />
discourages international oil company investment<br />
even if the violence does not affect the vicinity of oil<br />
<strong>and</strong> gas installations.<br />
Concerning threats to oil shipping, the paper<br />
argues that maritime logistics are unlikely to<br />
generate major crises, but require constant<br />
attention. Patrolling <strong>and</strong> surveillance of maritime<br />
traffic is essential, as is investment to reduce<br />
pressure on key choke points, such as the Strait of<br />
Hormuz. Investment to reduce traffic in enclosed<br />
seas is highly advisable.<br />
The third paper deals with the functioning of<br />
global oil markets <strong>and</strong> its impact on energy security.<br />
It is argued that <strong>Energy</strong> security is primarily a<br />
function of investment. Investment in a market<br />
economy is a function of the expected revenue<br />
stream, which in turn is a function of prices. A wellfunctioning<br />
market is therefore a key component of<br />
security. In this approach, the main obstacle to oil<br />
<strong>and</strong> gas security of supply is the growing volatility of<br />
prices <strong>and</strong> their fundamental unpredictability.<br />
<strong>Security</strong> itself is also dependent on prices,<br />
because customers feel secure if they can buy all the<br />
energy they need at prices that they can afford.<br />
The paper offers a number of policy indications<br />
to contain volatility within limits that will not prevent<br />
the formation of a prevailing view of the likely<br />
evolution of prices in the medium <strong>and</strong> long term,<br />
which is the prerequisite for sufficient investment.<br />
The fourth paper (whose primary responsibility<br />
has been with Ramboll with support from OME<br />
<strong>and</strong> GRCF) deals with security of gas supplies. Until<br />
recently, the <strong>Gulf</strong> has not been a main source of gas<br />
imports into Europe, but this situation is changing<br />
fast. Because the main dimension of <strong>European</strong><br />
insecurity with respect to gas imports is the excessive<br />
dependence on a small number of historical suppliers,<br />
the emergence of an important new potential source<br />
of supplies, such as the <strong>Gulf</strong> <strong>and</strong> in particular Qatar,<br />
represents a boost to <strong>European</strong> security in itself.<br />
Introduction<br />
In addition, exports from the <strong>Gulf</strong> are in the form<br />
of LNG, which adds considerable flexibility to the<br />
management of the <strong>European</strong> gas grid, which has<br />
been plagued by insufficient interconnections. As<br />
LNG cargoes are easily redirected in case of some<br />
disturbance, all that is necessary is to make provision<br />
for sufficient regasification capacity distributed<br />
along the coasts of the <strong>European</strong> Union to acquire<br />
the possibility of serving all vulnerable customers in<br />
the event of an emergency.<br />
The last paper, whose responsibility lies with<br />
the Fraunhofer Institute <strong>and</strong> the Vienna University<br />
of Technology (<strong>Energy</strong> Economics Group), is about<br />
the potential for renewable sources of energy. The<br />
paper is based on the <strong>European</strong> experience so far<br />
<strong>and</strong> details the potential for greater reliance on<br />
renewable sources but also the cost <strong>and</strong> problems<br />
connected with it. As the GCC countries have<br />
manifested rapidly growing interest for developing<br />
renewable energy sources, notably solar <strong>and</strong> wind,<br />
we believe that this is an area in which fruitful<br />
dialogue <strong>and</strong> cooperation is possible.<br />
The appendix contains a list of proposed<br />
policy measures that the SECURE <strong>project</strong> offers<br />
to <strong>European</strong> politicians <strong>and</strong> decision makers for<br />
consideration with the objective of enhancing<br />
<strong>European</strong> energy security.<br />
The issues of energy security <strong>and</strong> climate change<br />
are unfortunately frequently framed in an adversarial<br />
fashion – as if the objective is solely or primarily to<br />
reduce dependence on “their” oil. We believe that<br />
this approach is profoundly wrong. It is clear in our<br />
minds that the world will continue to need growing<br />
volumes of oil <strong>and</strong> gas for the foreseeable decades,<br />
in conjunction with the rapidly increasing dem<strong>and</strong> in<br />
the major emerging countries. Greater reliance on<br />
coal is problematic because of the impact on global<br />
warming, <strong>and</strong> carbon capture <strong>and</strong> sequestration for<br />
coal fired power plants is not making the progress<br />
that had been hoped for.<br />
As the CEO of Saudi Aramco, Khalid Al-Faleh,<br />
has said:<br />
“We will have to meet the world’s increased<br />
energy needs, <strong>and</strong> must do so in the most responsible<br />
manner. So how do we best address the challenge<br />
of ready access to affordable energy?
<strong>Energy</strong> <strong>Security</strong>: Potential for EU-GCC Cooperation<br />
The short answer is that the world will continue<br />
to rely on traditional fossil fuels for most of its<br />
energy needs for the coming decades. In fact, these<br />
energy sources – namely coal, oil <strong>and</strong> natural gas<br />
– are expected to account for about four out of every<br />
five units of energy that mankind will consume for<br />
the foreseeable future. In addition, even though the<br />
share of fossil fuels in the energy mix may decline<br />
over the longer term, the absolute quantities of<br />
energy from these sources will continue to rise simply<br />
because total energy dem<strong>and</strong> is set to exp<strong>and</strong> so<br />
significantly. At the same time, alternative sources<br />
of energy should grow – <strong>and</strong> indeed must grow<br />
– in order to play their part in meeting that rising<br />
dem<strong>and</strong>.”<br />
EU-GCC cooperation may play a very important<br />
role in fostering a climate of broader global<br />
cooperation that will provide the world with sufficient<br />
energy to achieve its development goals while at the<br />
same time preserving the health of our pla<strong>net</strong>.<br />
SECURE Project Partners: 15 Leading <strong>European</strong> Research Institutions<br />
Coordinator<br />
Scientific<br />
Coordinator<br />
Partner<br />
Observatoire Méditerranéen de l’Energie<br />
Fondazione Eni Enrico Mattei<br />
Ramboll Oil & Gas<br />
Lietuvos Energetikos Institutas<br />
Fraunhofer-Gesellschaft zur Förderung<br />
der angew<strong>and</strong>ten Forschung e.V.<br />
Joint Research Centre<br />
Technische Universität Dresden<br />
Paul Scherrer Institut<br />
Ricerca sul Sistema Energetico<br />
<strong>Energy</strong> Research Institute<br />
Russian Academy of Sciences<br />
The University of Bath<br />
<strong>Gulf</strong> Research Center Foundation<br />
Centre for <strong>European</strong> Policy Studies<br />
Vienna University of Technology, <strong>Energy</strong><br />
Economics Group<br />
Centre National de la Recherche<br />
Scientifique – LEPII<br />
OME<br />
FEEM<br />
RAMBOLL<br />
LEI<br />
FHI-ISI<br />
JRC<br />
TUD<br />
PSI<br />
RSE<br />
ERI RAS<br />
Bath<br />
GRCF<br />
CEPS<br />
TU-WIEN<br />
CNRS<br />
Country<br />
France<br />
Italy<br />
Denmark<br />
Lithuania<br />
Germany<br />
Belgium<br />
Germany<br />
Switzerl<strong>and</strong><br />
Italy<br />
Russian<br />
Federation<br />
U.K.<br />
Switzerl<strong>and</strong><br />
Belgium<br />
Austria<br />
France
SESSION I - Scenarios of <strong>Energy</strong> Futures<br />
the european energy sector <strong>and</strong> the Climatesecurity<br />
nexus in the seCURe scenarios*<br />
Introduction<br />
It is usually considered that the development of<br />
national or regional energy policies should be based<br />
on three pillars: energy security, environmental<br />
sustainability <strong>and</strong> economic competitiveness. This<br />
is particularly true for Europe, where each one of<br />
these pillars is brought forward by one dedicated<br />
institution, respectively the Directorates General<br />
for <strong>Energy</strong> <strong>and</strong> Transport, for Environment <strong>and</strong> for<br />
Competition. But this is also true for other countries<br />
or regions of the world, as the development of<br />
sound energy policies is often considered as based<br />
on trade-offs, aiming at the right balance between<br />
potentially conflicting goals. The key argument of<br />
this paper is to demonstrate that these targets may<br />
be put into convergence, according to the policy<br />
hypotheses retained at the global <strong>and</strong> regional level.<br />
In particular, the adoption <strong>and</strong> implementation<br />
of strong climate change <strong>and</strong> emission reduction<br />
policies may be considered as the most effective way<br />
to enhance energy security through a lower degree<br />
of dependence of the <strong>European</strong> energy system on<br />
fossil fuels.<br />
In order to explore this “energy security <strong>and</strong><br />
climate policy nexus,” we use the POLES world<br />
energy model. In line with former energy foresight<br />
exercises performed at <strong>European</strong> <strong>and</strong> world level<br />
with this model, we describe a family of scenarios<br />
based on consistent sets of exogenous hypotheses<br />
on economic growth, energy resources, technology<br />
performances <strong>and</strong> climate policies. The POLES<br />
model is not a General Equilibrium Model, but a<br />
Partial Equilibrium Model aimed at describing the<br />
energy sector within a year by year dynamic recursive<br />
simulation framework. In this paper, we describe<br />
* This paper was written by Patrick Criqui <strong>and</strong> Silvana Mima of LEPII<br />
the results of four scenarios in order to illustrate<br />
the consequences of different settings concerning<br />
climate policies on the fundamentals of the energy<br />
markets, both at global <strong>and</strong> regional level.<br />
These scenarios are currently developed <strong>and</strong><br />
used in the <strong>European</strong> SECURE <strong>project</strong>, on top of<br />
the model’s Business as Usual <strong>project</strong>ion. The first<br />
one is called Muddling Through <strong>and</strong> illustrates the<br />
consequences of relatively low intensity <strong>and</strong> noncoordinated<br />
climate policies in the different world<br />
regions. This scenario can be used as a reference case,<br />
to which stronger policy cases can be compared.<br />
The second <strong>and</strong> third cases respectively identified<br />
as Muddling Through with Europe Plus, <strong>and</strong> Europe<br />
goes Alone, describe situations in which Europe<br />
implements gradually stronger climate policies than<br />
in the mere Muddling Through case, while the rest<br />
of the world sticks to low intensity climate policies.<br />
Finally, the Global Regime scenario illustrates the<br />
consequences of coordinated <strong>and</strong> ambitious climate<br />
policy, shared at world level.<br />
The exercise shows that energy policies in<br />
the Muddling Through case result in a noticeable<br />
limitation of emissions compared to Business<br />
As Usual case. However, the global emission<br />
level reached in 2050 far exceeds the one that<br />
is considered as reasonable in IPCC’s AR4. The<br />
Europe Alone scenario helps to show that in a<br />
world with low policy coordination there might<br />
still be strong advantages in pursuing an ambitious<br />
regional climate policy as it may considerably limit<br />
the vulnerability of Europe to events occurring in an<br />
otherwise very unstable energy world. The Global<br />
Regime case not only helps to constrain climate<br />
change in an acceptable range but also changes
<strong>Energy</strong> <strong>Security</strong>: Potential for EU-GCC Cooperation<br />
the whole picture of the world energy system in<br />
the first half of the century. In particular, the long<br />
term sustainability of the oil <strong>and</strong> gas production<br />
profile is significantly improved. Two variants are<br />
developed for this case: Global Regime with two<br />
carbon markets (GR-2M) <strong>and</strong> Global Regime with<br />
full trade for carbon (GR-FT) in order to test the<br />
consequences of a differentiated or a unified carbon<br />
emissions market.<br />
Section 1 of this paper briefly presents the<br />
POLES model <strong>and</strong> the Muddling Through scenario,<br />
which, although it contains some elements of<br />
emission reduction, represents a state of the<br />
world that is maybe probable, but surely not<br />
desirable from the climate change perspective.<br />
Section 2 is dedicated to the presentation of the<br />
climate policy alternative scenarios <strong>and</strong> to the<br />
comparative analysis of their results in terms of<br />
emission performances <strong>and</strong> impacts on the world<br />
<strong>and</strong> <strong>European</strong> energy system to 2050. Section 3<br />
discusses the consequences for the international<br />
energy markets <strong>and</strong> for the energy import<br />
profiles of Europe. The last section translates<br />
the conclusions of this study in terms of risks <strong>and</strong><br />
vulnerability; it also points to the double dividend<br />
that may be associated with a change in the<br />
<strong>European</strong> energy paradigm.<br />
1. the PoLes Model <strong>and</strong> the Muddling<br />
through Projection<br />
The Muddling Through <strong>project</strong>ion provides an<br />
image of the energy scene upto 2050, resulting from<br />
the continuation of ongoing trends <strong>and</strong> structural<br />
changes in the world economy, with only low<br />
intensity <strong>and</strong> non-coordinated climate policies in<br />
the different world regions.<br />
Through the identification of the drivers <strong>and</strong><br />
constraints in the energy system, the model used in<br />
this exercise allows the description of the pathways<br />
for energy development, fuel supply, greenhouse<br />
gas emissions, international <strong>and</strong> end-user prices,<br />
on a year by year basis from today to 2050. The<br />
approach combines a high degree of detail in<br />
the key components of the energy systems <strong>and</strong><br />
a strong economic consistency, as all changes in<br />
these key components are largely determined by<br />
10<br />
relative price changes at sectoral level. The model<br />
identifies 47 regions for the world, with 22 energy<br />
dem<strong>and</strong> sectors <strong>and</strong> about 40 energy technologies<br />
– now including generic “high energy efficiency”<br />
end-use technologies. Therefore, each scenario can<br />
be described as the set of economically consistent<br />
transformations of the initial Business As Usual<br />
<strong>project</strong>ion that is induced by the introduction of<br />
policy constraints.<br />
1.1. The POLES Model<br />
The POLES model is a partial equilibrium<br />
model of the world’s energy system that provides<br />
a detailed year-by-year <strong>project</strong>ion until 2050 (or in<br />
some studies 2100), for the different regions of the<br />
world. The model simulates the energy dem<strong>and</strong> for<br />
each economic sector, the supply <strong>and</strong> prices for the<br />
primary energy sources on the international markets,<br />
<strong>and</strong> the impacts of innovation, experience effects<br />
<strong>and</strong> R&D in new <strong>and</strong> renewable energy technologies<br />
<strong>and</strong> major energy conversion systems (electricity or<br />
hydrogen-based for the longer term).<br />
The model therefore provides a consistent<br />
framework for studying the interconnected dynamics<br />
of energy development <strong>and</strong> environmental impacts.<br />
Projections are made on the basis of exogenous<br />
economic growth <strong>and</strong> demographic <strong>project</strong>ions<br />
for each region. It takes into account the resource<br />
constraints for both oil <strong>and</strong> natural gas <strong>and</strong> enables<br />
the calculation of greenhouse gas emissions from<br />
the burning of fossil fuels <strong>and</strong>, further on, of the<br />
costs (marginal <strong>and</strong> total) of reducing emissions in<br />
the various countries or regions.<br />
It thus makes possible the simulation of various<br />
emission constraint scenarios <strong>and</strong> the identification<br />
of the consequences of introducing a carbon tax or<br />
emission quotas systems. The main limitation of<br />
this modelling system is probably that it does not<br />
account for macro-economic feedbacks. However,<br />
this also allows the production of a relatively robust<br />
estimate of the impacts of climate policies on the<br />
sole energy sector, while the macro impacts are<br />
most often taken into account in joint studies with<br />
other energy economy models such as GEM-E3<br />
(NTUA, Athens) or IMACLIM (CIRED, Paris).
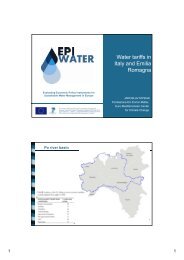
Figure 1: The POLES Model Simulation Process<br />
Prices<br />
(t+1)<br />
E m i s s i o n C o n s t r a i n t<br />
Source: POLES model-LEPII<br />
1.2. The Muddling Through Projection <strong>and</strong> the<br />
Comeback of Coal<br />
The Muddling Through <strong>project</strong>ion adopts<br />
exogenous forecasts for population <strong>and</strong> economic<br />
growth in the different world regions. In order to<br />
take into account the current financial <strong>and</strong> economic<br />
crisis, the latest SECURE Muddling Through case<br />
shows a global GDP growth rate in 2009 that is<br />
50 percent lower than in the preceding POLES<br />
<strong>project</strong>ions, with a catch-up to formerly considered<br />
The <strong>European</strong> <strong>Energy</strong> Sector <strong>and</strong> the Climate-<strong>Security</strong> Nexus in the SECURE Scenarios<br />
Resources<br />
International <strong>Energy</strong> Markets<br />
Coal Oil Gas<br />
Regional<br />
<strong>Energy</strong><br />
Balances<br />
Imports /<br />
Exports (t)<br />
POP GDP<br />
T e c h n o l o g i e s<br />
growth rates in 2013. This corresponds<br />
to a world GDP that is in 2015 more<br />
than 5 percent lower than considered in<br />
previous POLES energy outlooks. This<br />
might, however, still be considered as<br />
an optimistic view on the capability of<br />
recovery of the world economy in the<br />
short-medium term. Other hypotheses<br />
on world economic growth might be<br />
explored through alternative runs of the<br />
model.<br />
The <strong>project</strong>ion is based on consistent<br />
assumptions on the availability of fossil<br />
energy resources <strong>and</strong> on the costs <strong>and</strong><br />
performances of future technologies.<br />
In this kind of scenario, a st<strong>and</strong>ard<br />
discount rate of 8 percent is used to<br />
simulate investment decisions in the<br />
energy sector. Figure 2 describes the dynamics of<br />
the world <strong>and</strong> <strong>European</strong> energy system, in the initial<br />
settings considered in the Muddling Through.<br />
The key outcome of the Muddling Through case<br />
is almost a doubling of world energy consumption<br />
from 2000 to 2050, with a levelling-off of world oil<br />
<strong>and</strong> gas production after 2030. In spite of a significant<br />
development in nuclear energy, biomass <strong>and</strong> other<br />
renewables, which in 2050 represent more than one<br />
fourth of world Gross Inl<strong>and</strong> <strong>Energy</strong> Consumption<br />
Emissions<br />
Cons, Prod<br />
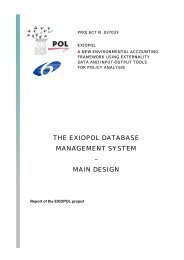
Figure 2: Muddling Through Case – World (left) <strong>and</strong> Europe (right) Gross Inl<strong>and</strong> <strong>Energy</strong> Consumption<br />
e<br />
o<br />
t<br />
G<br />
20<br />
18<br />
16<br />
14<br />
12<br />
10<br />
8<br />
6<br />
4<br />
2<br />
0<br />
Other Renewables<br />
Biomass<br />
Nuclear<br />
Coal, lignite<br />
Natural gas<br />
Oil<br />
World Primary consumption - MT<br />
2000 2010 2020 2030 2040 2050<br />
Source: POLES model, LEPII, SECURE <strong>project</strong><br />
e<br />
o<br />
t<br />
M<br />
3 000<br />
2 500<br />
2 000<br />
1 500<br />
1 000<br />
500<br />
0<br />
EU27 Primary consumption - MT<br />
Other Renewables<br />
Biomass<br />
Nuclear<br />
Coal, lignite<br />
Natural gas<br />
Oil<br />
2000 2010 2020 2030 2040 2050<br />
11
<strong>Energy</strong> <strong>Security</strong>: Potential for EU-GCC Cooperation<br />
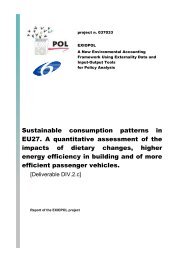
Figure 3: Muddling Through, Flows of World Oil Production (left), Stocks<br />
of Resources <strong>and</strong> Reserves (right)<br />
d<br />
b<br />
M<br />
(GIEC), the primary source that most gains in<br />
importance is coal, which passes from 2.2 Gtoe to<br />
4 Gtoe between 2000 <strong>and</strong> 2050. One can note that<br />
this is already much less than in the Business As<br />
Usual runs also performed in the SECURE <strong>project</strong><br />
but not analyzed here. As for Europe, the dynamics<br />
in GIEC is much less pronounced with an increase<br />
from 1.7 Gtoe to only 1.9 Gtoe between 2000 <strong>and</strong><br />
2050. There again one notes a levelling-off of oil<br />
<strong>and</strong> gas consumption, the progress of renewables<br />
<strong>and</strong> the pe<strong>net</strong>ration of coal, although with a more<br />
modest magnitude than at world level.<br />
12<br />
100<br />
90<br />
80<br />
70<br />
60<br />
50<br />
40<br />
30<br />
20<br />
10<br />
0<br />
Oil Production - MT<br />
2000 2010 2020 2030 2040 2050<br />
Source: POLES model, LEPII, SECURE <strong>project</strong><br />
Gb<br />
3500<br />
3000<br />
2500<br />
2000<br />
1500<br />
1000<br />
500<br />
0<br />
1940<br />
1940<br />
1949<br />
1949<br />
1950<br />
1950<br />
1959<br />
1959<br />
1960<br />
1960<br />
1969<br />
1969<br />
Total<br />
<strong>Gulf</strong><br />
Conventionnal<br />
Figure 4: Estimates of Conventional Oil Ultimate Recoverable Resources<br />
l<br />
b<br />
G<br />
4 500<br />
4 000<br />
3 500<br />
3 000<br />
2 500<br />
2 000<br />
1 500<br />
1 000<br />
500<br />
0<br />
Conventional Oil Reserves - World<br />
Oil Reserves<br />
Cumulative Production<br />
2000 2010 2020 2030 2040 2050<br />
1.3. The Probable Unsustainability of<br />
the Muddling Through: Upstream <strong>and</strong><br />
Downstream Constraints<br />
In many respects, however, this scenario is<br />
hardly sustainable in the long term. First of all, the<br />
level of oil production is high, peaking at slightly less<br />
than 100 Mbd in 2030 for conventional oil (Figure 3).<br />
This is a high level, which implies very high levels of<br />
total cumulative conventional oil production, from<br />
900 Gbl in 2000 to 2,500 Gbl in 2050 (Figure 3).<br />
This is indeed a level that corresponds to the<br />
middle of the range of total Ultimate Recoverable<br />
UR<br />
Cumulative Discoveries<br />
* Cumulative production + proven reserves +<br />
possible reserves yet to be discovered<br />
1970<br />
1970<br />
1979<br />
1979<br />
1980<br />
1980<br />
1989<br />
1989<br />
1990<br />
1990<br />
2000<br />
2000<br />
P r a t<br />
t ( 1 9 4 2 )<br />
D u c e ( 1 9 4 6 )<br />
P o u g e ( 1 9 4 6 )<br />
W e<br />
e k s ( 1 9 4 8 )<br />
L e v e r s o n ( 1 9 4 9 )<br />
W e<br />
e k s ( 1 9 4 9 )<br />
M a c N a u g h t o n ( 1 9 5 3 )<br />
H u b<br />
b e r t ( 1 9 5 6 )<br />
W e<br />
e k s ( 1 9 5 8 )<br />
W e<br />
e k s ( 1 9 5 9 )<br />
H e n d r i c k s ( 1 9 6 5 )<br />
R y a m n ( 1 9 6 7 )<br />
S h e l<br />
l ( 1 9 6 8 )<br />
W e<br />
e k s ( 1 9 6 8 )<br />
H u b<br />
b e r t ( 1 9 6 9 )<br />
M o<br />
o d y ( 1 9 7 0 )<br />
W e<br />
e k s ( 1 9 7 1 )<br />
W a r m a n ( 1 9 7 2 )<br />
B a u q u i s ( 1 9 7 2 )<br />
S c h w e i n f u r t h ( 1 9 7 3 )<br />
L i n d e n ( 1 9 7 3 )<br />
B o n i l<br />
l a s ( 1 9 7 4 )<br />
H o w i t<br />
t ( 1 9 7 4 )<br />
M o<br />
o d y ( 1 9 7 5 )<br />
W E C ( 1 9 7<br />
7 )<br />
N e l s o n ( 1 9 7<br />
7 )<br />
D e B r u y n e ( 1 9 7 8 )<br />
K l e m<br />
m e ( 1 9 7 8 )<br />
N e h r i n g ( 1 9 7 8 )<br />
N e h r i n g ( 1 9 7 9 )<br />
H a l b o u t y ( 1 9 7 9 )<br />
M e y e r h o f<br />
f ( 1 9 7 9 )<br />
R o<br />
o r d a ( 1 9 7 9 )<br />
H a l b o u t y ( 1 9 7 9 )<br />
W E C ( 1 9 8 0 )<br />
S t r i c k l a n d ( 1 9 8 1 )<br />
C o l i t i ( 1 9 8 1 )<br />
N e h r i n g ( 1 9 8 2 )<br />
M a s t e r s ( 1 9 8 3 )<br />
K a l i n i n ( 1 9 8 3 )<br />
M a r t i n ( 1 9 8 4 )<br />
I v a n h o e ( 1 9 8 4 )<br />
M a s t e r s ( 1 9 8 7 )<br />
C a m p b e l<br />
l ( 1 9<br />
9 1 )<br />
M a s t e r s ( 1 9<br />
9 1 )<br />
T o w n e s ( 1 9<br />
9 3 )<br />
P e t r o c o n s u l t . ( 1 9<br />
9 3 )<br />
M a s t e r s ( 1 9<br />
9 4 )<br />
U S G S ( 2 0<br />
0<br />
0 )<br />
Source: P.R. Bauquis, 2006
2<br />
O<br />
C<br />
t<br />
/<br />
5<br />
€ 0<br />
400<br />
350<br />
300<br />
250<br />
200<br />
150<br />
100<br />
50<br />
0<br />
EU27<br />
Rest of the world<br />
Carbon Value - MT<br />
2000 2010 2020 2030 2040 2050<br />
Resources estimates for conventional liquids as<br />
identified by the Institut Français du Pétrole (Figure<br />
4). Furthermore, it supposes about 3,500 Gbl of<br />
total cumulative discoveries in order to maintain a<br />
minimum level of reserves.<br />
The consistency of the long run oil <strong>project</strong>ions<br />
of the POLES model with the taking into<br />
account of resource limits is made possible by<br />
The <strong>European</strong> <strong>Energy</strong> Sector <strong>and</strong> the Climate-<strong>Security</strong> Nexus in the SECURE Scenarios<br />
Figure 5 : Carbon Value <strong>and</strong> International <strong>Energy</strong> Price Trajectories (MT)<br />
Source: POLES model, LEPII, SECURE <strong>project</strong><br />
2<br />
O<br />
C<br />
t<br />
G<br />
45<br />
40<br />
35<br />
30<br />
25<br />
20<br />
15<br />
10<br />
5<br />
0<br />
Transformaon<br />
Transport<br />
Res-Ser-Agr<br />
Industry<br />
World CO2 emissions by sector (energy) -MT<br />
2000 2010 2020 2030 2040 2050<br />
e<br />
o<br />
b<br />
/<br />
5<br />
0<br />
0<br />
2<br />
€<br />
120<br />
100<br />
80<br />
60<br />
40<br />
20<br />
0<br />
International Prices - MT<br />
Oil Gas (Asia)<br />
Gas (Europe) Gas (America)<br />
Coal (Asia) Coal (Europe)<br />
Coal (America)<br />
Figure 6: World CO2 Emissions from <strong>Energy</strong>, by Sector <strong>and</strong> by Region<br />
Source: POLES model, LEPII, SECURE <strong>project</strong><br />
G tCO2<br />
eq<br />
2000 2010 2020 2030 2040 2050<br />
45<br />
40<br />
35<br />
30<br />
25<br />
20<br />
15<br />
10<br />
5<br />
0<br />
the expected increase of recoverable resources<br />
through significantly enhanced recovery rates in<br />
the different production regions. Nevertheless,<br />
the implied hypotheses for oil production in the<br />
<strong>Gulf</strong> region seems to be extremely optimistic as it<br />
supposes more than a doubling in 2030 <strong>and</strong> beyond.<br />
This increase in <strong>Gulf</strong> oil production to more than<br />
40 Mbd from 2030 to 2050 is probably questionable,<br />
Total GHG Emissions by region - MT<br />
2000 2010 2020 2030 2040 2050<br />
RLAM<br />
RASIAJ<br />
AFR<br />
MIEA<br />
BRA<br />
NDE<br />
CHN<br />
CIS<br />
JANZC<br />
WEUR<br />
CAN<br />
USA<br />
1
<strong>Energy</strong> <strong>Security</strong>: Potential for EU-GCC Cooperation<br />
Table 1: IPCC-AR4 Stabilization Scenarios<br />
Source: IPCC, AR4, SPM<br />
not only from the resource <strong>and</strong> production capacity<br />
perspective, but also for reasons related to the<br />
geopolitical <strong>and</strong> internal political dimensions of<br />
the oil industry development in this region. This is<br />
why the smooth path for oil price increases that is<br />
associated with this scenario can be considered as a<br />
relatively optimistic hypothesis, although it ends at<br />
more than 100 €/bl in 2050, structurally (Figure 5).<br />
The second reason for which the Muddling<br />
Through is probably not sustainable results from<br />
the implied CO2 emission level for the energy sector<br />
(Figure 6).<br />
Emissions indeed double over the period<br />
considered, which would place this scenario in the<br />
very high range of the IPCC scenarios: a type VI<br />
scenario in the Table SPM.5 of AR4 (see Table 1), i.e.<br />
a mean temperature increase at equilibrium between<br />
5 <strong>and</strong> 6°C.<br />
2. Alternative Climate Policy scenarios<br />
<strong>and</strong> their Impacts on the International<br />
energy Markets<br />
Three scenarios are used in the SECURE study in<br />
order to characterize contrasted states of the world<br />
from the perspective of the “energy security <strong>and</strong><br />
climate policy” nexus. They allow in particular the<br />
illustration of the consequences of differentiated<br />
energy policies on the fundamentals of the world<br />
energy system.<br />
14<br />
2.1. Alternative Scenario Definition<br />
The Muddling Through with Europe Plus (MT<br />
E+) scenario supposes a failure in the efforts to<br />
develop a common framework of targets, rules<br />
<strong>and</strong> mechanisms for climate policies. Only weak<br />
domestic climate policies are implemented without<br />
any strong element of coordination of the different<br />
actions. But the case supposes that Europe goes<br />
beyond the mere Muddling Through policy, with<br />
a carbon value that is significantly rising from<br />
8 €/tCO2 in 2010 to 89 €/tCO2 in 2050, instead<br />
of only 40 €/tCO2 in MT. The resulting picture<br />
is one of lower emissions in Europe than in the<br />
Muddling Through, but world emissions in 2050<br />
are still above 51percent compared to 2000, which<br />
still corresponds to a Type IV scenario in the AR4<br />
typology (see Table 2).<br />
The third scenario, Europe Alone, supposes that<br />
Europe goes alone with a really stringent climate<br />
policy line, while the rest of the world continues on<br />
the same line as in Muddling Through. In that case it<br />
is supposed that the carbon value in the rest of the<br />
world is unchanged, while it is set in Europe at 178<br />
€/tCO2 in 2050 (see Table 2).<br />
Finally, the Global Regime scenarios<br />
correspond to the stabilization profile of GHG<br />
concentrations, below 450 ppmv for CO2 <strong>and</strong> 500<br />
ppmv for all GHG gases. This is simulated through<br />
a world emission profile that ends up in 2050 at 50
percent of 2000 CO2 emissions. This is the Factor<br />
2 reduction in 2050 emissions at world level, which<br />
is often advocated in international negotiations<br />
by the proponents of strong climate policies. In<br />
compliance with this global profile, two variants<br />
The <strong>European</strong> <strong>Energy</strong> Sector <strong>and</strong> the Climate-<strong>Security</strong> Nexus in the SECURE Scenarios<br />
Table 2: Scenarios for Exploring the <strong>Energy</strong> <strong>Security</strong> – Climate Policy Nexus<br />
Scenario<br />
Carbon Value (€/tCO2)<br />
EU27 CO2 emissions :<br />
2020 / 1990<br />
2050 / 1990<br />
Annex 1 CO2 emissions:<br />
2020 / 1990<br />
2050 / 1990<br />
World CO2 emissions :<br />
2020 / 1990<br />
2050 / 1990<br />
AR4 Scenario Profile<br />
Source: SECURE <strong>project</strong><br />
MT EA GR-2M GR-FT<br />
Muddling<br />
Through<br />
EU : 8 in 2010<br />
40 in 2050<br />
RoW : 10 years<br />
lag / EU<br />
-4%<br />
-21%<br />
+ 67%<br />
+ 72%<br />
Type IV<br />
> 600 CO2e<br />
Europe Alone<br />
EU : 8 in 2010<br />
178 in 2050<br />
RoW : as in<br />
Muddling<br />
Through<br />
-20%<br />
-60%<br />
+63%<br />
+ 59%<br />
Type IV<br />
> 600 CO2e<br />
Global Regime<br />
with 2 Markets :<br />
Annex 1 +<br />
Non Annex 1<br />
Ann 1 : 16 in 2010<br />
392 in 2050<br />
Non Ann 1 :<br />
1 in 2010<br />
257 in 2050<br />
-25% /year 2000<br />
-80% /year 2000<br />
127% /year 2000<br />
- 50% /year 2000<br />
Type II<br />
> 500 CO2e<br />
Global Regime<br />
with Full Trade<br />
World :7 in 2010<br />
380 in 2050<br />
127% /year 2000<br />
- 50% /year 2000<br />
Type II<br />
> 500 CO2e<br />
have been considered.<br />
In the Global Regime<br />
Two Markets (GR-2M)<br />
variant, the reductions<br />
in Annex I countries are<br />
set at -25 percent in<br />
2020 <strong>and</strong> - 80 percent<br />
in 2050, compared to<br />
2000. Reductions in the<br />
non-Annex I countries<br />
are determined as the<br />
residual for the global<br />
Factor 2 reduction. It<br />
corresponds to a case in<br />
which Annex 1 countries<br />
adopt a strong target<br />
<strong>and</strong> leave room for some<br />
emission increases in<br />
Non Annex 1 regions, as<br />
they do not use flexibility<br />
mechanisms to comply<br />
with this target. In the<br />
Global Regime Full Trade (GR-FT) variant, the<br />
same world emission profile is simulated while<br />
considering one world carbon price that is obtained<br />
either by a unified world carbon tax or by a global<br />
market for carbon emission trading.<br />
Figure 7: Carbon Value <strong>and</strong> International <strong>Energy</strong> Price Trajectories (Europe Alone)<br />
2<br />
O<br />
C<br />
t<br />
/<br />
5<br />
0<br />
€<br />
200<br />
180<br />
160<br />
140<br />
120<br />
100<br />
80<br />
60<br />
40<br />
20<br />
0<br />
EU27<br />
Rest of the world<br />
Carbon Value - EA<br />
2000 2010 2020 2030 2040 2050<br />
Source: POLES model, LEPII, SECURE <strong>project</strong><br />
e<br />
o<br />
b<br />
/<br />
5<br />
0<br />
0<br />
2<br />
€<br />
100<br />
90<br />
80<br />
70<br />
60<br />
50<br />
40<br />
30<br />
20<br />
10<br />
0<br />
Oil Gas (Asia)<br />
Gas (Europe) Gas (America)<br />
Coal (Asia) Coal (Europe)<br />
Coal (America)<br />
International Prices - EA<br />
2000 2010 2020 2030 2040 2050<br />
1
<strong>Energy</strong> <strong>Security</strong>: Potential for EU-GCC Cooperation<br />
Figure 8: Europe Gross Inl<strong>and</strong> <strong>Energy</strong> Consumption <strong>and</strong> CO2 Emissions in Europe Alone<br />
2.2. Scenario Results<br />
As the Muddling Through with Europe Plus<br />
scenario is an intermediate case aimed at covering<br />
the range of policies between Muddling Through<br />
<strong>and</strong> Europe Alone, we will leave this case aside <strong>and</strong><br />
only provide a description of the consequences of the<br />
two most contrasted emission reduction scenarios,<br />
i.e. Europe Alone <strong>and</strong> Global Regime.<br />
2.2.1. europe Alone (eA)<br />
This scenario aims at studying the impacts on the<br />
energy system of a strong climate policy in Europe,<br />
in spite a non-cooperative international framework<br />
with climate policies in the rest of the world that still<br />
correspond to the Muddling Through framework.<br />
In this setting, the carbon value at the end of the<br />
period is six times higher in Europe than in the rest<br />
of the world (Figure 7).<br />
In this scenario, world gross inl<strong>and</strong> consumption<br />
<strong>and</strong> international energy prices are hardly impacted<br />
compared to the preceding scenario, as Europe only<br />
represents a limited <strong>and</strong> diminishing fraction of the<br />
world energy system, i.e. 9 percent of total GIEC in<br />
2050.<br />
Conversely, in this scenario, the <strong>European</strong> energy<br />
system is profoundly altered by the introduction of a<br />
significant carbon value. Total energy consumption<br />
1<br />
e<br />
o<br />
t<br />
M<br />
3 000<br />
2 500<br />
2 000<br />
1 500<br />
1 000<br />
500<br />
0<br />
EU27 Primary consumption - EA<br />
Other Renew ables<br />
Biomass<br />
Nuclear<br />
Coal, lignite<br />
Natural gas<br />
Oil<br />
2000 2010 2020 2030 2040 2050<br />
Source: POLES model, LEPII, SECURE <strong>project</strong><br />
q<br />
e<br />
2<br />
O<br />
C<br />
t<br />
G<br />
5.0<br />
4.5<br />
4.0<br />
3.5<br />
3.0<br />
2.5<br />
2.0<br />
1.5<br />
1.0<br />
0.5<br />
0.0<br />
EU27 - Total <strong>and</strong> CO2 emissions - EA<br />
CO2 EU27<br />
CO2Eq EU27<br />
2000 2010 2020 2030 2040 2050<br />
remains quite stable during the period. But the fuelmix<br />
in total supply is quite different: fossil energy<br />
sources, which represent in 2000 79 percent of total<br />
GIEC are reduced to 71percent in 2020 <strong>and</strong> to 46<br />
percent in 2050. The electricity system also incurs<br />
radical changes <strong>and</strong> is a major contributor to the<br />
reductions of carbon emissions in Europe (Figure 9).<br />
Electricity production increases all over the<br />
<strong>project</strong>ion period from 3,000 TWh in 2000 to 5,200<br />
in 2050. This indicates that the electrification of<br />
the energy balance is one important dimension of<br />
emission abatement policies in the energy sector.<br />
This is easily explained by the following reasons:<br />
first, the pe<strong>net</strong>ration of non-CO2 power generation<br />
options allows reducing considerably the CO2<br />
content of the average kWh; second, stimulated by<br />
the high carbon value, Carbon Capture <strong>and</strong> Storage<br />
(CCS) develops after 2020 <strong>and</strong> represents almost 47<br />
percent of total thermal generation in 2050. This<br />
explains why electricity is almost carbon-free in<br />
Europe by the end of the <strong>project</strong>ion period <strong>and</strong> why<br />
the role of the electricity sector is so prominent in<br />
emission abatement policies.<br />
2.2.2. Global Climate Regime (GR)<br />
The main feature of this scenario is the<br />
introduction of a global cap on emissions. The Global
Regime scenario reflects a state of the world with<br />
ambitious climate targets, aiming at an emission<br />
profile of Type II in the AR4 typology. Emissions<br />
indeed double over the period considered, which<br />
would place this scenario in the very high range of<br />
the IPCC scenarios: a type VI scenario in the Table<br />
SPM.5 of AR4 (see Table 1), i.e. a mean temperature<br />
increase at equilibrium between 5 <strong>and</strong> 6°C (see<br />
Table 1 ). It allows stabilizing concentrations below<br />
450 CO2-only <strong>and</strong> 500 CO2-equiv. <strong>and</strong> is indeed<br />
characterized by a 50 percent reduction in global<br />
emissions.<br />
In the variant Global Regime with Two Markets<br />
(GR-TM), Annex 1 countries reduce their emissions<br />
by 25 percent in 2020 <strong>and</strong> 80 percent in 2050. These<br />
reductions are triggered by a rapidly increasing<br />
carbon value, which increases from 16 €/tCO2 in<br />
2010 to 68 €/tCO2 in 2020 <strong>and</strong> to 392 €/tCO2 in<br />
2050. The corresponding carbon value in non-Annex<br />
1 countries is significantly lower at 10 €/tCO2 in 2020<br />
<strong>and</strong> 257€/tCO2 in 2050.<br />
In the second variant, Global Regime with Full<br />
Trade (GR-FT), it is supposed that the abatement<br />
program follows the principle of the equalization of<br />
Marginal Abatement costs, as would result fromthe<br />
introduction of a unique carbon value, through a<br />
global carbon market or a unified international<br />
h<br />
W<br />
T<br />
6 000<br />
5 000<br />
4 000<br />
3 000<br />
2 000<br />
1 000<br />
0<br />
Other renew ables<br />
Nuclear<br />
Biomass<br />
Coal, lignite<br />
Natural gas<br />
Oil<br />
EU27 Electricity production - EA<br />
2000 2010 2020 2030 2040 2050<br />
The <strong>European</strong> <strong>Energy</strong> Sector <strong>and</strong> the Climate-<strong>Security</strong> Nexus in the SECURE Scenarios<br />
carbon tax. In this framework of hypotheses, the<br />
resulting carbon value increases rapidly to 28 €/<br />
tCO2 in 2020, 73 in 2030, 178 in 2040 <strong>and</strong> 383 in<br />
2050. One can emphasize the fact that the carbon<br />
value that is necessary to induce radically new<br />
trajectories in the world <strong>and</strong> <strong>European</strong> energy<br />
system is one order of magnitude higher than<br />
the value used in the Muddling Through, low<br />
intensity policy case. This corresponds to the<br />
fact that the Global Regime scenario reveals the<br />
need for radical changes in the energy systems:<br />
indeed 400 €/tCO2 correspond approximately to<br />
one additional euro per litre of gasoline in typical<br />
<strong>European</strong> conditions.<br />
While the <strong>European</strong> Gross Inl<strong>and</strong> <strong>Energy</strong><br />
Consumption <strong>and</strong> fuel-mix are not significantly<br />
different from the one simulated in Europe Alone (as<br />
presented in Figure 8), major changes occur in the<br />
global energy picture. World energy consumption is<br />
reduced by about one fourth compared to the one<br />
<strong>project</strong>ed in the Muddling Through. As a result, the<br />
total amount of fossil fuels (coal, oil <strong>and</strong> gas) that is<br />
consumed at world level in 2050 is 8 percent lower<br />
than the one of 2000 (Figure 11). Due to its relatively<br />
low carbon content, natural gas consumption in<br />
2050 is still higher than in 2000, but coal <strong>and</strong> oil<br />
consumption are lower.<br />
Figure 9: Europe Electricity Generation Mix <strong>and</strong> Role of Carbon Capture <strong>and</strong> Storage in Europe Alone<br />
Source: POLES model, LEPII, SECURE <strong>project</strong><br />
h<br />
W<br />
T<br />
6 000<br />
5 000<br />
4 000<br />
3 000<br />
2 000<br />
1 000<br />
EU27 Electricity Production with <strong>and</strong> w/o Sequestration - EA<br />
Thermal With SEQ<br />
Thermal WO SEQ<br />
Other<br />
0<br />
2000 2010 2020 2030 2040 2050<br />
1
<strong>Energy</strong> <strong>Security</strong>: Potential for EU-GCC Cooperation<br />
In order to reduce global emissions by 50 percent,<br />
this scenario supposes a significant development of<br />
Carbon Capture <strong>and</strong> Storage. By 2050, almost 44<br />
percent of total gross emissions are captured, with<br />
almost 90 percent of CCS occurring in the electricity<br />
sector <strong>and</strong> the rest in industry <strong>and</strong> hydrogen<br />
production.<br />
As a consequence of the low levels of<br />
consumption for the different fossil fuels in 2050<br />
relatively to 2000, the prices of fossil fuels can<br />
be expected to be much lower in this scenario<br />
than in the Muddling Through or even Europe<br />
Alone scenarios. Indeed, the endogenous price<br />
mechanisms in the model result in a stabilization of<br />
international energy prices, at a level that is only 10<br />
to 20 percent superior to current level, all along the<br />
<strong>project</strong>ion period.<br />
This leads to the main intermediate conclusion<br />
at this stage: climate policies, if they are ambitious<br />
<strong>and</strong> effective, will have a significant impact on<br />
the dem<strong>and</strong>/supply balance for fossil fuels at the<br />
international level. In turn, this new balance of<br />
the global energy economy will certainly have<br />
significant impact on the range <strong>and</strong> variations in<br />
1<br />
the international prices of coal, oil <strong>and</strong> gas. Even if<br />
exporting countries limit their investments <strong>and</strong> the<br />
capacity increases in order to maintain the price<br />
level, the anticipated tensions on the international<br />
markets regarding the risks of price hikes would be<br />
much reduced in all scenarios with strong <strong>and</strong> global<br />
climate policies.<br />
3. Impacts on International energy trade<br />
<strong>and</strong> on europe’s energy security<br />
In this section, we first analyze the consequences<br />
of the different scenarios in the perspective of<br />
Europe’s dependence upon the international markets<br />
<strong>and</strong> consider the corresponding value of energy<br />
imports. In the second stage, we focus on natural<br />
Figure 10: Carbon Value Meeting the Emission Cap <strong>and</strong> Endogenous International <strong>Energy</strong> Prices in Global<br />
Regime (GR-full trade)<br />
2<br />
O<br />
C<br />
t<br />
/<br />
5<br />
€ 0<br />
400<br />
350<br />
300<br />
250<br />
200<br />
150<br />
100<br />
50<br />
0<br />
Annex1<br />
Rest of the world<br />
Carbon Value - GR-FT<br />
2000 2010 2020 2030 2040 2050<br />
Source: POLES model, LEPII, SECURE <strong>project</strong><br />
e<br />
o<br />
b<br />
/<br />
5<br />
0<br />
€<br />
100<br />
90<br />
80<br />
70<br />
60<br />
50<br />
40<br />
30<br />
20<br />
10<br />
0<br />
International Prices - GR-FT<br />
Oil Gas (Asia)<br />
Gas (Europe) Gas (America)<br />
Coal (Asia) Coal (Europe)<br />
Coal (America)<br />
2000 2010 2020 2030 2040 2050<br />
gas imports <strong>and</strong> analyze the profile <strong>and</strong> sources of<br />
these imports in a geopolitical perspective.<br />
3.1.World Oil <strong>Supply</strong> <strong>and</strong> Trade<br />
The profile of oil production is an important<br />
feature of any long-term energy scenario. Because<br />
it is easy to transport, store <strong>and</strong> use, oil has been<br />
for many decades the “swing energy source” for<br />
balancing energy supply <strong>and</strong> dem<strong>and</strong>. For that
e<br />
o<br />
t<br />
G<br />
20<br />
18<br />
16<br />
14<br />
12<br />
10<br />
8<br />
6<br />
4<br />
2<br />
0<br />
Other Renew ables<br />
Biomass<br />
Nuclear<br />
Coal, lignite<br />
Natural gas<br />
Oil<br />
World Primary consumption - GR-FT<br />
2000 2010 2020 2030 2040 2050<br />
Source: POLES model, LEPII, SECURE <strong>project</strong><br />
reason, the price of oil often serves as a reference<br />
price for other energy sources. As discussed above,<br />
the Muddling Through <strong>project</strong>ion suggests that<br />
this balancing role may become more problematic<br />
in the future, due to increasing difficulties in<br />
balancing oil dem<strong>and</strong> <strong>and</strong> supply. According to the<br />
SECURE simulations, the world has emerged from<br />
a 20-year period of relatively cheap <strong>and</strong> abundant<br />
oil that began after the 1986 counter-shock. In<br />
The <strong>European</strong> <strong>Energy</strong> Sector <strong>and</strong> the Climate-<strong>Security</strong> Nexus in the SECURE Scenarios<br />
Figure 11: World Gross Inl<strong>and</strong> Consumption <strong>and</strong> CO2 Emissions by Sector in the Global Regime (GR-FT)<br />
Figure 12: Oil Production, World <strong>and</strong> Main Regions, 1965-2009<br />
d<br />
b<br />
0<br />
0<br />
0<br />
1<br />
90000<br />
80000<br />
70000<br />
60000<br />
50000<br />
40000<br />
1965 1969<br />
1973<br />
19 7<br />
1981<br />
1985 1989 19<br />
9 3<br />
19 9 7<br />
20<br />
0 1<br />
20<br />
0 5<br />
2<br />
30000<br />
20000<br />
10000<br />
0<br />
Source: BP Statistical Review 2010<br />
0<br />
9<br />
2<br />
O<br />
C<br />
t<br />
G<br />
30<br />
25<br />
20<br />
15<br />
10<br />
5<br />
0<br />
World CO2 emissions by sector (energy) - GR-FT<br />
2000 2010 2020 2030 2040 2050<br />
the view of many observers <strong>and</strong> more recently<br />
also of insiders of the oil industry, the oil market<br />
in the next decade may undergo successive waves<br />
of structural changes that can be summarized as<br />
follows:<br />
• In the short-term, the international market<br />
dynamics will be much influenced by the lack<br />
of surplus production capacity <strong>and</strong> by the<br />
peak in production in non-OPEC countries (a<br />
Total World<br />
OPEC<br />
Non-OPEC<br />
Non-FSU<br />
Former<br />
Soviet Union<br />
•<br />
•<br />
•<br />
Transformaon<br />
Transport<br />
Res-Ser-Agr<br />
Industry<br />
phenomenon that has been delayed<br />
in the past decade by production<br />
increases in the CIS).<br />
In the medium-term, the critical<br />
concern will be the extension of OPEC’s<br />
countries production capacities well<br />
beyond their historic maximum (i.e.<br />
35 Mbd in 2008).<br />
In the long-term, the peak in OPEC<br />
<strong>and</strong> <strong>Gulf</strong> production may constrain the<br />
global consumption of oil, even if nonconventional<br />
oil is strongly developed<br />
(as it is already in the Muddling<br />
Through case).<br />
This vision of the future of world oil is<br />
indeed consistent with a close analysis<br />
of recent trends in world oil production<br />
that clearly shows the levelling-off<br />
1
<strong>Energy</strong> <strong>Security</strong>: Potential for EU-GCC Cooperation<br />
Figure 13: Main Producers of Conventional Oil (left) <strong>and</strong> Non-Conventional Oil (right)<br />
20<br />
Muddling Through<br />
100<br />
90<br />
80<br />
70<br />
60<br />
50<br />
40<br />
30<br />
20<br />
10<br />
0<br />
Europe Alone<br />
d<br />
/<br />
l<br />
b<br />
M<br />
Main producers of conventional oil -MT<br />
Main producers of conventional oil -EA<br />
100<br />
90<br />
80<br />
70<br />
60<br />
50<br />
40<br />
30<br />
20<br />
10<br />
0<br />
Global Regime<br />
100<br />
90<br />
80<br />
70<br />
60<br />
50<br />
40<br />
30<br />
20<br />
10<br />
0<br />
2000 2010 2020 2030 2040 2050<br />
Main producers of conventional oil-GRFT<br />
Source: POLES model, LEPII, SECURE <strong>project</strong><br />
Other Countries<br />
Canada<br />
USA<br />
Russia<br />
Nigeria<br />
Venezuela<br />
Iran<br />
Iraq<br />
UAE<br />
Kuwait<br />
Saudi Arabia<br />
<strong>Gulf</strong><br />
Other Countries<br />
100<br />
Canada<br />
90<br />
USA<br />
80<br />
Russia<br />
70<br />
Nigeria<br />
60<br />
Venezuela<br />
50<br />
Iran<br />
40<br />
Iraq<br />
30<br />
UAE<br />
20<br />
10<br />
Kuwait<br />
0 Saudi Arabia<br />
<strong>Gulf</strong><br />
Other Countries<br />
Canada<br />
USA<br />
Russia<br />
Nigeria<br />
Venezuela<br />
Iran<br />
Iraq<br />
UAE<br />
Kuwait<br />
Saudi Arabia<br />
<strong>Gulf</strong><br />
d<br />
/<br />
l<br />
Mb<br />
d<br />
/<br />
l<br />
Mb<br />
d<br />
/<br />
l<br />
Mb<br />
12<br />
10<br />
8<br />
6<br />
4<br />
2<br />
0<br />
12<br />
10<br />
12<br />
10<br />
8<br />
6<br />
4<br />
2<br />
0<br />
8<br />
6<br />
4<br />
2<br />
0<br />
Main producers of non-conventional oil -MT<br />
2000 2010 2020 2030 2040 2050<br />
Main producers of non-conventional oil -EA<br />
2000 2010 2020 2030 2040 2050<br />
Main producers of non-conventional<br />
oil -GRFT<br />
2000 2010 2020 2030 2040 2050<br />
Other<br />
USA-Oil Shales<br />
Canada-Tar<br />
S<strong>and</strong>s<br />
Venezuela-<br />
Extra Heavy Oil<br />
Other<br />
USA-Oil Shales<br />
Canada-Tar<br />
S<strong>and</strong>s<br />
Venezuela-<br />
Extra Heavy Oil<br />
Other<br />
USA - Oil Shales<br />
Canada - Tar<br />
S<strong>and</strong>s<br />
Venezuela -<br />
Extra Heavy Oil
of oil production in non-OPEC non-CIS regions<br />
(Figure 12)<br />
The conventional <strong>and</strong> non-conventional oil<br />
production profiles in the Muddling Through SECURE<br />
scenario, as illustrated in the top row of Figure 13,<br />
describe the <strong>project</strong>ion of world oil production in a<br />
setting of limited intensity climate policies:<br />
• Non-OPEC production was still increasing before<br />
2010 due to new capacities in the CIS (notably<br />
in Kazakhstan); between 2010 <strong>and</strong> 2020 it is<br />
stabilized at 48 Mbd but after that date it begins<br />
to decline to only 30 Mbd in 2050.<br />
• As dem<strong>and</strong> increase remains strong in the next<br />
decades, particularly in the emerging economies,<br />
the balance of supply <strong>and</strong> dem<strong>and</strong> implies that<br />
production in both the <strong>Gulf</strong> <strong>and</strong> the rest of OPEC<br />
doubles from now to 2040 <strong>and</strong> then stabilizes<br />
until 2050.<br />
• Similarly, the production of non-conventional<br />
oil, mostly from extra-heavy oil, tar s<strong>and</strong>s <strong>and</strong> by<br />
the end of the <strong>project</strong>ion also oil shales, becomes<br />
competitive <strong>and</strong> provides more than one tenth of<br />
total production in 2050.<br />
• As a combination of these different trends, the<br />
production of conventional oil peaks at 95 Mbd<br />
in 2030, while non conventional oil represents<br />
at that date 6 Mbd. After 2030, conventional<br />
production progressively decreases to 83 Mbd in<br />
2050, but part of the retreat in conventional oil is<br />
compensated by an increase in non conventional<br />
production to about 11 Mbd.<br />
• The global oil production profile thus resembles<br />
the so-called oil plateau anticipated by many<br />
observers of the oil scene, with a maximum<br />
production after 2030 at 101 Mbd <strong>and</strong> then a slow<br />
decline to about 94 Mbd in 2050.<br />
The world oil production profile is hardly affected<br />
by the introduction of a strong carbon constraint in<br />
the Europe Alone case (see Figure 13, middle row).<br />
Conventional oil production levels off between 2020<br />
<strong>and</strong> 2030, while non conventional oil production is<br />
about 10 percent lower in 2050 than in the Muddling<br />
Through case.<br />
The situation is, of course, very different in the<br />
Global Regime where conventional oil tops in 2020<br />
with a strong decline after that date, while non-<br />
The <strong>European</strong> <strong>Energy</strong> Sector <strong>and</strong> the Climate-<strong>Security</strong> Nexus in the SECURE Scenarios<br />
conventional oil hardly increases over the <strong>project</strong>ion<br />
period (see Figure 13 bottom row). This is clearly the<br />
result of a “peak dem<strong>and</strong>” introduced by strong<br />
carbon constraints in all world regions. High fossil<br />
fuel prices at consumer level are very high in that<br />
case due to the price of carbon, <strong>and</strong> oil dem<strong>and</strong> is<br />
significantly reduced by the development of high<br />
efficiency <strong>and</strong> low emission options in transport<br />
(electric <strong>and</strong> hydrogen vehicles).<br />
The increase in oil energy consumption upto<br />
2050 appears to be limited even in the Muddling<br />
Through case. However, due to the general decline<br />
in non-OPEC production the international trade<br />
in oil increases from about 1.5 Gtoe today to more<br />
than 2.3 Gtoe in 2030 <strong>and</strong> 2040 (see Figure 14, where<br />
flows are measured between the main world regions).<br />
This is partly the consequence of the increase<br />
in consumption, but also of the concentration<br />
of production in the OPEC countries <strong>and</strong> more<br />
particularly the <strong>Gulf</strong>. In 2050, four regions are <strong>net</strong><br />
exporters of oil, with the Middle East representing<br />
three-fourth of total exports. The other exporting<br />
regions are the CIS, Latin America <strong>and</strong> Africa. One<br />
can note the reduced imports of North America,<br />
which are due to the large supply of non-conventional<br />
oil from Canada. Again the world situation is hardly<br />
affected in the Europe Alone case.<br />
Finally, the consequences of the Global Regime<br />
can be synthesized as follows: while oil exports of<br />
the four structurally exporting regions are doubled<br />
in 2030 compared to 2000, the situation in 2050 is,<br />
to a large extent, a return to the 2000 situation, with<br />
almost unchanged market shares <strong>and</strong> a maintained<br />
dominance of the Middle East in total exports.<br />
3.2 World Gas <strong>Supply</strong>, Trade <strong>and</strong> <strong>European</strong><br />
Imports<br />
One of the key concerns regarding the long-term<br />
energy security of Europe is its dependence in terms<br />
of gas supply. Natural gas is a key resource, with<br />
new perspectives introduced by non-conventional<br />
shale gas. Its environmental characteristics are<br />
rather favorable, including in the context of GHG<br />
abatement policies, as gas-based electricity has a<br />
CO2 content that is on average half of that of coalbased<br />
electricity (when no-capture <strong>and</strong> storage<br />
21
<strong>Energy</strong> <strong>Security</strong>: Potential for EU-GCC Cooperation<br />
Figure 14: International oil trade<br />
Source: POLES model, LEPII, SECURE <strong>project</strong><br />
22<br />
option is considered). Natural gas also brings<br />
flexibility <strong>and</strong> diversification of energy supply at the<br />
transformation or end-use level.<br />
One of the key issues with natural gas supply<br />
is that of the transport infrastructure that is highly<br />
investment intensive whether in the form of gas<br />
pipelines or in terms of LNG facilities at exporting<br />
or importing points. The POLES model allows the<br />
description, with a relatively high level of detail, of<br />
the conditions of supply of the different regions of<br />
the world. It takes into account the key variables<br />
that explain the development of gas transport<br />
infrastructure, with an explicit description of the<br />
main routes <strong>and</strong> of their costs. These routes are<br />
developed endogenously, as a function of each<br />
region’s dem<strong>and</strong>, supply <strong>and</strong> gas market price, of<br />
the state of the reserves of the suppliers <strong>and</strong> of the<br />
transports costs, pipelines or LNG chains.<br />
In the Muddling Through case, contrary to the<br />
oil situation, there is no peak gas before 2050, <strong>and</strong><br />
by that date world gas production is about twice<br />
that of 2000, with 4.8 Bcm (see Figure 15). The <strong>Gulf</strong><br />
<strong>and</strong> CIS regions will account for an increasing share<br />
of world production in the future, as <strong>European</strong><br />
<strong>and</strong> North American production decreases in<br />
absolute terms. In particular, gas production in the<br />
<strong>Gulf</strong> region increases from 0.4 Bcm in 2010 to 1.9<br />
Bcm in 2050. Again, the Europe Alone case does<br />
not introduce noticeable changes at the world<br />
level. Only in the Global Regime case is world gas<br />
production significantly impacted. However, there<br />
is still in that case, a significant increase in world gas<br />
production, from 3 Bcm in 2010 to 4 Bcm in 2050.<br />
The <strong>Gulf</strong> region <strong>and</strong> CIS are the main suppliers, with<br />
35 percent each of world gas production.<br />
Inter-regional trade in gas increases considerably<br />
in the Muddling Through scenario as shown in Figure<br />
16, from 0.2 Gtoe today to 1.5 Gtoe in 2050. These<br />
figures exclude intra-regional trade. The Middle East<br />
<strong>and</strong> the CIS are by far the largest exporters in 2050.<br />
The principal importing regions in 2050 are Asia,<br />
Europe <strong>and</strong>, to a lesser extent, North America; Africa<br />
is self-sufficient for its gas supply. The decrease of<br />
gas dem<strong>and</strong> in other scenarios is accompanied by<br />
reduction of the imports to 1 Gtoe in 2050 in Global<br />
Regime.
Figure 15: Principal Producers of Natural Gas<br />
in the Four Scenarios<br />
r<br />
a<br />
e<br />
y<br />
/<br />
3<br />
m<br />
G<br />
r<br />
a<br />
e<br />
y<br />
/<br />
3<br />
m<br />
G<br />
r<br />
a<br />
e<br />
y<br />
/<br />
3<br />
m<br />
G<br />
5 000<br />
4 500<br />
4 000<br />
3 500<br />
3 000<br />
2 500<br />
2 000<br />
1 500<br />
1 000<br />
500<br />
0<br />
5 000<br />
4 500<br />
4 000<br />
3 500<br />
3 000<br />
2 500<br />
2 000<br />
1 500<br />
1 000<br />
500<br />
0<br />
Principal producers of natural gas - MT<br />
2000 2010 2020 2030 2040 2050<br />
Principal producers of natural gas - EA<br />
2000 2010 2020 2030 2040 2050<br />
Principal producers of natural gas - GR FT<br />
5 000<br />
4 500<br />
4 000<br />
3 500<br />
3 000<br />
2 500<br />
2 000<br />
1 500<br />
1 000<br />
500<br />
0<br />
2000 2010 2020 2030 2040 2050<br />
The <strong>European</strong> <strong>Energy</strong> Sector <strong>and</strong> the Climate-<strong>Security</strong> Nexus in the SECURE Scenarios<br />
Other countries<br />
Europe<br />
North America<br />
CIS<br />
<strong>Gulf</strong><br />
Other countries<br />
Europe<br />
North America<br />
CIS<br />
<strong>Gulf</strong><br />
Other countries<br />
Europe<br />
North America<br />
CIS<br />
<strong>Gulf</strong><br />
Source: POLES model, LEPII, SECURE <strong>project</strong><br />
The simulation of different conditions of<br />
international energy markets <strong>and</strong> <strong>European</strong><br />
energy system in the SECURE scenarios allows the<br />
display of very different profiles for Europe’s future<br />
natural gas supply (Figure 17). In the Muddling<br />
Through scenario, Western Europe’s total gas<br />
imports (i.e. gas consumption minus supplies from<br />
UK, Netherl<strong>and</strong>s <strong>and</strong> Norway) are expected to<br />
increase dramatically over the next decades, from<br />
200 Bcm to 650 Bcm in 2050. This happens, in spite<br />
of a total dem<strong>and</strong> that is levelling off at about<br />
700 Bcm between 2030 <strong>and</strong> 2040, but this is due<br />
to the reduction in regional domestic production<br />
from Norway, UK <strong>and</strong> Netherl<strong>and</strong>s, which are<br />
divided by a factor of almost four between 2000<br />
<strong>and</strong> 2050, from 240 to 50 Bcm. While supply from<br />
Russia increases from 130 Bcm to 219-226 Bcm<br />
in these two scenarios, <strong>European</strong> gas supply also<br />
increasingly depends on new supplies from Nigeria,<br />
the Commonwealth of Independent States (mostly<br />
Kazakhstan), <strong>and</strong> Iran.<br />
The picture is quite different in the Europe<br />
Alone <strong>and</strong> Global Regime cases: due to the carbon<br />
constraint, total gas dem<strong>and</strong> of Western Europe is<br />
much lower after 2020 than in the two preceding<br />
cases. In 2050, it is even lower than in 2000 with<br />
about 400 Bcm in Global Regime scenario. To a large<br />
extent, this reduction of total dem<strong>and</strong> weighs on<br />
the new suppliers that would play an important role<br />
in the Muddling Through scenario, i.e. Saudi Arabia,<br />
Venezuela, Nigeria, Kazakhstan <strong>and</strong> Iran. Imports<br />
from Russia still represent about 200 Bcm in 2050 in<br />
both scenarios.<br />
In conclusion of this analysis of long-term<br />
natural gas supply of Europe, one has indeed to<br />
emphasize the fact that the volume of Russian<br />
exports to Europe appear to be relatively stable<br />
in the different scenarios, at least until 2040,<br />
when they reach a level of about 200 Bcm in the<br />
four cases. Only after that date do the results<br />
differ significantly, with exports that are 30 to 40<br />
percent higher in the Muddling Through than in<br />
the Europe Alone <strong>and</strong> Global Regime scenarios.<br />
Russia seems, however, to keep a comparative<br />
advantage in the supply of Europe in the carbon<br />
constraint cases.<br />
2
<strong>Energy</strong> <strong>Security</strong>: Potential for EU-GCC Cooperation<br />
Figure 16: International Gas Trade<br />
Source: POLES model, LEPII, SECURE <strong>project</strong><br />
24<br />
3.3. World Coal <strong>Supply</strong> <strong>and</strong> Trade<br />
In spite of resources that are more widely<br />
distributed than those of oil <strong>and</strong> gas, international<br />
coal trade doubles over the <strong>project</strong>ion period in the<br />
Muddling Through (Figure 18) scenario. The high<br />
volume of trade reflects the strong comeback of<br />
coal in a double context of relative scarcity <strong>and</strong> high<br />
prices of oil <strong>and</strong> gas, accompanied by only moderate<br />
GHG emission constraints. The situation changes<br />
in the Europe Alone <strong>and</strong> Global Regime scenarios.<br />
Coal trade remains almost stable during the period<br />
in the Europe Alone scenario <strong>and</strong> it even decreases<br />
compared to current levels in the Global Regime<br />
scenario.<br />
Europe remains the major importer, representing<br />
more than 80 percent of <strong>net</strong> imports during the<br />
whole period in all scenarios except in the Europe<br />
Alone case, in which other world regions continue<br />
to intensively use coal. However, <strong>European</strong> coal<br />
imports shrink from the Muddling Through scenario<br />
to the others, due to changes in the structure of the<br />
electricity generation <strong>and</strong> final consumption in favor<br />
of decarbonised energies <strong>and</strong> cleaner technologies.<br />
The four main exporting regions are North<br />
America, the Pacific, Africa <strong>and</strong> the CIS. Because of<br />
the rapid growth in consumption, Asia becomes a<br />
<strong>net</strong> importer late in the period. Their share remains<br />
nearly stable, while the volume diminishes in the<br />
Europe Alone <strong>and</strong> Global Regime scenarios.<br />
3.4.Consequences for Europe’s <strong>Energy</strong><br />
Dependence <strong>and</strong> Value of Imports<br />
The scenarios presented above result in very<br />
different profiles for energy imports <strong>and</strong> dependence.<br />
The Muddling Through corresponds to the scenario<br />
with higher consumption, imports, dependence rate<br />
<strong>and</strong> value of energy imports. While Europe’s global<br />
import dependence rate was of 50 percent in 2005<br />
<strong>and</strong> the value of energy imports of 236 G€ in 2005,<br />
these figures rise respectively to 57 percent <strong>and</strong> 351<br />
G€ in 2020 <strong>and</strong> 53 percent <strong>and</strong> 491 G€ in 2050 (Table<br />
3, upper row).<br />
The Europe Alone scenario presents interesting<br />
characteristics, as it is the one with the lowest<br />
level of energy imports in terms of volume <strong>and</strong><br />
dependence rate. This can be easily explained as this
Figure 17: Europe’s Natural Gas Supplies in the Four<br />
Scenarios<br />
Source: POLES model, LEPII, SECURE <strong>project</strong><br />
The <strong>European</strong> <strong>Energy</strong> Sector <strong>and</strong> the Climate-<strong>Security</strong> Nexus in the SECURE Scenarios<br />
case combines a stringent emission reduction policy<br />
in Europe, while the rest of the world continues<br />
along a line of modest climate policy. In that case,<br />
the global dem<strong>and</strong> <strong>and</strong> prices for fossil fuels remain<br />
high <strong>and</strong> this not only limits dem<strong>and</strong> in Europe but<br />
also stimulates domestic supply. The value of total<br />
energy imports is more than halved in the Europe<br />
Alone scenario in 2050, compared to the Muddling<br />
Through. One key outcome of the study is thus<br />
that a strong <strong>European</strong> climate policy may create a<br />
double dividend in terms of energy security, even in<br />
the case of weak global climate coordination.<br />
Finally, the Global Regime scenario illustrates<br />
a fully different future for the world energy system,<br />
with lower global fossil fuel dem<strong>and</strong> <strong>and</strong> prices.<br />
Europe’s energy imports are similar in quantities<br />
compared to the Europe Alone case described<br />
above. But oil <strong>and</strong> gas prices are significantly lower<br />
<strong>and</strong>, as a consequence, the value of imports is at its<br />
lowest level: 144 G€ only in 2050, against 491 G€ in<br />
the Muddling Through scenario.<br />
Conclusion<br />
The scenario exercises developed in the SECURE<br />
<strong>project</strong> allow the illustration of the complex<br />
interactions of climate policies <strong>and</strong> energy security<br />
issues. They show in particular that the Muddling<br />
Through scenario, with low intensity <strong>and</strong> noncoordinated<br />
climate policy does not represent a<br />
really sustainable energy future. This is because of<br />
the double constraint that impends on the world<br />
energy system: upstream through the limitations<br />
in oil <strong>and</strong> gas availability <strong>and</strong> downstream, by the<br />
limited storage capacity of the atmosphere for<br />
GHGs. The low carbon price does already change<br />
significantly the level of emissions through reduced<br />
dem<strong>and</strong>, accelerated development of non-fossil<br />
energy sources <strong>and</strong> some development of Carbon<br />
Capture <strong>and</strong> Storage. But this is not sufficient to<br />
meet the emission targets that are considered<br />
as desirable in IPCC AR2 in order to limit average<br />
temperature increase at level of 2°C compared to<br />
the pre-industrial situation. Moreover, this scenario<br />
neither significantly alters the balance of dem<strong>and</strong> or<br />
supply on the international energy markets, although<br />
it alleviates somewhat the potential tensions.<br />
2
<strong>Energy</strong> <strong>Security</strong>: Potential for EU-GCC Cooperation<br />
Figure 18: International Coal Trade<br />
Source: POLES model, LEPII, SECURE <strong>project</strong><br />
2<br />
The Global Regime scenario clearly allows<br />
the improvement of the situation from these two<br />
perspectives, of reducing both emissions <strong>and</strong> the<br />
level of tension on international hydrocarbon<br />
markets, through lower oil <strong>and</strong> gas production. This<br />
is a potential double dividend situation, probably the<br />
most important one to be derived from ambitious<br />
climate policies. Finally, the Europe Alone scenario<br />
does not meet the climate target as the impacts<br />
of ambitious policies in Europe are not sufficient<br />
to compensate for the massive global emission<br />
increases in the rest of the world. However, in this<br />
scenario setting, there is still an element that is<br />
strongly beneficial for Europe:<br />
• Imposing strong emission reduction domestically<br />
results in a thorough restructuring of the <strong>European</strong><br />
energy system.<br />
• While it is supposed in this scenario that other<br />
countries adopt a free-riding behavior <strong>and</strong> do not<br />
trigger such a restructuring, it is probable that<br />
tensions on the oil <strong>and</strong> gas market would remain<br />
high, with risks of repeated shocks in the near<strong>and</strong><br />
long-term future.<br />
• In that case, Europe would be protected from<br />
these external shocks by lower energy dem<strong>and</strong>,<br />
higher contribution of domestic non-fossil fuels<br />
(renewable <strong>and</strong> nuclear), <strong>and</strong> a much lower level<br />
of fossil fuel imports.<br />
Would this reward of ambitious climate policies<br />
fully compensate for the extra costs of the energy<br />
system restructuring? This question remains open<br />
today, but future developments in the SECURE<br />
<strong>project</strong> may help to better appreciate the magnitude<br />
of the risk avoided through virtuous climate policy<br />
in a non-cooperative international context. Table 4<br />
intends to illustrate the fundamentals of the risks<br />
associated for a country (c) to a negative event<br />
(e) <strong>and</strong> develops the risks in the three archetypal<br />
scenarios examined in this study.<br />
It comes out of this study that an ambitious<br />
policy would bring to Europe a double dividend in its<br />
capacity to develop a new energy model − adjusted<br />
to sound climate policies − <strong>and</strong> in the resulting lower<br />
vulnerability to potential shocks on the international<br />
energy markets. Hence, it appears that it would<br />
probably be in the interest of Europe to implement
The <strong>European</strong> <strong>Energy</strong> Sector <strong>and</strong> the Climate-<strong>Security</strong> Nexus in the SECURE Scenarios<br />
Table 3: Profiles for Europe <strong>Energy</strong> Imports <strong>and</strong> Dependence in Three Contrasted Scenarios<br />
Muddling through<br />
MT Results - EU27 1990 2000 2005 2010 2020 2030 2040 2050<br />
GIC (Mtoe) 1531 1725 1822 1759 1820 1911 1909 1881<br />
Imports (Mtoe) Coal, lignite -72 -94 -107 -95 -96 -132 -144 -146<br />
Oil -464 -505 -557 -532 -543 -537 -475 -399<br />
Natural gas -112 -180 -250 -298 -399 -471 -473 -448<br />
Dependance rate Coal, lignite 17% 30% 35% 32% 35% 44% 48% 50%<br />
Oil 79% 76% 82% 81% 83% 86% 86% 85%<br />
Natural gas 45% 46% 56% 69% 83% 91% 94% 96%<br />
Total 42% 45% 50% 53% 57% 60% 57% 53%<br />
International prices (€05/boe) Coal 11.8 7.2 10.9 11.8 12.8 13.6 14.5 15.4<br />
Oil 24.9 25.9 44.2 51.9 60.5 72.2 85.2 99.6<br />
Gas 14.0 18.3 25.8 32.2 34.7 38.8 46.1 55.8<br />
Value of imports (G€05) Coal, lignite 6.2 4.9 8.6 8.2 9.0 13.2 15.3 16.4<br />
Oil 84.5 96.1 180.4 202.7 240.7 284.4 296.6 291.3<br />
Natural gas 11.5 24.1 47.3 70.3 101.5 133.8 160.1 183.1<br />
Total 102.3 125.1 236.3 281.2 351.2 431.5 472.1 490.9<br />
Europe Alone<br />
EA Results - EU27 1990 2000 2005 2010 2020 2030 2040 2050<br />
GIC (Mtoe) 1531 1725 1822 1740 1705 1756 1738 1700<br />
Imports (Mtoe) Coal, lignite -72 -94 -107 -86 -46 -55 -59 -60<br />
Oil -464 -505 -557 -522 -490 -440 -344 -255<br />
Natural gas -112 -180 -250 -295 -366 -373 -324 -295<br />
Dependance rate Coal, lignite 17% 30% 35% 31% 27% 34% 38% 42%<br />
Oil 79% 76% 82% 81% 82% 84% 82% 79%<br />
Natural gas 45% 46% 56% 69% 82% 88% 91% 94%<br />
Total 42% 45% 50% 52% 53% 49% 42% 36%<br />
International prices (€05/boe) Coal 11.8 7.2 10.9 11.7 12.7 13.4 14.3 15.2<br />
Oil 24.9 25.9 44.2 51.0 59.7 70.1 82.1 94.6<br />
Gas 14.0 18.3 25.8 31.8 35.1 38.1 44.2 53.5<br />
Value of imports (G€05) Coal, lignite 6.2 4.9 8.6 7.3 4.2 5.4 6.2 6.7<br />
Oil 84.5 96.1 180.4 195.4 214.5 226.0 206.9 177.1<br />
Natural gas 11.5 24.1 47.3 68.8 94.2 104.1 105.1 115.7<br />
Total 102.3 125.1 236.3 271.5 313.0 335.5 318.2 299.6<br />
Global Regime<br />
GR-FT Results - EU27 1990 2000 2005 2010 2020 2030 2040 2050<br />
GIC (Mtoe) 1531 1725 1822 1747 1801 1841 1781 1698<br />
Imports (Mtoe) Coal, lignite -72 -94 -107 -91 -73 -73 -73 -68<br />
Oil -464 -505 -557 -525 -527 -475 -357 -233<br />
Natural gas -112 -180 -250 -293 -397 -407 -341 -271<br />
Dependance rate Coal, lignite 17% 30% 35% 32% 33% 39% 42% 44%<br />
Oil 79% 76% 82% 81% 83% 86% 86% 84%<br />
Natural gas 45% 46% 56% 69% 83% 90% 93% 97%<br />
Total 42% 45% 50% 52% 55% 52% 43% 34%<br />
International prices (€05/boe) Coal 11.8 10.9 11.6 12.2 12.9 13.9 14.8 14.8<br />
Oil 24.9 44.2 51.1 57.9 61.9 59.1 46.4 44.6<br />
Gas 14.0 25.8 31.9 33.8 33.8 33.0 29.8 30.1<br />
Value of imports (G€05) Coal, lignite 6.2 7.5 9.2 8.1 7.0 7.5 8.0 7.3<br />
Oil 84.5 163.5 208.7 222.7 239.1 205.9 121.6 76.3<br />
Natural gas 11.5 34.0 58.5 72.6 98.5 98.6 74.4 59.9<br />
Total 102.3 205.0 276.4 303.4 344.6 312.0 203.9 143.5<br />
Source: POLES model, LEPII, SECURE <strong>project</strong><br />
2
<strong>Energy</strong> <strong>Security</strong>: Potential for EU-GCC Cooperation<br />
Table 4: Risk as the Vulnerability to an Adverse Event<br />
the ambitious policy that is part of the Climate <strong>and</strong><br />
<strong>Energy</strong> Package of 2008.<br />
Of course, this raises the issue of how to<br />
develop cooperative relations with oil- <strong>and</strong> gas-<br />
2<br />
Risk c/e = Probability e x Magnitude e x Vulnerability c/e<br />
Muddling<br />
Through<br />
High High High<br />
Europe Alone High High Low<br />
Global Regime Low Low Low<br />
exporting countries, who on<br />
their part may wish to benefit<br />
from a certain degree of security<br />
of dem<strong>and</strong>. Exchanges <strong>and</strong><br />
discussions on long-term energy<br />
scenarios − however fragile <strong>and</strong><br />
uncertain these scenarios remain<br />
− may help in an improved mutual<br />
underst<strong>and</strong>ing of the goals that<br />
are pursued by both categories<br />
of countries in the development<br />
of their energy policies. In that<br />
way, scenarios can be useful tools<br />
to develop a somewhat stabilized framework for<br />
the investment decisions that in any case will be<br />
necessary to ensure the long-term energy supply<br />
of the different world regions.
References<br />
•<br />
•<br />
•<br />
•<br />
•<br />
•<br />
•<br />
•<br />
•<br />
•<br />
•<br />
•<br />
•<br />
•<br />
•<br />
•<br />
•<br />
•<br />
•<br />
•<br />
•<br />
The <strong>European</strong> <strong>Energy</strong> Sector <strong>and</strong> the Climate-<strong>Security</strong> Nexus in the SECURE Scenarios<br />
Adelman, Morris A. 2004. The real oil problem. Regulation, Spring 2004.<br />
Adelman, Morris A. 1990. Mineral depletion, with special reference to petroleum. The Review of<br />
Economics <strong>and</strong> Statistics 7 (no.1):1-10.<br />
Aleklett, Kjell & al. 2010. The peak of the oil age – Analyzing the world oil production reference<br />
scenario in World <strong>Energy</strong> Outlook 2008. <strong>Energy</strong> Policy 38: 1398-1414.<br />
Babusiaux, Denis, <strong>and</strong> Pierre-René Bauquis, A double oil shock scenario. March 30, 2008, ENSPM, Paris<br />
EU <strong>Energy</strong> Policy blog, http://www.energypolicyblog.com/2008/03/30/a-double-oil-shock-scenario/<br />
Criqui, P., Mima, S. 2009. Exploring the energy security <strong>and</strong> climate policy nexus with the POLES<br />
energy model in the SECURE <strong>project</strong>. Communication à International energy workshop. Venise, 17-<br />
19 juin 2009.<br />
De Almeida, Pedro <strong>and</strong> Silva Pedro D. 2009. The peak of oil production – Timings <strong>and</strong> market<br />
recognition. <strong>Energy</strong> Policy 37: 1267-1276.<br />
De Castro, Carlos, Miguel Luis Javier & Mediavilla Margarita. 2009. The role of non conventional oil<br />
in the attenuation of peak oil. <strong>Energy</strong> Policy 37 (no. 5): 1825-1833.<br />
Eskel<strong>and</strong>, G., Criqui, P., Jochem, E., Neufeld, H. , Mima, S., collab., et al. 2010. Transforming the<br />
<strong>European</strong> energy system. In Making climate change work for us, Chap. 7, eds. M. Hulme, H. Neufeld.<br />
165-199. Cambridge: Cambridge University Press.<br />
Forbes, Sarah. 2009. Community engagement for CCS. World Resources Institute. April 23, www.wri.<br />
org<br />
Knopf, B., Edenhofer, O., Criqui, P., collab., Mima, S., collab., et al. 2010. The economics of low<br />
stabilisation: implications for technological change <strong>and</strong> policy. In Making climate change work for<br />
us. Chap. 11, eds. M. Hulme, H. Neufeld, 291-318. Cambridge: Cambridge University Press.<br />
Hemmingsen, Emma. 2010., “At the base of Hubbert’s Peak: Grounding the debate on petroleum<br />
scarcity. Geoforum, 10p.<br />
International <strong>Energy</strong> Agency. 2008., World <strong>Energy</strong> Outlook 2008, OECD-IEA, Paris.<br />
Mabro, Robert. 2010. On oil peak or peaks. Oxford <strong>Energy</strong> Journal, Issue 80: 9-11.<br />
Mabro, Robert. 2006. The peak oil theory. Oxford <strong>Energy</strong> Comment, September 2006.<br />
Maggio G. & Cacciola G. 2009. A variant of the Hubbert Curve for world oil production forecasts.<br />
<strong>Energy</strong> Policy 37 (no.11): 4761-4770.<br />
Mark<strong>and</strong>ya, A., B. Armstrong, S. Hales, A. Chiabai, P. Criqui, S. Mima, C. Tonne, P. Wilkinson. 2009.<br />
Impact on public health of strategies to reduce greenhouse gases: low carbon electricity generation.<br />
The Lancet 374 (no. 9706) : 2006-2015.<br />
Masset, Jean-Marie (avec les contributions de P-R Bauquis, D. Gautier & A. Perrodon) .2009., Pétrole,<br />
Gaz : pic ou plateau. Revue de l’énergie, no. 591 (Oct): 318-325.<br />
Matutinovic, Igor. 2009. Oil <strong>and</strong> the political economy of energy. <strong>Energy</strong> Policy 37 (no. 11): 4251-<br />
4258.<br />
Mohr, S. H. <strong>and</strong> G.M. Evans. 2010. Long term prediction of unconventional oil production. <strong>Energy</strong><br />
Policy 38: 265-276.<br />
Odell, Peter R. 2003. The global energy outlook for the 21st century. Lecture given in Wassenaar,<br />
May 21.<br />
Porter, Edward D. 1995. Are we running out of oil? Discussion Paper #081, American Petroleum<br />
Institute.<br />
2
<strong>Energy</strong> <strong>Security</strong>: Potential for EU-GCC Cooperation<br />
•<br />
•<br />
•<br />
•<br />
•<br />
0<br />
Stevens, Paul. 2009. The coming oil supply crunch, Chatham House Report, London.<br />
Wells, Peter, R. A. 2005. Oil supply challenges -1: The non-OPEC decline. Oil & Gas Journal, February<br />
21.<br />
Wells, Peter, R. A. 2005. Oil supply challenges -2: What can OPEC deliver? Oil & Gas Journal, March 7.<br />
Zecca, Antonio <strong>and</strong> Luca Chiari. 2010. Fossil-fuel constraints on global warming. <strong>Energy</strong> Policy 38:<br />
1-3.<br />
Zhao, Lin, Lianyong Feng, A.S. Charles Hall. 2009. Is peakoilism coming? <strong>Energy</strong> Policy 37 (no. 6):<br />
2136-2138.
SESSION II: Geopolitical Threats to Oil Supplies<br />
threats to oil supply security*<br />
Introduction<br />
Threats to oil supply security are potentially<br />
numerous, <strong>and</strong> the discussion can only be fruitful if<br />
different kinds of threats are considered separately<br />
<strong>and</strong> the potential significance of each is assessed. It<br />
is not difficult to bundle several kinds of threats in<br />
a single, all-encompassing statement – but is this<br />
a realistic approach? Not all threats materialize<br />
at the same time, not all combine to determine<br />
catastrophic consequences.<br />
In this paper, we shall follow an analytical<br />
approach <strong>and</strong> distinguish different types of threats.<br />
The primary distinction is between geopolitical<br />
<strong>and</strong> military threats: the former are linked to<br />
political developments <strong>and</strong> the adoption or reform<br />
of policies affecting oil production <strong>and</strong> exports.<br />
The latter are linked to the use of military force or<br />
Figure 1: Major oil supply Disruptions <strong>and</strong> Price Impact<br />
Figure:1<br />
Source: <strong>Energy</strong> Information Administration, US<br />
* This paper was written by Giacomo Luciani with support from François-Loïc Henry of GRCF<br />
violence on the part of either state or non-state<br />
actors.<br />
A third section of the paper deals specifically<br />
with potential threats to oil transportation on the<br />
high seas.<br />
The literature on oil supply interruptions has<br />
developed a fairly universally accepted list of<br />
historical events that are characterized as “major<br />
disruptions.” Figure 1, from the <strong>Energy</strong> Information<br />
Administration of the US, illustrates these events.<br />
There are eight events in total considered in this<br />
figure, of which five are international conflicts, two are<br />
domestic political events, <strong>and</strong> one is a combination of<br />
the two. A slightly different listing is proposed by the<br />
International <strong>Energy</strong> Agency: 1 the IEA’s list excludes<br />
the Iranian nationalization of 1951-54, includes the<br />
Iraqi export suspension of 2001 as well as the impact<br />
1
<strong>Energy</strong> <strong>Security</strong>: Potential for EU-GCC Cooperation<br />
Figure 2: Major World oil supply Disruptions<br />
Source: International <strong>Energy</strong> Agency (IEA)<br />
of Hurricane Katrina <strong>and</strong> Rita in 2005 (certainly not<br />
a geopolitical event), <strong>and</strong> separates the Venezuelan<br />
strike from the onset of the war in Iraq.<br />
In IEA’s list we find again six international<br />
conflicts, three domestic conflicts <strong>and</strong> one event<br />
which is not geopolitical in nature but rather an Act<br />
of God (the hurricanes).<br />
Our analysis will cover these events <strong>and</strong> more in<br />
some detail, critically examining their impact <strong>and</strong><br />
probability of repetition.<br />
1. Geopolitical threats to oil security<br />
It is generally understood <strong>and</strong> accepted that<br />
geopolitical factors may negatively impact oil<br />
supplies. However, moving from this broad statement<br />
to a more precise definition <strong>and</strong> evaluation of the<br />
threat, which might offer a satisfactory basis for<br />
2<br />
discussion of potential remedies <strong>and</strong> cost-benefit<br />
analysis of adopting the same, is a much bigger<br />
challenge.<br />
We shall distinguish between resource<br />
nationalism as an ideology, which is widely believed<br />
to negatively affect oil exports, <strong>and</strong> political<br />
instability as a phenomenon that may lead to the<br />
same outcome.<br />
1.1 Key Concepts <strong>and</strong> Definitions<br />
In real life, the exact boundaries between<br />
resource nationalism, political instability, <strong>and</strong><br />
conflict are sometimes blurred.<br />
We shall include under resource nationalism all<br />
policies undertaken by the national governments<br />
of the producing country which restrict access<br />
to resources to a subset of potential players,
or create separation between the domestic<br />
<strong>and</strong> international market, or directly impose<br />
quantitative limitations on production <strong>and</strong> exports.<br />
These policies may result in lower exports either<br />
indirectly or directly.<br />
Political instability will encompass changes in<br />
policies that are the result of changes in the structure<br />
of power, i.e. in the government in place.<br />
The concept of political instability deserves<br />
separate treatment because it aims at measuring<br />
the stability of policies in the presence of changes<br />
in government.<br />
Political instability may be the outcome<br />
of constitutional processes – as it is normal in<br />
democracies – or extra-constitutional transitions,<br />
which we may group in the two main typologies<br />
of “coup d’état” <strong>and</strong> “revolution.” The case of failed<br />
states, when central government authority collapses<br />
entirely <strong>and</strong> is substituted for by generalized armed<br />
violence, may be viewed as an extreme manifestation<br />
of political instability.<br />
1.1.1 Resource nationalism<br />
The definition of resource nationalism, as given<br />
above, encompasses a wide variety of policies.<br />
Access to resources may be forbidden absolutely,<br />
on environmental or strategic grounds (an example<br />
is US restrictions on offshore drilling); or limited,<br />
delayed or otherwise hindered by the opposition of<br />
the local population or authorities, on environmental<br />
or “fair share” grounds (an example of both issues<br />
being tar s<strong>and</strong>s in Canada).<br />
More frequently, access is restricted to specific<br />
categories of players. The latter are normally<br />
national oil companies, whether government or<br />
privately owned. In most producing countries, the<br />
national oil company enjoys privileged access, either<br />
through the total exclusion of foreign companies<br />
(e.g. Mexico, Kuwait) or by forcing the latter to enter<br />
into joint ventures with the national oil company,<br />
<strong>and</strong> in some cases m<strong>and</strong>ating that the national oil<br />
companies own 50 percent or more of the equity.<br />
However, there are countries in which all national<br />
oil companies, including private companies, enjoy<br />
privileged access (this is the case of the Russian<br />
Federation, for example).<br />
Threats to Oil <strong>Supply</strong> <strong>Security</strong><br />
Secondly, access to resources may not be<br />
restricted to specific categories of players, but the<br />
development or pace of exploitation of resources<br />
may be constrained in order to conform to OPEC<br />
quota discipline or support OPEC action to manage<br />
the market – in the case of those countries that are<br />
not members of OPEC; or with a view to extending<br />
the productive life of the fields. Limits on production<br />
may be imposed on foreign companies even in cases<br />
where they enjoy equity access to oil resources, as<br />
contracts or regulations frequently impose on the<br />
operator the obligation of submitting a production<br />
plan <strong>and</strong> obtaining the approval of the relevant<br />
authorities.<br />
Thirdly, restrictions may be imposed on exports,<br />
to benefit domestic consumers <strong>and</strong> industrial users.<br />
These restrictions may take the form of export taxes;<br />
limitations of physical access to export facilities<br />
(pipelines to reach terminals, access to loading<br />
terminals); preference for domestic refineries which,<br />
in turn, may be m<strong>and</strong>ated to serve the domestic<br />
market at prices set below their international level;<br />
or simply, in the case of gas, refusal to invest in<br />
export infrastructure <strong>and</strong> <strong>project</strong>s. In other words,<br />
restrictions to exports may be the outcome of either<br />
actions or the failure to act.<br />
All the above-listed policies allow for<br />
considerable variation <strong>and</strong> flexibility in<br />
implementation. Resource nationalism, therefore,<br />
is a phenomenon that should be viewed as<br />
having ups <strong>and</strong> downs, <strong>and</strong> involves adapting to<br />
circumstances.<br />
Historically, access of international oil companies<br />
to resources has faced progressively more stringent<br />
restrictions. IOCs used to enjoy predominant access<br />
<strong>and</strong> control before 1970 but lost their position in the<br />
following decade. Changes since 1980 have not been<br />
as impressive as in the crucial decade of the 1970s.<br />
In the 1990s <strong>and</strong> early 2000s it had been predicted<br />
by some that the pendulum would swing back, <strong>and</strong><br />
international companies would be able to acquire<br />
much more direct control over reserves. This was<br />
linked to the expectation that Russia would open<br />
up <strong>and</strong> become fully accessible, <strong>and</strong> the toppling of<br />
the Saddam regime in Iraq would be instrumental<br />
in again opening the doors to that country. In fact,
<strong>Energy</strong> <strong>Security</strong>: Potential for EU-GCC Cooperation<br />
neither has happened, <strong>and</strong> if anything, we have<br />
witnessed a toughening of conditions for the IOCs.<br />
Considering that four out of five countries<br />
holding the largest reserves (Saudi Arabia, Iran,<br />
Iraq <strong>and</strong> Kuwait – roughly half of global reserves)<br />
are almost entirely off limits, major shifts in the<br />
distribution will be possible only if the policies of<br />
one or more of these countries were to change.<br />
In 2009, Iraq conducted two rounds of bidding,<br />
which led to the awarding of 10 service contracts<br />
(that is, contracts that do not offer the IOC the<br />
possibility of booking reserves) at conditions<br />
that are judged as extremely dem<strong>and</strong>ing for the<br />
companies involved. The future of these contracts is<br />
still clouded in uncertainty, but one thing is clear: for<br />
the foreseeable future, the IOCs will not have access<br />
to equity oil in Iraq.<br />
The Kuwaiti government appears to have given<br />
in to opposition from the Parliament <strong>and</strong> renounced<br />
“Project Kuwait,” which it had pursued for more than<br />
15 years; but the domestic political situation may<br />
evolve <strong>and</strong> a shift in policy may occur.<br />
Finally, Iran has sought greater involvement<br />
of the international oil companies for years <strong>and</strong><br />
blames international sanctions for the difficulties it<br />
has encountered.<br />
In short, resource nationalism may be viewed as<br />
rather normal behavior on the part of governments<br />
of oil-producing countries. It may have multiple<br />
manifestations <strong>and</strong> comes in degrees, rarely entirely<br />
excluding IOCs from access to resources. Resource<br />
nationalism is a manifestation of the fact that each<br />
producing country wishes to maximize its share<br />
of the rent <strong>and</strong> limit the companies’ share of the<br />
same. It is a market relationship in which each side’s<br />
bargaining strength shifts over time. It is a banality<br />
to say that more investment would go into finding<br />
<strong>and</strong> producing oil if governments renounced some<br />
of their share of the rent <strong>and</strong> allowed companies<br />
to get more of the same. In this sense, resource<br />
nationalism restricts oil production; but this is the<br />
outcome of producing countries protecting their<br />
interest, which is obviously their right to do.<br />
Depletion Policies<br />
4<br />
Historically, we find instances in which<br />
governments of oil-producing countries conflicted<br />
with international oil companies because they felt<br />
the latter under-exploited the resources entrusted<br />
to them, <strong>and</strong> in some cases on the other h<strong>and</strong>, overexploited<br />
them.<br />
Iraq is a clear case of a long-st<strong>and</strong>ing conflict<br />
with the international oil companies due to<br />
various sources of tension, including that the Iraqi<br />
government felt that companies were sitting on its<br />
oil resources, without adequately exploiting them.<br />
In turn, companies were not willing to invest in Iraq<br />
because of persisting conflicts on issues related<br />
to taxation <strong>and</strong> control. The Iraqi nationalization<br />
of 1973 was motivated, among other things, by<br />
the desire to significantly exp<strong>and</strong> production <strong>and</strong><br />
exports. Accordingly, Iraqi oil production grew<br />
rapidly for the rest of the 1970s, until the war with<br />
Iran broke out <strong>and</strong> production was negatively<br />
affected.<br />
In most contemporary cases, the international oil<br />
companies wish to maximize short-term production<br />
provided that good field management practices are<br />
followed – it is the local government that in some<br />
cases prefers to slow down exploitation <strong>and</strong> keep<br />
more of the oil in the ground.<br />
Saudi Arabia is the main case in point. The<br />
Kingdom has enunciated a strategy of not exceeding<br />
a production level which it may confidently maintain<br />
for a period of at least 50 years: no profit-maximizing<br />
company would consider such an extended plateau,<br />
as the discounted value of oil to be produced 50<br />
years from today is normally deemed very low.<br />
According to some statements, Saudi Arabia<br />
believes that the maximum level of production<br />
defined in this way is 15 million b/d, including<br />
some use of currently non-proven reserves. More<br />
recently, King Abdullah of Saudi Arabia instructed<br />
the national oil company not to further increase<br />
capacity, but rather to keep resources for future<br />
generations: the impact of this is not entirely clear<br />
at the time of writing.<br />
However, no other producing country has a<br />
similarly clear-cut <strong>and</strong> explicitly enunciated drawdown<br />
strategy. Most producing countries seek to<br />
increase their production <strong>and</strong> exports, while at the<br />
same time more or less respecting OPEC quotas
– but compliance with the latter is less than perfect.<br />
Outside the <strong>Gulf</strong> Cooperation Council (GCC),<br />
practically all producing countries are concerned<br />
with maximizing their production <strong>and</strong> exports <strong>and</strong><br />
adopt what they consider appropriate policies to this<br />
end. Some countries that at one stage had adopted<br />
a resource nationalist attitude later changed course<br />
<strong>and</strong> allowed international oil companies back in.<br />
Three notable cases in point are Venezuela, Algeria<br />
<strong>and</strong> Qatar. The Russian Federation may also be<br />
included in this list, if we consider the shift in policy<br />
that followed the collapse of the Soviet Union.<br />
Of these four cases of re-opening, only one has<br />
remained unaffected by further changes in policy -<br />
that is Qatar.<br />
Conclusions on Resource Nationalism<br />
In most cases, resource nationalism appears<br />
to be motivated by rent maximization. Hence, we<br />
see more restrictive policies adopted when prices<br />
are increasing, because the producing country’s<br />
government feels that whatever arrangements<br />
are in place do not allow the country to obtain its<br />
“fair share”; <strong>and</strong> at the same time the government<br />
<strong>and</strong>/or the national oil company will enjoy larger<br />
financial resources <strong>and</strong> will feel that they can<br />
undertake whatever investment is needed on their<br />
own, without recourse to IOCs. Conversely, when<br />
oil prices are low, increasing export volumes will<br />
be more important <strong>and</strong> financial resources for<br />
investment will be scarcer: the contribution of IOCs<br />
is more attractive.<br />
The range of attitudes depends primarily on<br />
structural factors rather than political or ideological<br />
inclinations. Some countries – primarily those<br />
endowed with larger reserves – find nationalist<br />
attitudes more attractive than others, while a large<br />
number of countries – notably those endowed<br />
with relatively smaller reserves – never seriously<br />
considered excluding IOCs. It may appear that some<br />
countries are prisoners of ideological limitations<br />
which they would like to shrug off but cannot<br />
(Mexico? Kuwait? Iran?). But then one should not<br />
underestimate the nationalist sentiment in domestic<br />
public opinion (Russia, Venezuela, Iraq, <strong>and</strong> Kuwait).<br />
Looking towards the future, no fundamental<br />
Threats to Oil <strong>Supply</strong> <strong>Security</strong><br />
shift is to be expected in the current pattern. Rather,<br />
there will be oscillations, with some countries<br />
opening up at times <strong>and</strong> closing off at other times,<br />
depending on circumstances such as price levels,<br />
availability of resources, need for expensive EOR<br />
technology <strong>and</strong> the like. At the same time, some<br />
countries will surely remain almost entirely closed,<br />
<strong>and</strong> others will continue to rely on IOCs, as they<br />
have done until now.<br />
In the light of recent developments in Iraq, it<br />
is likely that this crucially important country will<br />
open its doors only marginally. IOCs will be allowed<br />
to operate on the basis of production sharing<br />
agreements in the Kurdish region in North Iraq;<br />
but elsewhere in the country they will be confined<br />
to service contracts. Now that several large service<br />
agreements have been concluded, Iraqi production<br />
may well increase rapidly. Much will depend on the<br />
implementation of these agreements <strong>and</strong> on the<br />
improvement in security conditions in the country.<br />
1.1.2 Restrictions on exports<br />
Resource nationalism restricts access to<br />
resources to national players; restrictions on<br />
exports are policies through which exports of oil <strong>and</strong><br />
gas are controlled even if access to resources is not<br />
limited <strong>and</strong> IOCs are allowed to invest <strong>and</strong> operate.<br />
Generally speaking, the existence of restrictions on<br />
exports will discourage IOCs from investing in the<br />
country.<br />
Export Policies<br />
In some cases, we see countries adopting policies<br />
that simply prohibit export of hydrocarbons. This<br />
is seen most frequently in the case of natural gas<br />
– in some cases also for specific petroleum products<br />
such as gasoline – as a move to protect domestic<br />
supplies.<br />
Policies banning or restricting the export of<br />
natural gas are notable <strong>and</strong> more widespread than<br />
commonly realized. The rationale is very simple:<br />
natural gas is a resource which should be reserved<br />
to fuel national development. Countries producing<br />
both oil <strong>and</strong> gas frequently view oil as destined<br />
primarily for export, <strong>and</strong> gas as reserved for domestic<br />
consumption.
<strong>Energy</strong> <strong>Security</strong>: Potential for EU-GCC Cooperation<br />
Taxation Policies<br />
Export taxes are a tool not only to extract at least<br />
part of the rent generated by oil <strong>and</strong> gas production,<br />
but also to favor domestic consumers by creating<br />
a differential between domestic <strong>and</strong> international<br />
prices. When it comes to oil, an export tax is a very<br />
rudimentary form of taxation <strong>and</strong>, accordingly, is<br />
rarely used.<br />
The most important <strong>and</strong> widely debated case<br />
of export taxes on crude oil exports is that of the<br />
Russia Federation. Export taxes on crude oil also<br />
exist in Argentina <strong>and</strong> Vietnam. China has had an<br />
export tax on offshore oil produced by foreign joint<br />
venture partners since 2006. Kazakhstan imposed<br />
an export tax on crude oil in 2003, but abolished it as<br />
of January 2009. The Russian export duty has been<br />
identified as a disincentive to exp<strong>and</strong> production.<br />
Oil companies lack stimulus to increase production<br />
because of the high tax burden. Oil export duties<br />
are still a very important source of revenue for the<br />
Russian state treasury, providing for more than half<br />
the oil <strong>and</strong> gas revenue of the federal budget, <strong>and</strong>,<br />
therefore, about one-fifth of all budget revenues.<br />
In the longer run, it is likely that export taxes <strong>and</strong><br />
duties on crude oil will be substituted for by other,<br />
more effective <strong>and</strong> less distorting forms of taxation.<br />
Exports may be restricted because the government<br />
pursues a market intervention strategy (whatever the<br />
target of the same) <strong>and</strong> modulates exported volumes<br />
in order to achieve certain price objectives.<br />
The obvious case is collective action by OPEC<br />
to impose <strong>and</strong> modulate quotas. OPEC quotas are<br />
imposed on total production, not on exports – but<br />
in fact the determination of quota levels is primarily<br />
influenced by international market conditions <strong>and</strong><br />
accumulation of stocks, <strong>and</strong> domestic requirements<br />
are added to whatever is believed to be the optimal<br />
volumes of crude oil to be added to the market.<br />
Non-OPEC oil exporters may also place<br />
restrictions on exports in cases of severe weakness<br />
in oil prices: they are then “encouraged” to align<br />
themselves to OPEC practices either explicitly or<br />
implicitly.<br />
Domestic Pricing Policies<br />
It is very common for oil <strong>and</strong> gas producers<br />
– indeed, for a large number of developing countries<br />
– to enforce domestic prices which are lower than<br />
international prices.<br />
The problem might not exist if international prices<br />
were more stable <strong>and</strong> increased only gradually. But<br />
the wide swings <strong>and</strong> price explosions as experienced<br />
in the first half of 2008 are difficult to pass on to<br />
domestic consumers in countries which export the<br />
vast majority of their oil <strong>and</strong> gas. As hydrocarbons<br />
are generally sold by government-owned entities,<br />
increasing domestic prices will shift purchasing<br />
power from the population to the government at a<br />
time when the latter is likely to be already flush with<br />
cash.<br />
Obviously, artificially low domestic prices<br />
will tend to result in relatively higher dem<strong>and</strong>,<br />
discouraging conservation <strong>and</strong> the efficient use of<br />
energy as well as the development of alternatives.<br />
All of the above are in prominent display in many<br />
developing countries, notably the oil producers.<br />
The use of lower domestic prices as a tool<br />
for encouraging industrialization <strong>and</strong> economic<br />
diversification is, however, a separate matter <strong>and</strong><br />
is quite more defensible than enforcing low prices<br />
to the final consumer. Offering low-cost inputs is<br />
a valid <strong>and</strong> effective industrial <strong>and</strong> development<br />
policy, <strong>and</strong> has yielded excellent results. The impact<br />
of this policy on global energy supplies is minimal,<br />
<strong>and</strong> concerns about security of supply do not offer a<br />
valid reason for criticism.<br />
Conclusions on Restrictions on Exports<br />
Our analysis has shown that restrictions on<br />
exports are widespread <strong>and</strong> take multiple forms.<br />
The problem is more acute for natural gas, but<br />
domestic dem<strong>and</strong> may be favored over exports<br />
also in the case of oil <strong>and</strong> oil products. All forms<br />
of restrictions are, in a sense, a threat to security<br />
of supply, because they result in lower production<br />
<strong>and</strong> exports ceteris paribus. Depending on one’s<br />
view of available resources <strong>and</strong> of the likelihood<br />
of supplies peaking because of the physical<br />
<strong>and</strong> technological impossibility of maintaining<br />
production, the fact that production is lower than<br />
might otherwise be the case shall be considered<br />
good or bad. Some view high oil <strong>and</strong> gas prices as
a positive development, because they encourage<br />
savings <strong>and</strong> uptake of alternative sources of<br />
energy.<br />
1.1.3 Political Instability<br />
Political instability refers to government/regime<br />
change leading to changes in policy, whether brought<br />
about by constitutional or non constitutional means.<br />
It differs from conflict.<br />
Historically, it is difficult to see any fundamental<br />
difference between constitutional <strong>and</strong> non<br />
constitutional changes in government when it comes<br />
to oil <strong>and</strong> gas export policies. In the vast majority of<br />
cases, neither category leads to significant changes<br />
in oil <strong>and</strong> gas policies. However, there are a certain<br />
number of notable exceptions, which belong to both<br />
categories of constitutional <strong>and</strong> non constitutional<br />
changes:<br />
1.<br />
2.<br />
3.<br />
4.<br />
5.<br />
6.<br />
7.<br />
8.<br />
9.<br />
10.<br />
the appointment of Mohamed Mossadegh as<br />
Prime Minister in Iran<br />
the coup d’état which led to his demise <strong>and</strong> the<br />
restoration of the power of the Shah<br />
the collapse of the monarchy <strong>and</strong> the advent of<br />
General Qasim to power in Iraq<br />
the collapse of the monarchy <strong>and</strong> the advent of<br />
Colonel Muammar Qaddafi in Libya<br />
the Islamic Revolution in Iran<br />
the collapse of the Soviet Union <strong>and</strong> the coming<br />
to power of Boris Yeltsin in Russia <strong>and</strong> other post-<br />
Soviet leaders in the key oil- <strong>and</strong> gas-producing<br />
former Soviet republics (Azerbaijan, Kazakhstan,<br />
Turkmenistan)<br />
the election of Hugo Chavez in Venezuela<br />
the election of Vladimir Putin in Russia<br />
the election of Evo Morales in Bolivia<br />
the collapse of the Saddam Hussein regime in<br />
Iraq<br />
We believe that these 10 events include all major<br />
cases in which power shifts have led to major changes<br />
in oil <strong>and</strong> gas policies. Minor changes – adjustments<br />
to existing policies – occur more or less continuously,<br />
<strong>and</strong> are implemented by existing as well as new<br />
governments. Of the 10 cases listed above, four<br />
(cases #1, 7, 8 <strong>and</strong> 9) were constitutional changes,<br />
while the rest represent breaks in constitutional<br />
continuity, i.e. regime changes.<br />
Threats to Oil <strong>Supply</strong> <strong>Security</strong><br />
Of the 10 episodes, only two are considered major<br />
crises by the EIA, namely the Iranian nationalization<br />
of 1951 <strong>and</strong> the Iranian Revolution of 1978; only the<br />
latter is considered a major crisis by the IEA. Other<br />
events in the list have determined shifts in oil <strong>and</strong><br />
gas policies but in the direction of increasing, rather<br />
than reducing, oil <strong>and</strong> gas supplies (the coup against<br />
Mossadegh, <strong>and</strong> possibly the collapse of the Soviet<br />
Union).<br />
In all cases, further shifts in power <strong>and</strong><br />
consequent shifts in oil <strong>and</strong> gas policies cannot be<br />
excluded. In Russia, a swing of the pendulum back<br />
to greater involvement of the IOCs is possible, if<br />
the national companies fail to at least maintain oil<br />
<strong>and</strong> gas production levels in the face of mounting<br />
technical difficulties. A revision of policies may or<br />
may not be associated with changes in power. In<br />
the Central Asian <strong>and</strong> Caucasian republics a shift<br />
in the opposite direction is possible because of the<br />
opaque nature of many deals <strong>and</strong> outcomes that<br />
are not beyond criticism. However, it is unlikely that<br />
any change in power may lead to dramatic changes<br />
in oil <strong>and</strong> gas policies, because the countries are<br />
objectively in a difficult position <strong>and</strong> have limited<br />
alternative options.<br />
Patrimonial regimes continue to rule some of<br />
the key oil- <strong>and</strong> gas-producing countries; they have<br />
weathered well the challenges of the last decades<br />
<strong>and</strong> displayed singular durability. We believe that in<br />
all likelihood these regimes will remain very stable<br />
because they have very strong roots in society, <strong>and</strong><br />
control of the oil rent affords to them exceptionally<br />
strong tools for dealing with society’s aspirations.<br />
By all evidence, the age of frequently-repeated<br />
military coups belongs to the past <strong>and</strong> is an<br />
increasingly distant memory.<br />
However, having said that, the possibility of<br />
regime changes in some of the major oil <strong>and</strong> gas<br />
producers in the <strong>Gulf</strong> cannot be excluded. What<br />
might happen to oil <strong>and</strong> gas policies in that case?<br />
As discussed, Saudi Arabia <strong>and</strong> Kuwait remain<br />
essentially closed to IOC investment, while<br />
Abu Dhabi is open but the government closely<br />
controls the activities of foreign oil companies.<br />
Nationalization is theoretically possible in Abu<br />
Dhabi <strong>and</strong> Qatar, not in Saudi Arabia or Kuwait
<strong>Energy</strong> <strong>Security</strong>: Potential for EU-GCC Cooperation<br />
as there are no foreign companies that may be<br />
nationalized. More likely, attention will focus on<br />
export levels, <strong>and</strong> a more conservationist approach<br />
may emerge. This would be in line with the<br />
experience of Iran at the time of the revolution, <strong>and</strong><br />
with the experiences of Venezuela <strong>and</strong> Bolivia.<br />
Political change may be instrumental in<br />
provoking shifts in that direction, unless sufficient<br />
incentives exist in the global economic environment<br />
to discourage this tendency. Policy shifts in this<br />
direction are more likely to be associated with<br />
changes in power, including by constitutional means,<br />
<strong>and</strong> are frequently associated with the electoral<br />
success of populist leaders, but also may very well<br />
be associated with the passage of power from one<br />
to another member of a ruling family.<br />
The experience of Iraq since 2003 is extremely<br />
telling of prevailing trends. Notwithst<strong>and</strong>ing<br />
the collapse of the Saddam Hussein regime <strong>and</strong><br />
the occupation of the country by foreign forces,<br />
followed by the progressive empowerment<br />
of a new constitutional order amidst multiple<br />
contradictions <strong>and</strong> uncertainties, we have not<br />
witnessed the unrestrained opening of the<br />
hydrocarbons sector <strong>and</strong> the rapid build-up of<br />
production <strong>and</strong> exports that was touted by some<br />
on the eve of the coalition’s intervention. However,<br />
the situation of the Kurdish province of Iraq differs<br />
from the rest because of the profoundly different<br />
political history <strong>and</strong> the long-st<strong>and</strong>ing experience<br />
of autonomy from Baghdad.<br />
Conclusions <strong>and</strong> Indications for Scenariobuilding<br />
The analysis in this first section has shown that<br />
there is no easy <strong>and</strong> immediate connection between<br />
resource nationalism or political instability <strong>and</strong><br />
global supply of oil <strong>and</strong> gas. This is definitely not<br />
because political developments are irrelevant in<br />
influencing oil <strong>and</strong> gas supplies, but because this<br />
influence is highly variable <strong>and</strong> unpredictable.<br />
Political factors act as one of the elements<br />
which prevent the oil <strong>and</strong> gas upstream industry<br />
from behaving in a perfectly economic-rational way,<br />
optimizing supply at all times.<br />
Political circumstances may influence the gap<br />
between maximum optimal production <strong>and</strong> what is<br />
actually achieved, <strong>and</strong> let it widen or narrow down.<br />
The existence of conditions of financial stability<br />
<strong>and</strong> growth is crucially important in determining<br />
the attitude of producing countries towards the<br />
desirable level of production <strong>and</strong> exports.<br />
Similarly, expectations about the future level of<br />
oil <strong>and</strong> gas prices also influence political attitudes<br />
towards oil <strong>and</strong> gas production <strong>and</strong> exports. If the<br />
market expects that supply will grow progressively<br />
scarcer in the face of growing dem<strong>and</strong>, then the<br />
incentive to slow down production <strong>and</strong> exports<br />
is increased. The adoption of aggressive policies<br />
aimed at decarbonisation <strong>and</strong> energy efficiency may<br />
have an ambivalent effect: there may be a negative<br />
announcement effect, because producers will fear<br />
dem<strong>and</strong> destruction <strong>and</strong> invest less in exp<strong>and</strong>ing or<br />
maintaining capacity; <strong>and</strong> a positive market effect,<br />
when dem<strong>and</strong> is effectively reduced, ceteris paribus.<br />
Hence the suggestion might be not to entertain policy<br />
objectives which cannot realistically be reached <strong>and</strong><br />
emphasise cooperation <strong>and</strong> pragmatism rather than<br />
confrontation <strong>and</strong> maximalism.<br />
It has been seen that political instability <strong>and</strong><br />
resource nationalism have been rarely been<br />
associated with acute supply crises or shortfalls.<br />
Their effect is rather gradual <strong>and</strong> normally<br />
compensated by action in other parts of the system.<br />
Today, the system appears quite flexible <strong>and</strong> capable<br />
of withst<strong>and</strong>ing even important shocks, primarily<br />
thanks to excess capacity available in Saudi Arabia.<br />
But if Saudi Arabia itself were to experience severe<br />
political crises, problems may arise even today. For<br />
the longer term, the danger that capacity additions<br />
may fall systematically short of dem<strong>and</strong> increases<br />
exists <strong>and</strong> would entail a progressive fragilisation of<br />
the system.<br />
2. Domestic/International Conflicts <strong>and</strong><br />
terrorist Activities<br />
We shall distinguish between three main<br />
categories of armed conflict: 1) “classic” interstate<br />
warfare, which is fought primarily by regular armies;<br />
2) civil wars, in which armed forces from opposing<br />
sides within the same country engage in violent<br />
encounters; <strong>and</strong> 3) terrorism/b<strong>and</strong>itry.
Interstate wars involve the armed forces of<br />
two or more states, generally fighting for control<br />
of disputed territory, or engaging in occupation of<br />
enemy territory beyond what is contested in order<br />
to force the enemy’s surrender. It involves the use<br />
of the states’ armed forces: they are sometimes<br />
officially declared by the belligerents <strong>and</strong> have a<br />
clearly identifiable end in a peace treaty or at least a<br />
ceasefire of indefinite duration.<br />
Civil war is distinguished from interstate war<br />
because it is fought between forces belonging to<br />
the same state <strong>and</strong> fighting either for redefinition of<br />
that state (e.g. secession of a province) or for control<br />
of power in the state as a whole. The distinguishing<br />
feature of a civil war is that either side (or all sides, if<br />
there are more than two) controls a portion of the<br />
national territory.<br />
Terrorist activities are distinguished from a<br />
civil war because one side has no permanent <strong>and</strong><br />
continuous control of a portion of the national<br />
territory. The distinction between resistance,<br />
terrorism, <strong>and</strong> b<strong>and</strong>itry is one of motivations <strong>and</strong><br />
rights, not one of observed behavior.<br />
We shall in the rest of this paper refer to the<br />
technically preferable terminology of “violent nonstate<br />
actors” to encompass all forms of violence on<br />
the part of non-state actors who do not continuously<br />
control a portion of the state territory.<br />
As far as our discussion is concerned, this<br />
distinction is important because in a civil war the<br />
state may lose access to some oil resources, while in<br />
the case of violent non-state action, the state may<br />
not be able to avoid damage to oil installations, but<br />
maintains access to the same.<br />
2.1 Trends in Armed Conflict<br />
The frequency, duration <strong>and</strong> scope of interstate<br />
conflict have dramatically diminished. Interstate<br />
war in its classic form has today almost completely<br />
disappeared in all parts of the world, except the<br />
Middle East.<br />
In contrast, civil war <strong>and</strong> the use of violence<br />
on the part of non-state actors have continued. A<br />
majority of large-scale conflict which solicited major<br />
power intervention in the past 50-60 years originated<br />
as civil wars: Korea, Vietnam/Laos/Cambodia,<br />
Threats to Oil <strong>Supply</strong> <strong>Security</strong><br />
former Yugoslavia, Afghanistan. Other civil wars<br />
did not solicit direct major power intervention but<br />
have had significant impact nevertheless: Nigeria<br />
(Biafra), Angola, Zaire, Congo (Brazzaville), Sudan,<br />
Somalia, Lebanon, Yemen. We may also regard<br />
the intervention of the US-led coalition in Iraq as<br />
outside intervention in a civil war (the Baghdad<br />
government had in fact lost control over Northern<br />
Iraq; nevertheless, this is a sui generis case, because<br />
the opposition to Saddam was not able to operate in<br />
the rest of the country).<br />
Further detailed analysis would show that a<br />
majority of wars are fought over relatively short<br />
periods of time (the major recent exception being<br />
the Iraq-Iran war, which turned into something<br />
resembling the First World War in Europe) <strong>and</strong> then<br />
resolved either by the decisive military victory of<br />
one side (where military victory does not necessarily<br />
translate into political victory) or by forceful<br />
international pressure <strong>and</strong> intervention.<br />
We also see that domestic conflicts, sometimes<br />
leading to outside armed intervention, are primarily<br />
linked to complex historical transitions that leave<br />
unresolved issues behind. We can thus cite the<br />
process of decolonisation (in the Near East; in South<br />
<strong>and</strong> Southeast Asia; in Africa) as being a primary<br />
cause or occasion for violent domestic conflict.<br />
In most cases, a period of acute instability is<br />
followed by consolidation of existing structures <strong>and</strong><br />
eventual progressive decline of the use of violence.<br />
This process may be said to have concluded in<br />
Southeast Asia (where it has been extraordinarily<br />
costly in terms of human casualties), <strong>and</strong> conflicts<br />
have been essentially frozen elsewhere (between<br />
India <strong>and</strong> Pakistan; <strong>and</strong> in the Balkans) but a clear<br />
trend towards pacification is not visible elsewhere,<br />
notably in Sub-Saharan Africa. In the Near East,<br />
the main conflict (between Israel <strong>and</strong> its Arab<br />
neighbors) has progressively been reduced in<br />
scope, following the peace treaties signed with<br />
Egypt <strong>and</strong> Jordan, <strong>and</strong> the freezing of war with<br />
Syria. Lebanon still constitutes a problem area;<br />
otherwise, the conflict has now become a purely<br />
Israeli-Palestinian affair, into which Arab neighbors<br />
are not willing to be drawn <strong>and</strong> intervene militarily.<br />
The future of Iraq <strong>and</strong> Afghanistan also remains
<strong>Energy</strong> <strong>Security</strong>: Potential for EU-GCC Cooperation<br />
Figure 3: Crude oil exports of Iran, Iraq <strong>and</strong><br />
saudi Arabia, 1970 to 86<br />
Source: OPEC Annual Statistical Bulletin, 1987<br />
uncertain, <strong>and</strong> the intentions of Iran are not clear<br />
– claims over Bahrain keep resurfacing from time to<br />
time, although not in the form of official policy.<br />
The collapse of the Soviet Union has been<br />
another occasion for violent conflict; tensions<br />
have cooled but not disappeared. Notably, the<br />
Caucasus remains an area rife with conflict,<br />
with antagonism/hostility persisting between<br />
Azerbaijan <strong>and</strong> Armenia, Georgia <strong>and</strong> Russia, <strong>and</strong><br />
with secessionist movements in some Russian<br />
republics. At the same time, there has been<br />
some improvement in the troubled relationship<br />
between Turkey <strong>and</strong> Armenia following the visit of<br />
the Turkish President Abdullah Gul to Armenia in<br />
September 2008.<br />
2.2 Historical Experience of Oil <strong>Supply</strong><br />
Interruptions due to Conflict<br />
The lists of major oil supplies disruptions<br />
published by the EIA <strong>and</strong> the IEA concur on six armed<br />
conflict events which caused major disruptions;<br />
these are:<br />
1.<br />
2.<br />
3.<br />
4.<br />
5.<br />
6.<br />
40<br />
The Suez Crisis<br />
The Six-day war<br />
The Yom Kippur war<br />
The Iraq-Iran war<br />
The Iraqi invasion of Kuwait<br />
The US-led Coalition’s intervention in Iraq.<br />
Of these, the first two (Suez crisis <strong>and</strong> the Six-day<br />
war) affected global oil supplies primarily because<br />
the Suez canal was closed – for a short period in the<br />
first case <strong>and</strong> a much longer period in the second.<br />
In the following pages, we discuss the remaining<br />
episodes.<br />
the Iraq-Iran War (First <strong>Gulf</strong> War)<br />
The Iraq-Iran war is especially important for our<br />
analysis because it is the only historical example of<br />
an interstate war between two major <strong>Gulf</strong> producers,<br />
which was bitterly fought over an extended period<br />
of time (eight years) with very high cost in terms of<br />
human life <strong>and</strong> surprisingly limited intervention on<br />
the part of outside powers. It was, in other words,<br />
the “perfect storm” or “nightmare scenario.”<br />
Given the importance of oil as the economic<br />
<strong>and</strong> financial basis for conducting the war, it is<br />
hardly surprising that the two countries repeatedly<br />
attempted to interrupt each other’s oil exports.<br />
The remarkable fact is that both failed: exports<br />
continued at levels that, in the light of the decline<br />
in international dem<strong>and</strong> <strong>and</strong> OPEC’s attempts at<br />
rationing production, may be considered ‘normal’.<br />
All three major OPEC producers experienced<br />
very substantial decline in their production levels<br />
in response to the decline in OPEC’s overall<br />
international oil market share, rather than because<br />
of the war. If we consider the period 1970-78, we<br />
find that Iran exported on average 4.625 million<br />
barrels per day (b/d), Iraq 1.908 million <strong>and</strong> Saudi<br />
Arabia 6.525 million. The impact of the war appears<br />
to have been very significant only in 1980-81, when<br />
both Iranian <strong>and</strong> Iraqi exports were very low, while<br />
Saudi Arabia was pumping at an extraordinarily high<br />
level.<br />
In the first days of the war Iran attacked the<br />
pipelines through which Iraq exported oil to the<br />
Mediterranean across Syria <strong>and</strong> Turkey. But by the<br />
end of November 1980, Iraq had resumed exports<br />
via Turkey at an estimated level of 400,000 b/d. At<br />
the same time, Iraq also attacked Iranian export<br />
installations <strong>and</strong> caused considerable disarray, but<br />
within a month Iran was already exporting again, to<br />
the tune of 3-400,000 b/d.<br />
Overall, the experience of the war suggests that<br />
overl<strong>and</strong> oil transportation via pipelines is more<br />
resilient to attacks than maritime outlets <strong>and</strong> sea
transportation. While<br />
the Iranian oil terminal<br />
at Kharg isl<strong>and</strong> was<br />
able to continue<br />
operations (albeit far<br />
below its theoretical<br />
maximum capacity),<br />
its well-advertised<br />
air defense system<br />
could not prevent<br />
substantial damage.<br />
In fact, after the Iraq-<br />
Iran war it became<br />
clear that – short of<br />
physically occupying<br />
the wells – there is<br />
little an attacker can<br />
do to deny permanently an outlet to an enemy’s oil<br />
exports.<br />
To the very end, the Iraq-Iran war remained one<br />
between Iran <strong>and</strong> Iraq <strong>and</strong> did not turn into an arena<br />
for superpower rivalry. One explanation is that the<br />
conflict occurred at a time when oil markets were<br />
awash with crude supplies, <strong>and</strong> there never was a<br />
serious threat of shortage: it was made clear early<br />
that the supply shortfall could be made up from<br />
other sources. As events unfolded, the resilience of<br />
the oil export system became increasingly manifest.<br />
Thus, throughout the war there never was a time<br />
when the West saw its<br />
vital interest directly <strong>and</strong><br />
immediately threatened.<br />
the Iraqi Invasion of<br />
Kuwait (second <strong>Gulf</strong><br />
War)<br />
The invasion provoked<br />
the collapse of oil<br />
production in both Iraq<br />
<strong>and</strong> Kuwait, because<br />
of the immediate<br />
international reaction<br />
<strong>and</strong> the boycott of<br />
exports of both countries.<br />
Otherwise, the invasion<br />
per se did little damage<br />
Threats to Oil <strong>Supply</strong> <strong>Security</strong><br />
Figure 4: Impact of Geopolitical events on Iranian oil Production<br />
1965-2007<br />
Axis Title<br />
7,000.0<br />
6,000.0<br />
5,000.0<br />
4,000.0<br />
3,000.0<br />
2,000.0<br />
1,000.0<br />
0.0<br />
1965<br />
1967<br />
Source: OPEC<br />
Yom Kippur War<br />
Iranian Revolution<br />
Beginning<br />
of the<br />
Iran Iraq<br />
1969<br />
1971<br />
1973<br />
1975<br />
1977<br />
1979<br />
1981<br />
1983<br />
1985<br />
1987<br />
Tanker war<br />
1989<br />
1991<br />
1993<br />
1995<br />
1997<br />
1999<br />
2001<br />
2003<br />
2005<br />
2007<br />
2009<br />
Iran, I.R.<br />
to the oil installations. However, when the<br />
international coalition formed to liberate Iraq<br />
launched its offensive, the Iraqi troops set on fire<br />
more than 600 Kuwaiti oil wells: thus the major<br />
damage was done not by the hostilities per se, but by<br />
deliberate sabotage on the part of the withdrawing<br />
Iraqi troops.<br />
The war was important for its multiple lessons.<br />
Firstly, it made clear that the international<br />
community <strong>and</strong> the major Western powers (the<br />
two converged on this occasion) would not tolerate<br />
a major revision of the region’s political map.<br />
Figure 5: oil Production of Iraq <strong>and</strong> Kuwait 1990-93<br />
Source: Data BP Statistical Review of World <strong>Energy</strong>, various years<br />
41
<strong>Energy</strong> <strong>Security</strong>: Potential for EU-GCC Cooperation<br />
Secondly, the war confirmed that when modern<br />
military forces are involved <strong>and</strong> advanced weaponry<br />
is available, the conflict is likely to be short <strong>and</strong><br />
have a clear winner. Thirdly, it was shown that the<br />
only way extensive damage can be inflicted on oil<br />
installations – especially upstream oil installations<br />
– is if there is a physical military presence on the<br />
ground.<br />
the Us-led Coalition Intervention for Regime<br />
Change in Iraq (third <strong>Gulf</strong> War)<br />
Sanctions remained in place against the Saddam<br />
Hussein regime throughout the period from the<br />
withdrawal of Iraqi troops from Kuwait to the US-led<br />
invasion of Iraq in 2003. Sanctions did have an impact<br />
on the availability of crude oil to the world, <strong>and</strong><br />
there is little doubt that Iraq would have produced<br />
more than it did, had international oil companies<br />
been allowed to sign the contracts that were on<br />
offer during the 1990s. Arguably, sanctions imposed<br />
by importers have had very significant impact on<br />
oil production, much more significant than most<br />
conflicts, terrorism or “resource nationalism.”<br />
The military operation to topple the regime<br />
of Saddam Hussein began on March 20, 2003, <strong>and</strong><br />
effectively finished on April 15. On May 1, President<br />
Bush addressed the nation from the deck of the<br />
USS Abraham Lincoln claiming<br />
“mission accomplished.” The<br />
next phase, commonly<br />
7,000.00<br />
dubbed the “insurgency,” was<br />
technically a widespread<br />
6,000.00<br />
wave of violent action on the<br />
part of non-state actors, not<br />
5,000.00<br />
entirely coordinated in a single<br />
opposition force. This led to<br />
4,000.00<br />
extensive losses of human life<br />
3,000.00<br />
but also widespread sabotage<br />
of oil installations.<br />
terrorism <strong>and</strong> oil<br />
Installations in Iraq<br />
Iraq’s oil sector was a target<br />
of insurgent activity almost<br />
since the beginning of the<br />
US occupation in April 2003.<br />
42<br />
2,000.00<br />
1,000.00<br />
0.00<br />
0<br />
7<br />
9<br />
1<br />
2<br />
7<br />
9<br />
1<br />
The first recorded attack took place in mid-June<br />
2003, merely two months after the occupation of<br />
Baghdad. The oil <strong>and</strong> gas pipeline <strong>net</strong>work is the<br />
most vulnerable of Iraq’s oil infrastructure <strong>and</strong><br />
was the main target of attacks; over 280 attacks<br />
or sabotage operations were carried out between<br />
mid-2003 <strong>and</strong> 2007. Attacks were aimed at the<br />
destruction or disabling of the pipeline <strong>net</strong>work, as<br />
well as at preventing the repair or restoration of the<br />
<strong>net</strong>work. In the period 2003-2007, almost 90 attacks<br />
were carried out on oil sector personnel. As a result,<br />
Iraq’s oil sector lost between 10-15 percent of its<br />
work force.<br />
Attacks on the Iraq-Turkish pipeline rendered<br />
it non operational for a long period. Every day that<br />
this pipeline was not operational, Iraq’s economy<br />
was losing approximately $7 million. Three suicide<br />
boats attacked the Basra offshore oil export<br />
terminal. Though the terrorists failed to damage<br />
the facility, this attack alone cost the country some<br />
$40 million in lost revenue. If we consider monthly<br />
oil production data <strong>and</strong> the maximum excursion<br />
from the lowest point (January 2007) to the highest<br />
recorded production (December 2007), then we<br />
should say that security disturbances cost Iraq fully<br />
1 million b/d.<br />
Figure 6: Iran Crude oil Production<br />
y<br />
a<br />
D<br />
r<br />
e<br />
p<br />
s<br />
l<br />
e<br />
r<br />
r<br />
a<br />
B<br />
d<br />
n<br />
a<br />
s<br />
u<br />
o<br />
h<br />
T<br />
4<br />
7<br />
9<br />
1<br />
6<br />
7<br />
9<br />
1<br />
8<br />
7<br />
9<br />
1<br />
0<br />
8<br />
9<br />
1<br />
Source: BP Statistical Review of World <strong>Energy</strong>, various years<br />
2<br />
8<br />
9<br />
1<br />
4<br />
8<br />
9<br />
1<br />
6<br />
8<br />
9<br />
1<br />
8<br />
8<br />
9<br />
1<br />
0<br />
9<br />
9<br />
1<br />
2<br />
9<br />
9<br />
1<br />
4<br />
9<br />
9<br />
1<br />
6<br />
9<br />
9<br />
1<br />
8<br />
9<br />
9<br />
1<br />
0<br />
0<br />
0<br />
2<br />
2<br />
0<br />
0<br />
2<br />
4<br />
0<br />
0<br />
2<br />
6<br />
0<br />
0<br />
2<br />
8<br />
0<br />
0<br />
2
War, sanctions <strong>and</strong> Iranian Petroleum<br />
Production<br />
Estimating the effects of the war <strong>and</strong> sanctions<br />
on Iranian production is much more complicated:<br />
the Iran-Iraq war ended in 1998, <strong>and</strong> the country<br />
has been living in peace since (peace, of course, is<br />
different from entertaining good relations with the<br />
international community). Nevertheless, Iranian<br />
oil production has not recovered to anywhere near<br />
the level that it reached in 1972 <strong>and</strong> 1975. The initial<br />
decline was certainly due to the Revolution rather<br />
than the war, <strong>and</strong> was to some extent deliberate.<br />
The painful climb back to 4 mb/d may be attributed<br />
to the combination of external sanctions <strong>and</strong><br />
internal infighting, which have seriously hindered<br />
the potential for attracting outside investment. In<br />
short, the poor outcome is largely due to Iranians<br />
themselves, <strong>and</strong> is also to a large extent deliberate,<br />
the fruit of choice rather than necessity. Call it<br />
resource nationalism or simply sectarianism – war is<br />
by now too distant to offer a credible justification.<br />
other examples of oil supply Disruptions<br />
Caused by War<br />
nigeria<br />
The case of Nigeria offers a good example of<br />
the impact of civil war, <strong>and</strong> then continuing strife<br />
because of serious unresolved domestic political <strong>and</strong><br />
institutional issues, on oil production <strong>and</strong> supply.<br />
The Biafra War<br />
The war which followed the declaration of<br />
independence of Biafra from Nigeria lasted three<br />
years, from 1967 to 1970, when the south-eastern<br />
province of Biafra wanted to break apart from the<br />
country. Oil installations were affected, <strong>and</strong> the civil<br />
war had consequences on Nigerian production. In<br />
the first year of the civil war (1967), average daily<br />
production declined about 24 percent, from 417,000<br />
to 319,000 b/d. The decline continued the following<br />
year, when Nigerian production reached a minimum<br />
level of 141,000 b/d. However, in the third year of<br />
the war, production jumped <strong>and</strong> surpassed the level<br />
recorded before the war. The war ended only two<br />
years later.<br />
Threats to Oil <strong>Supply</strong> <strong>Security</strong><br />
Ethnic Conflict in the Niger Delta<br />
The end of the Biafra civil war did not solve<br />
the root causes of the problem. Ethnic tensions<br />
have continued in the region, fuelled by a sense of<br />
grievance of the local populations, who feel deprived<br />
of their “fair share” of the oil revenue. In 2003, an<br />
estimated 800,000 bpd was shut-in due to civil<br />
unrest. Since then the situation has deteriorated.<br />
In June 2008, an attack on Shell’s largest producing<br />
field, Bonga, was carried out, despite being more<br />
than 100 km offshore. Bonga is responsible for 10<br />
percent of Nigerian output, about 200,000 bpd.<br />
Nigeria risks losing a third of its oil output by 2015,<br />
unless it finds ways to boost investment in joint<br />
ventures with foreign energy companies.2 Although<br />
the Movement for the Emancipation of the Niger<br />
Delta (MEND) accepted a ceasefire in July 2009, the<br />
situation remains unclear <strong>and</strong> attacks are still to be<br />
feared.<br />
Angola<br />
The Angolan civil war lasted 27 years, from<br />
1975 to 2002. It was at the same time a war for<br />
the control of power in Angola proper <strong>and</strong> a war<br />
against the secession of the Cabinda enclave, where<br />
onshore oil production is located. The civil war has<br />
had limited impact on the progress of Angolan oil<br />
production. The production stagnated for a period<br />
roughly coinciding with the first 10 years of the civil<br />
war (1974-83). It is reasonable to conclude that in<br />
the absence of civil war Angolan production might<br />
have exp<strong>and</strong>ed earlier, but then it did increase very<br />
rapidly even during the last 17 years of civil war.<br />
sudan<br />
Sudan has known civil war almost without<br />
interruption since its independence, <strong>and</strong> still<br />
does today. Civil war has significantly hindered<br />
exploration <strong>and</strong> development of the Sudanese oil<br />
resources. Today, the major producing company in<br />
the country is China’s CNPC. The region where oil<br />
was originally discovered lies at the border between<br />
North <strong>and</strong> South Sudan, making the situation even<br />
more difficult. However, exploration is currently<br />
underway throughout the country, including in<br />
parts of Darfur, <strong>and</strong> some observers attribute the<br />
4
<strong>Energy</strong> <strong>Security</strong>: Potential for EU-GCC Cooperation<br />
second civil war <strong>and</strong> the current war in Darfur to the<br />
prospect of oil income.<br />
The Oil <strong>and</strong> Gas Journal lifted its estimate of<br />
Sudan’s reserves from 563 million barrels in 2006<br />
to 5 billion barrels in 2007. In the case of Sudan, the<br />
civil war prevented oil exports <strong>and</strong> revenue, creating<br />
conditions whereby the two sides were encouraged<br />
to reach a compromise.<br />
Algeria<br />
During the period of acute political violence<br />
that lasted from January 1992 to about 2002,<br />
attacks were overwhelmingly directed against<br />
human targets rather than economic installations.<br />
Very few attacks were recorded against oil <strong>and</strong> gas<br />
installations, in part because of their location in the<br />
desert, which makes them more easily defensible.<br />
The lowest point was reached in 1987: thereafter,<br />
Algeria began to open its doors again to international<br />
oil companies, <strong>and</strong> production increased until 1991.<br />
The period of political violence (1992-2002) coincided<br />
with a bumpy plateau in Algerian production,<br />
which does not contradict the hypothesis that the<br />
conflict did constrain production growth, even if<br />
no major attacks were launched against oil <strong>and</strong><br />
gas installations. Surely, the jump in production<br />
between 2002 <strong>and</strong> 2003 appears to indicate that the<br />
improvement of the situation allowed better use of<br />
existing resources.<br />
Conclusions on Historical experience of oil<br />
supply Interruptions Due to Armed Conflict<br />
Oil <strong>and</strong> gas installations appear to be much<br />
more resilient to armed conflict than is normally<br />
acknowledged. Major damage is inflicted only in<br />
cases in which hostilities take place in the immediate<br />
vicinity of the installation (initial phase of the Iraq-<br />
Iran war, initial phase of the Biafra war, Sudanese<br />
civil war), or one side has control of the installations<br />
<strong>and</strong> chooses to sabotage them (Iraqi troops in<br />
Kuwait, MEND in Nigeria). But this is rare. Moreover,<br />
interstate wars are a low-probability event.<br />
In contrast, civil wars’ frequency has not<br />
diminished at the global level. Historically, civil wars<br />
have caused limited damage to existing installations,<br />
but they have hindered the desired investment<br />
44<br />
in new development <strong>and</strong> attainment of target<br />
production levels.<br />
Cases in which violent action on the part of<br />
non-state actors has inflicted significant damage<br />
to existing installations include the “insurgency”<br />
phase in Iraq <strong>and</strong> MEND in Nigeria. In both cases,<br />
the relevant non-state actor was based in the same<br />
territory as the oil installations, close to population<br />
centers which the government could not control<br />
well. If oil installations are in remote or uninhabited<br />
locations – as is the case in Algeria or Angola <strong>and</strong><br />
many other countries including Saudi Arabia – then<br />
the cost-benefit balance of attacking oil installations<br />
is considerably worse for the non-state actor.<br />
However, it is very obvious that government’s<br />
inability to overcome or reabsorb violent opposition<br />
discourages international oil company investment<br />
even if the violence does not affect the vicinity<br />
of oil <strong>and</strong> gas installations; but if the expected<br />
return is large enough, <strong>project</strong>s will be undertaken<br />
nevertheless. The intensity of phenomena or<br />
the extent of the discrepancy between what is<br />
achieved <strong>and</strong> what would be optimal varies over<br />
time, justifying the need for reserve capacity<br />
<strong>and</strong> strategic stocks. But this need should not be<br />
measured against the theoretical optimum: it<br />
should be measured against the average that is<br />
normally achievable.<br />
3. scenarios of Future Conflict <strong>and</strong> their<br />
Potential Implications for oil supplies<br />
3.1 The Middle East<br />
The discussion above clearly indicates that<br />
doomsday scenarios are not justified in the light of<br />
historical experience. An interstate war involving<br />
all major oil producers in the <strong>Gulf</strong> <strong>and</strong> provoking<br />
the disappearance of all <strong>Gulf</strong> oil from the market is<br />
simply not on the cards.<br />
All interstate war episodes in the <strong>Gulf</strong> since 1980<br />
have been linked to Iraqi action <strong>and</strong> the regime<br />
of Saddam Hussein. All other <strong>Gulf</strong> nations have<br />
demonstrated a strong inclination towards avoiding<br />
conflict<br />
This is true also for the Islamic Republic of Iran,<br />
which has used proxies to engage in terrorist or
other violent attacks abroad, but has refrained from<br />
engaging its own regular forces in any regional<br />
conflict. The war with Iraq was initiated by the<br />
latter, <strong>and</strong> more recently, Iran has avoided direct<br />
intervention in Afghanistan or Iraq.<br />
The GCC member countries have never resorted<br />
to armed force – except Saudi Arabia in the context<br />
of the second <strong>Gulf</strong> war for the liberation of Kuwait.<br />
The GCC itself is primarily a pact of mutual assistance<br />
to maintain existing regimes in place. Territorial<br />
disputes <strong>and</strong> other sources of tension between GCC<br />
member countries exist, but they are very unlikely<br />
to ever lead to armed conflict.<br />
Various Iranian political figures have claimed<br />
Iranian rights over Bahrain at various points in time<br />
– although this position has never been officially<br />
supported by the Iranian government. Considering<br />
that Bahrain hosts the headquarters of the US Fifth<br />
Fleet, which patrols the <strong>Gulf</strong>, <strong>and</strong> the fact that<br />
Iranian intervention would have to come from across<br />
the sea, any scenario of Iran threatening Bahrain<br />
beyond words does not appear very plausible. In<br />
any case, Bahrain is not a major oil producer.<br />
A scenario envisaging Iranian intervention in<br />
Saudi Arabia is even less plausible. Attacks against<br />
oil facilities by aircraft are also unlikely because of<br />
superior Saudi control of the air space. In any case,<br />
such attacks are unlikely to be very effective, as the<br />
experience of the Iraq-Iran war has demonstrated,<br />
<strong>and</strong> would invite immediate retribution. Attacks<br />
with the use of missiles may be more difficult to<br />
intercept, but then they are likely to be inaccurate<br />
<strong>and</strong> would also invite immediate retribution.<br />
Notwithst<strong>and</strong>ing the very high level of<br />
expenditure on modern weapons <strong>and</strong> on the military<br />
in all <strong>Gulf</strong> States (or possibly because of it), it is very<br />
difficult to attribute significant probability to any<br />
scenario of interstate conflict between any two of<br />
the <strong>Gulf</strong> States. The worst that could be envisaged<br />
would be reciprocal air <strong>and</strong> missile attacks between<br />
Iran <strong>and</strong> Saudi Arabia, which may result in a shortfall<br />
of oil supplies to the market of the same order as<br />
during the Iranian revolution or the Iraqi invasion of<br />
Kuwait (about 5 million b/d). However, such a crisis<br />
would certainly be of short duration <strong>and</strong> would be<br />
followed by quick recovery.<br />
Threats to Oil <strong>Supply</strong> <strong>Security</strong><br />
This evaluation would not be substantially<br />
affected by Iran acquiring nuclear weapons. Using a<br />
nuclear weapon against even a critical oil installation<br />
would expose the country to very serious retaliation<br />
in exchange for very dubious benefit.<br />
In contrast to the low probability of interstate<br />
conflict, intra-state conflict is a serious <strong>and</strong> imminent<br />
danger.<br />
This remains true especially in the case of Iraq,<br />
where it is not at all clear that the country can<br />
survive as a unitary state <strong>and</strong> avoid bloody civil<br />
war(s). The status of the Kurdish provinces to the<br />
North remains highly contentious, <strong>and</strong> sectarian<br />
tensions between Sunni <strong>and</strong> Shi’a in the rest of<br />
the country are far from resolved. Continuation of<br />
domestic conflict <strong>and</strong> political uncertainty would<br />
obviously discourage needed IOC investment<br />
<strong>and</strong> further delay the development of Iraqi oil<br />
<strong>and</strong> gas resources. Considering the importance<br />
of Iraqi reserves, this is probably the single most<br />
important “threat” to <strong>European</strong> oil <strong>and</strong> gas supplies,<br />
subtracting a steady flow of the order of at least 4<br />
million b/d, if not more.<br />
Domestic conflict can certainly not be ruled<br />
out in the rest of the <strong>Gulf</strong>. The internal opposition<br />
to the Islamic Republic has become very apparent<br />
following the presidential election in June 2009,<br />
<strong>and</strong> will not evaporate. Tensions exist in all<br />
other <strong>Gulf</strong> countries, but until now regimes have<br />
proven resilient <strong>and</strong> have combined repression<br />
with accommodation in an effective blend, which<br />
greatly reduces the probability of any regime<br />
change scenario.<br />
The Iranian government is also using repression<br />
to contain the wave of discontent, but it not clear if<br />
it will be successful in recovering broader support<br />
of its people <strong>and</strong> maintaining its legitimacy. Indeed,<br />
the one country besides Iraq in which domestic<br />
conflict may lead to serious interference with oil<br />
development is Iran – although this is more likely to<br />
take the shape of strikes or non-cooperation in the<br />
oil industry than of violent conflict or sabotage.<br />
Iran may also interfere with the shipping of oil<br />
in the <strong>Gulf</strong> <strong>and</strong> through the Strait of Hormuz. It<br />
can be anticipated that any such action would be<br />
effective only in the very short run <strong>and</strong> would solicit<br />
4
<strong>Energy</strong> <strong>Security</strong>: Potential for EU-GCC Cooperation<br />
a reaction on the part of regional <strong>and</strong> international<br />
forces stationed in the <strong>Gulf</strong>.<br />
Of course, this discussion is based on the<br />
assumption that the main Western powers will<br />
remain actively engaged in <strong>Gulf</strong> security. If the<br />
United States <strong>and</strong> <strong>European</strong> forces currently<br />
present in the <strong>Gulf</strong> were to be withdrawn from the<br />
region, the strategic calculation, especially of Iran,<br />
might change. However, there is little reason why<br />
the US <strong>and</strong> <strong>European</strong> states should withdraw their<br />
presence from a region of such obvious importance<br />
to them.<br />
3.2 The Rest of the World<br />
Potential for interstate conflict still exists<br />
in several regions of the world, but some of the<br />
major cases are for countries that are not oil or gas<br />
producers (India/Pakistan, successors of former<br />
Yugoslavia) <strong>and</strong>, therefore, would have little impact<br />
on oil <strong>and</strong> gas production, besides having low<br />
probability.<br />
Concluding Considerations on Oil Production<br />
<strong>and</strong> the Threat of Armed Conflicts<br />
Evidence presented in this section <strong>and</strong> the<br />
discussion of several individual conflicts <strong>and</strong><br />
scenarios for the future point to the conclusion<br />
that the global oil <strong>and</strong> gas supply system may be<br />
much less vulnerable to conflict than is commonly<br />
assumed.<br />
The world has become a less conflict-prone place,<br />
<strong>and</strong> there is no strong reason to assume that this<br />
trend might be reversed in the coming two to three<br />
decades. Numerous domestic conflicts continue<br />
to plague certain regions, notably Sub-Saharan<br />
Africa <strong>and</strong> the Middle East, sometimes attracting<br />
armed foreign interference. However, it is difficult<br />
to propose scenarios that would have an impact on<br />
oil supplies bigger than what the world has already<br />
experienced <strong>and</strong> rather brilliantly dealt with.<br />
However, these conclusions do not justify<br />
complacency. <strong>Supply</strong> disruptions of an order<br />
comparable to those experienced in the past are<br />
possible, <strong>and</strong> the ingredients which allowed for<br />
successful dealing with the situation in the past<br />
should be maintained.<br />
4<br />
The main tool to cope with supply disruptions<br />
in the past has been the unused production<br />
capacity of major producers, notably Saudi Arabia.<br />
This remains a cornerstone of global oil security.<br />
Strategic stocks have rarely been used, but have an<br />
important deterrent effect <strong>and</strong> may turn out to be<br />
especially useful in case of a more severe crisis of<br />
short duration.<br />
4. Restrictions of Passage, Accidents <strong>and</strong><br />
oil transportation norms<br />
The logistic aspects are frequently mentioned as<br />
a source of uncertainty, generally as part of a long<br />
list of other potentially disturbing factors. In this<br />
section, we shall focus on seaborne transportation<br />
of oil <strong>and</strong> oil products <strong>and</strong> consider how oil maritime<br />
transportation logistics may affect oil supply security.<br />
There are three different dimensions to this<br />
question:<br />
1. restrictions of passage, meaning wilful<br />
2.<br />
interference with the freedom of navigation on<br />
the part of riparian or other actors, including<br />
both state <strong>and</strong> non-state actors<br />
accidents – involving one or more tankers <strong>and</strong><br />
entailing environmental or other damages<br />
which may lead to the temporary closure of<br />
international waterways<br />
3.<br />
oil transportation norms, that is rules governing<br />
navigation<br />
waterways.<br />
<strong>and</strong> passage through specific<br />
A large proportion of global oil traffic is seaborne.<br />
Approximately 50 percent of globally produced oil<br />
<strong>and</strong> a higher percentage of internationally traded<br />
oil is transported by sea.<br />
4.1 Oil Choke Points<br />
The EC Green Paper on <strong>Energy</strong> Network<br />
Assessment 3 has the following definition of choke<br />
points:<br />
“Chokepoints are narrow channels used for<br />
transit of large volumes of international sea trade<br />
including oil. The concerns related to chokepoints<br />
can be different: geopolitical in the case of transit<br />
through potentially unstable areas, environmental<br />
<strong>and</strong> in particular in relation to damage from an<br />
accident, economic if transit through a chokepoint
equires long waiting times, security in connection<br />
to possible terrorist attack etc...<br />
Chokepoints therefore represent critical<br />
bottlenecks in the energy transport <strong>net</strong>work since<br />
they transit high volumes of crude <strong>and</strong> products <strong>and</strong><br />
the impact of interruptions of transit through them<br />
would affect severely the global oil market.”<br />
Table 1: List of Choke Points<br />
Choke Points EIA<br />
EC<br />
Green<br />
Paper<br />
Hormuz X X X<br />
Malacca X X X<br />
Bab el M<strong>and</strong>ab X X X<br />
Panama Canal <strong>and</strong> Pipeline X X<br />
Suez Canal <strong>and</strong> Sumed pipeline X X X<br />
Turkish Straits X X<br />
Baltic Sea X<br />
IEA<br />
These passages are deemed especially important<br />
for global oil traffic. The International <strong>Energy</strong><br />
Agency has estimated that the share of global oil<br />
consumption that transits through Hormuz might<br />
increase from 21 percent in 2004 to 28 percent in<br />
2030, while the importance of the Strait of Malacca<br />
might be only marginally less (close to 24 percent<br />
in 2030).<br />
the <strong>Gulf</strong> Countries <strong>and</strong> the strait of Hormuz<br />
The concentration of oil reserves <strong>and</strong> production<br />
in <strong>Gulf</strong> riparian countries inevitably inflates the<br />
volume of internationally traded oil which originates<br />
in the <strong>Gulf</strong> <strong>and</strong> must transit through the Strait of<br />
Hormuz.<br />
The Strait of Hormuz is 21 nautical miles wide<br />
at its narrowest point, measured from Larak Isl<strong>and</strong><br />
(Iran) to Great Quoin (Oman). Sovereignty over<br />
the strait is divided between Iran <strong>and</strong> Oman (the<br />
Mus<strong>and</strong>am peninsula which defines the strait<br />
belongs to the latter).<br />
The obvious threat to freedom of passage<br />
through the strait comes from Iran – no one<br />
seriously considers the possibility that Oman might<br />
wish to impede passage. The potential threat of<br />
closure from Iran has been evaluated in detail by C.<br />
Talmadge. 4 The author argues that it is not in the<br />
Threats to Oil <strong>Supply</strong> <strong>Security</strong><br />
interest of Iran to close the strait as an offensive first<br />
move, as this would damage Iran itself <strong>and</strong> would<br />
certainly provoke retribution from the international<br />
community. However, “If the United States or<br />
Israel attacked Iran, the restraint that previously<br />
characterized Iranian behaviour in the strait might<br />
evaporate.”<br />
Indeed, in 2006 Iran’s supreme leader, Ayatollah<br />
Ali Khamenei, cautioned that although Iran would<br />
not be “the initiator of war,” but if the United<br />
States punished or attacked Iran, then “definitely<br />
the shipment of energy from this region will be<br />
seriously jeopardized.” More recently, statements<br />
by President Mahmoud Ahmadinejad <strong>and</strong> other<br />
qualified Iranian sources have been rather on the<br />
cautious side.<br />
The main conclusion of Talmadge’s very<br />
detailed analysis is that “the notion that Iran could<br />
truly blockade the strait is wrong — but so too is<br />
the notion that U.S. operations in response to any<br />
Iranian action in the area would be short <strong>and</strong> simple.”<br />
The key question is not whether Iran can sink dozens<br />
of oil tankers, which would be difficult. Tankers are<br />
resilient targets.<br />
The question is whether Iran can harass shipping<br />
enough to prompt U.S. intervention in defense of<br />
the sealanes.<br />
Therefore, a threat of closure of the strait, even<br />
if partial <strong>and</strong>/or limited in time to a period of several<br />
weeks is possible. “The United States’ ultimate<br />
military superiority vis-à-vis Iran is without question,<br />
<strong>and</strong> eventually the United States would prevail in<br />
any confrontation. Nevertheless, mine warfare is<br />
within Iran’s capabilities, <strong>and</strong> Iran possesses the<br />
anti-ship cruise missiles <strong>and</strong> air defence needed to<br />
make U.S. MCM operations even more difficult <strong>and</strong><br />
time-consuming than they normally are (...). Most<br />
important, Iran does not have to seal the strait<br />
entirely to provoke U.S. intervention, <strong>and</strong> once that<br />
intervention begins, the potential for further military<br />
escalation is high (...). Either way, a significant <strong>and</strong><br />
sustained increase in the price of oil would seem<br />
likely.” 5<br />
The Joint Economic Committee of the US<br />
Congress published a study on “The Strait of<br />
Hormuz <strong>and</strong> the Threat of an Oil Shock.” Rather<br />
4
<strong>Energy</strong> <strong>Security</strong>: Potential for EU-GCC Cooperation<br />
than discussing the potential for closure of the strait<br />
subsequent to military action on the part of Iran, this<br />
study assumes that this is possible <strong>and</strong> investigates<br />
the potential economic impact of such a closure. Its<br />
key conclusions are:<br />
“A closure of the Strait of Hormuz has the<br />
potential to reduce the flow of oil by far more<br />
than any previous disruption, both in absolute <strong>and</strong><br />
percentage terms. Of the 85 million barrels the world<br />
consumes each day, 20 percent passes through<br />
the Strait of Hormuz. By comparison, the Arab oil<br />
embargo of 1973, at its peak, resulted in a gross<br />
Figure 7: strait of Hormuz<br />
supply loss of 5 mbd, representing 9 percent of world<br />
oil consumption (which has increased by 28 mbd<br />
since the embargo). The cumulative oil supply loss<br />
from a Strait closure could reach the total amount<br />
of oil lost during previous oil shocks in 17 to 37 days.<br />
Nevertheless, the OECD countries have enough oil<br />
in primary inventory to last them more than eight<br />
months, should Persian <strong>Gulf</strong> oil cease to flow.” 6<br />
4<br />
In this context, it is important to underline the<br />
potential role of pipelines to allow export of <strong>Gulf</strong> oil<br />
from terminals that are outside of the <strong>Gulf</strong> <strong>and</strong> do<br />
not require transit through Hormuz.<br />
Of the five major <strong>Gulf</strong> oil exporters, three (Iran,<br />
Saudi Arabia <strong>and</strong> the UAE) have ports outside of the<br />
<strong>Gulf</strong>: Iran <strong>and</strong> the UAE on the Indian Ocean, outside<br />
of Hormuz; <strong>and</strong> Saudi Arabia on the Red Sea. Indeed,<br />
Saudi Arabia has a pipeline (known as the Petroline)<br />
with a capacity of 5 mb/d running from the Eastern<br />
province, where the oil is produced, to the Red Sea<br />
port of Yanbu, <strong>and</strong> it has been exporting crude oil<br />
<strong>and</strong> products from there since more<br />
than 20 years. 7<br />
Iraq does not have a maritime outlet<br />
outside of the <strong>Gulf</strong>, <strong>and</strong> indeed even<br />
its outlet on the <strong>Gulf</strong> is insufficient <strong>and</strong><br />
cannot accommodate very large crude<br />
carriers. For this reason, it has developed<br />
over the years several alternatives,<br />
•<br />
notably:<br />
A pipeline running from the fields in<br />
Northern Iraq across Turkey to the<br />
Mediterranean port of Ceyhan<br />
• A pipeline running from the fields<br />
in Northern Iraq across Syria to the<br />
Mediterranean port of Banias<br />
• A pipeline from the fields in Southern<br />
Iraq across Saudi Arabia to the Red Sea<br />
port of Yanbu’ (known as IPSA)<br />
The operations of all of the above<br />
have been disrupted by political <strong>and</strong>/or<br />
military interference at various times.<br />
Currently, only the pipeline to Ceyhan<br />
through Turkey is in operation, albeit at<br />
a low level (900,000 b/d currently versus<br />
an original design capacity of 1.6 million<br />
b/d).<br />
In the end, Kuwait is the only major <strong>Gulf</strong> oil<br />
exporter which at present has absolutely no<br />
alternative but to ship oil through the Strait of<br />
Hormuz.<br />
In conclusion, a threat to freedom of navigation<br />
through the Strait of Hormuz is a scenario that cannot<br />
entirely be discarded, but should be nuanced. There<br />
is universal consensus on the conclusion that, as
long as a credible commitment on the part of the US<br />
to keep the strait open exists, its closure can only be<br />
temporary. In all likelihood, it would also be partial.<br />
In any case, mitigation measures are of the utmost<br />
importance – to react to a possible emergency <strong>and</strong><br />
even more to prevent an emergency by reducing<br />
the expected benefit of closing the strait. Mitigation<br />
measures may be of a general kind, such as strategic<br />
stocks, or specific: among the latter we should in<br />
particular mention oil pipelines to loading terminals<br />
outside of the <strong>Gulf</strong>, whose use <strong>and</strong> expansion should<br />
be encouraged.<br />
other Choke Points: the Malacca strait<br />
Essentially all traffic between the Far East<br />
<strong>and</strong> points west of Singapore passes through<br />
Malacca – according to the International Maritime<br />
Organization, at least 50,000 ships sail through<br />
this strait every year – many, many more than<br />
just tankers. At its narrowest point in the Phillips<br />
Channel of the Singapore Strait, Malacca is only 1.7<br />
miles wide creating a natural bottleneck, as well as<br />
potential for collisions, grounding, or oil spills.<br />
Sovereignty over the waters of the Malacca<br />
Strait is divided between Singapore, Malaysia <strong>and</strong><br />
Indonesia. It is doubtful that any of these three states<br />
might wilfully attempt to close the strait or attack<br />
vessels transiting through them, but the possibility<br />
of attacks on the part of non-state actors – as well<br />
as of accidents with environmental consequences<br />
that would require at least temporary closure of<br />
the strait to navigation – must be considered. The<br />
Malacca Strait is frequently associated with endemic<br />
acts of piracy: we shall speak of non-state actors as a<br />
potential source of threat.<br />
When a distinction is made between different<br />
types of vessels <strong>and</strong> between local <strong>and</strong> longdistance<br />
traffic, it is shown that crude oil tankers<br />
(<strong>and</strong> LNG tankers) are among the least vulnerable<br />
categories of ships transiting the strait. Bateman<br />
et al8 recognize that “A successful terrorist attack<br />
on a crude oil tanker could cause massive economic<br />
<strong>and</strong> environmental damage” but believe that this<br />
is unlikely. Experience in the “tanker war” (during<br />
the Iran-Iraq war) demonstrated that tankers are<br />
more resilient targets than normally recognized.<br />
Threats to Oil <strong>Supply</strong> <strong>Security</strong><br />
Furthermore, “These vessels are also less vulnerable<br />
to piracy or sea robberies when underway due to their<br />
size <strong>and</strong> speed. It is virtually impossible, <strong>and</strong> certainly<br />
highly dangerous, for a small craft to attempt to get<br />
alongside such a large vessel travelling at its normal<br />
operational speed.” We should note, however, that<br />
the successful hijacking of the Saudi tanker Sirius<br />
Star off the coast of Kenya in November 2008<br />
appears to contradict this conclusion.<br />
An analysis conducted by the Institute of<br />
Defence <strong>and</strong> Strategic Studies (IDSS) in Singapore, 9<br />
confirmed that the vast majority of attacks are on<br />
the smaller, more vulnerable vessels carrying trade<br />
across the Straits or employed in the coastal trade<br />
on either side of the Straits rather than oil or LNG<br />
tankers.<br />
It is to be noted that the Lombok Strait between<br />
the isl<strong>and</strong>s of Bali <strong>and</strong> Lombok in Indonesia to access<br />
the South China Sea is a valid alternative for larger<br />
vessels.<br />
the Bab-el-M<strong>and</strong>eb<br />
Bab el M<strong>and</strong>eb is a strait located between<br />
Yemen on the Arabian Peninsula <strong>and</strong> Djibouti, north<br />
of Somalia in the Horn of Africa, <strong>and</strong> connecting the<br />
Red Sea to the <strong>Gulf</strong> of Aden. It is of importance to<br />
all tanker traffic from the <strong>Gulf</strong> to the Mediterranean,<br />
which normally includes tankers directed to North<br />
West Europe <strong>and</strong> the United States. Alternatively,<br />
this traffic can also circumnavigate Africa <strong>and</strong> very<br />
large crude carriers, which cannot pass through<br />
Suez, routinely follow this alternative route.<br />
The domestic security situation in Yemen justifies<br />
some concern. Not only has the country become a<br />
haven <strong>and</strong> redeployment base for elements linked<br />
to the al-Qaeda, but the danger of state failure<br />
<strong>and</strong> decline comparable to neighboring Somalia is<br />
real. This may well create conditions whereby nonstate<br />
actors may engage in violent action against oil<br />
targets in the strait.<br />
That said, piracy has become endemic not just<br />
in the strait but in the entire offshore area of Yemen<br />
<strong>and</strong> Somalia, reaching out to offshore Oman on one<br />
side <strong>and</strong> offshore Kenya on the other. Therefore,<br />
the issue is not specifically Bab el M<strong>and</strong>eb, but more<br />
generally security of navigation at sea in the <strong>Gulf</strong> of<br />
4
<strong>Energy</strong> <strong>Security</strong>: Potential for EU-GCC Cooperation<br />
Aden <strong>and</strong> Indian Ocean, <strong>and</strong> will be discussed in the<br />
paragraph devoted to security in the high seas.<br />
Panama<br />
Panama is not important for Europe <strong>and</strong><br />
has limited importance for oil traffic globally.<br />
Approximately 0.5 mb/d of crude oil <strong>and</strong> products<br />
transit through the Panama Canal. Large oil carriers<br />
cannot pass through the canal.<br />
suez<br />
The Suez Canal, like the Panama Canal, is not an<br />
international waterway, but a transit facility entirely<br />
controlled by Egypt. Consequently, acts of piracy<br />
or terrorism against ships in transit would indicate<br />
a severe lapse of security conditions in the country,<br />
which appears unlikely at this time. In 2008, 146.7<br />
million tons of crude oil <strong>and</strong> products transited<br />
through Suez, equal to 3 mb/d.<br />
Since the canal has no locks, the only serious<br />
limiting factors for the passage of tankers are<br />
draft <strong>and</strong> height due to the Suez Canal Bridge.<br />
The current channel depth of the canal allows for<br />
a maximum of 16 m of draft, meaning many fully<br />
laden supertankers are too deep to pass through<br />
fully laden. Improvements are envisaged so that in<br />
2010, the maximum draft will increase to 22 m, in<br />
order to allow supertankers. Until then, supertankers<br />
must discharge part of their cargo at the entry of the<br />
channel <strong>and</strong> reload it at the other end, transported<br />
along the way by the SUMED pipeline, which has a<br />
capacity of about 2.5 million bbl/d.<br />
All in all, the Suez Canal/SUMED system,<br />
notwithst<strong>and</strong>ing past interruptions, strikes the<br />
observer as being very reliable <strong>and</strong> unlikely to face<br />
interruptions.<br />
turkish straits<br />
The prospect of greatly increased tanker traffic<br />
across the Turkish Straits – in particular, the<br />
Bosphorus – has been a cause for concern for the<br />
Turkish government <strong>and</strong> international observers for<br />
years now. Natural factors include the shape of the<br />
straits, with the narrowest point in the Bosphorus<br />
no more than 700m across, numerous bends, <strong>and</strong><br />
significant currents.<br />
0<br />
Institutional factors include the fact that<br />
according to the Montreux Convention of 1936,<br />
passage through the straits is free, to the extent<br />
than even pilotage is not obligatory <strong>and</strong> no tolls are<br />
imposed. Consequently, no alternative commercial<br />
route can compete. The only cost for utilizing the<br />
Straits is the waiting time at the entrance, which of<br />
course discourages the installation of costly traffic<br />
regulation <strong>and</strong> control equipment. Environmental<br />
factors include, primarily, the consideration that<br />
the Bosphorus is today entirely encapsulated in<br />
the Istanbul urban area, <strong>and</strong> any accident would<br />
have immediate impact on a very large number of<br />
people.<br />
The number of tankers transiting the strait has<br />
reached an average of 28 per day, in excess of 10,000<br />
per year in the last three years. Tankers sometimes<br />
have had to wait for permission to transit in the<br />
southbound direction. In short, traffic congestion<br />
at the Bosphorus adds to the cost of shipping but<br />
has not reached crisis proportions. The Turkish<br />
Straits are the sole outlet for oil exported from<br />
Russia, the Caucasus <strong>and</strong> Central Asia through<br />
terminals located on the Black Sea. If the CPC is<br />
augmented as planned (1.35 mb/d by 2014), traffic<br />
through the Turkish Straits could well increase by<br />
1 mb/d – approximately 45 percent above current<br />
levels. This would certainly represent a challenge<br />
for safety of navigation through the waterway.<br />
Investing in by-pass pipelines that may<br />
drastically reduce the number of tanker passages<br />
would appear to be wise policy. There are<br />
three main pipeline <strong>project</strong>s currently on the<br />
table: the Samsun/Ceyhan <strong>project</strong> (aka TAPCO<br />
- Trans-Anatolian Pipeline Company), the Burgas/<br />
Alex<strong>and</strong>roupolis <strong>project</strong> <strong>and</strong> the Costanta/Trieste<br />
<strong>project</strong> (aka PEOP - Pan <strong>European</strong> Oil Pipeline).<br />
Baltic sea<br />
The Baltic Sea is an enclosed body of water,<br />
<strong>and</strong> an accident may have serious environmental<br />
consequences. In this, the Baltic is a case similar to<br />
the Mediterranean, only smaller <strong>and</strong>, consequently,<br />
possibly even more vulnerable. However, it is not<br />
appropriate to consider the whole sea as a choke
point. Rather, the difficulty may be defined as<br />
the passage of the Danish Straits, which is indeed<br />
very narrow. The potential for a major increase<br />
of Russian exports through the Baltic is therefore<br />
likely to raise issues for navigation through the<br />
Baltic Straits.<br />
4.2 Threats to Navigation outside Choke<br />
Points<br />
An analysis of accidents <strong>and</strong> piracy attacks to oil<br />
tankers in particular shows that the largest number<br />
of significant events took place at a considerable<br />
distance from the “choke points” inviting a<br />
consideration of conditions of shipping in a much<br />
broader spectrum of situations.<br />
We shall discuss two specific categories of<br />
threat, which have attracted considerable attention<br />
in recent times: piracy attacks <strong>and</strong> pollution from<br />
accidents.<br />
Global Piracy<br />
According to the website of the ICC International<br />
Maritime Bureau’s Piracy Reporting Centre (IMB), 10<br />
piracy attacks around the world more than doubled<br />
to 240 from 114 during the first six months of 2009<br />
compared with the same period in 2008. Confirming<br />
a trend already registered in previous months, the<br />
rise in overall numbers was due almost entirely to<br />
increased Somali pirate activity off the <strong>Gulf</strong> of Aden<br />
<strong>and</strong> east coast of Somalia, with 86 <strong>and</strong> 44 incidents<br />
reported, respectively.<br />
The IMB maintains a Live Piracy Map which<br />
records all actual <strong>and</strong> attempted attacks for the<br />
current year <strong>and</strong> the most recent four years. 11 It<br />
is evident from the map that attacks have been<br />
concentrated in three broad areas:<br />
• in the <strong>Gulf</strong> of Guinea, primarily in Nigeria, near<br />
Lagos or Port Harcourt<br />
• offshore Somalia<br />
• in the proximity of Singapore or offshore the<br />
east coast of peninsular Malaysia.<br />
In the case of Nigeria <strong>and</strong> Somalia, piracy at<br />
sea is obviously a reflection of political problems<br />
on l<strong>and</strong>. For Nigeria, the government in charge<br />
has not succeeded in curbing domestic violence:<br />
this makes external intervention touchy, as the<br />
Threats to Oil <strong>Supply</strong> <strong>Security</strong><br />
government should in principle call for outside<br />
support in combating piracy, <strong>and</strong> has not done so<br />
nor is it likely to do so. Similarly, piracy in offshore<br />
Malaysia is a problem because it is obviously the<br />
responsibility of the Malaysian government to deal<br />
with the issue.<br />
Somalia is a case of a failed state, <strong>and</strong> there is no<br />
expectation that a nonexistent Somali government<br />
may act to curb the phenomenon. It is also the most<br />
worrisome area because of the importance <strong>and</strong><br />
daring of the attacks that have been perpetrated.<br />
The most recent <strong>and</strong> extraordinary case has<br />
been the hijacking of the Saudi tanker Sirius Star<br />
450 miles off the coast of Kenya on November 17,<br />
2008: all about this event has been unprecedented:<br />
the distance from the coast, the size of the vessel<br />
(318,000 DWT, 330 m of length, one of the largest<br />
tankers in the world), the volume of oil transported<br />
(2 million barrels), the ransom that was finally paid<br />
(reportedly $3 million). Thus, the hijacking of the<br />
Sirius Star represents a turning point in the record<br />
of piracy at sea <strong>and</strong> possibly also in the international<br />
reaction to this phenomenon. Obviously, if such a<br />
large ship can be successfully attacked, all ships<br />
are vulnerable. And if an attack can take place at<br />
such a distance from the coast, the discussion of<br />
choke points is pretty much irrelevant. Preventing<br />
<strong>and</strong> combating piracy must take an entirely new<br />
dimension.<br />
the Danger of oil spills in enclosed seas<br />
According to ITOPF (International Tanker<br />
Owners Pollution Federation),12the number of<br />
medium <strong>and</strong> large size spills has greatly decreased<br />
over the years. With the decrease in numbers,<br />
the total volume of oil spills has also decreased,<br />
although data show very clearly that a few very<br />
large accidents are responsible for most of the<br />
damage – therefore even a single large accident in<br />
the future (such as the one in the <strong>Gulf</strong> of Mexico in<br />
2010) may change the picture quite radically.<br />
Limitations to freedom of navigation imposed<br />
because of environmental concerns may affect future<br />
<strong>European</strong> energy supply especially with respect to<br />
the Mediterranean Sea. The Baltic is also a problem,<br />
but much less oil transits through there. The <strong>Gulf</strong>,<br />
1
<strong>Energy</strong> <strong>Security</strong>: Potential for EU-GCC Cooperation<br />
the Red Sea <strong>and</strong> the Black Sea also are potentially<br />
highly problematic, but the “political equilibrium”<br />
between oil <strong>and</strong> environmental interests in those<br />
areas is very much more in favor of oil interests<br />
<strong>and</strong> action to limit tankers’ freedom of navigation<br />
accordingly less likely.<br />
tanker traffic in the Mediterranean<br />
A study of maritime traffic flows in the<br />
Mediterranean Sea was recently concluded by<br />
Lloyd’s Marine Intelligence Unit on behalf of<br />
REMPEC in the context of the SAFEMED <strong>project</strong><br />
sponsored by the <strong>European</strong> Commission. 13 The<br />
study asserts that the most significant change in<br />
overall traffic patterns in the Mediterranean in the<br />
coming years will be the development of export<br />
routes for crude oil from the Caspian region, which<br />
is currently shipped predominantly via Black Sea<br />
ports through the Bosphorus. North <strong>European</strong><br />
dem<strong>and</strong> for energy is likely to see an increase in<br />
LNG transits via the Mediterranean from gas fields<br />
in the Arabian <strong>Gulf</strong> <strong>and</strong> the Far East. If planned<br />
LNG terminal developments actually take place,<br />
the density of LNG tanker deployment around the<br />
Italian coastline will increase significantly.<br />
Of the three main source regions discussed<br />
subsequently by the Euromed energy ministerial<br />
conferences (Athens 2003 <strong>and</strong> Rome 2003) to<br />
develop pipeline infrastructure so as to reduce<br />
maritime transport of hydrocarbons, the prospect<br />
for pipelines from North Africa or the Middle East<br />
appear remote, because there is no experience of<br />
major sub-sea oil transport pipelines (while these<br />
are well proven for gas), <strong>and</strong> overl<strong>and</strong> pipelines<br />
would greatly increase the distance to be covered.<br />
However, in the case of crude oil from Russia <strong>and</strong> the<br />
Caspian across the Balkans, the logic is much more<br />
stringent. Nevertheless, as noted in the discussion<br />
of Turkish Straits’ bypasses, little progress towards<br />
implementation of any of these pipelines has taken<br />
place so far.<br />
Conclusion: Scenarios of <strong>Supply</strong> Interruption<br />
<strong>and</strong> Potential Remedies<br />
The general conclusion that can be drawn<br />
from this discussion is that there is no scenario of<br />
2<br />
interruption of maritime oil <strong>and</strong> gas transportation<br />
which may cause a severe physical shortage of oil, in<br />
general <strong>and</strong> specifically for Europe. Even the most<br />
problematic of cases – the attempted closure of the<br />
Strait of Hormuz – could not have the catastrophic<br />
consequences sometimes discussed: a good part<br />
of <strong>Gulf</strong> production could be evacuated from ports<br />
outside of Hormuz, <strong>and</strong> the strait is unlikely to be<br />
totally closed. Whatever disturbance to passage<br />
would not last more than two-three months. The<br />
shortage of crude oil created by such circumstances<br />
could be dealt with through draw-down of strategic<br />
stocks held by governments under the IEA program.<br />
It was also found that, in almost all cases,<br />
existing potential tensions could be easily allayed if<br />
responsible governments took the necessary steps<br />
to create alternatives, notably pipeline bypasses, or<br />
to curb illegal activities.<br />
It was argued that the main reason preventing<br />
the required investment in transportation<br />
alternatives is the lack of a well-functioning market<br />
mechanism for burden sharing. Although excessive<br />
reliance on congested straits may cause losses to<br />
individual shippers because of increased waiting<br />
time, increased insurance rates or piracy acts, this<br />
does not translate in the willingness to participate<br />
in investment which should be carried out by third<br />
parties. In most cases, the temptation of free riding<br />
prevails, <strong>and</strong> no one underwrites the required<br />
investment. Where passage must be paid for, the<br />
resulting income stream supports investment<br />
to increase capacity <strong>and</strong> accommodate growing<br />
dem<strong>and</strong>.<br />
<strong>Supply</strong> interruptions consequent to closure of<br />
major sea lanes may be addressed by the <strong>European</strong><br />
Union directly <strong>and</strong> indirectly. Directly, the EU can<br />
more forcefully pursue <strong>project</strong>s aiming at reducing<br />
vulnerabilities, such as excessive passage of tankers<br />
through the Turkish Straits. Eventually, “congestion<br />
charges” may need to be imposed, not differently<br />
from what is done in the case of private cars in<br />
central London <strong>and</strong> several other major cities.<br />
Freedom of navigation <strong>and</strong> the right to free passage<br />
cannot be sacrosanct principles to be applied in all<br />
circumstances, even where resources are objectively<br />
scarce. Indirectly, the EU could have agreements with
partner countries aiming at facilitating investment<br />
in infrastructure that may reduce vulnerabilities <strong>and</strong><br />
the danger of accidents <strong>and</strong> engage in promotion<br />
endnotes<br />
1.<br />
2.<br />
3.<br />
4.<br />
5.<br />
6.<br />
7.<br />
8.<br />
9.<br />
Threats to Oil <strong>Supply</strong> <strong>Security</strong><br />
of international compacts to enforce ever more<br />
stringent st<strong>and</strong>ards for oil, products <strong>and</strong> chemical<br />
tankers.<br />
International <strong>Energy</strong> Agency, “IEA Response System for Oil <strong>Supply</strong> Emergencies,” December 2008, 11.<br />
Financial Times, April 2008.<br />
“Network Oil Infrastructures - An Assessment of the Existing <strong>and</strong> Planned Oil Infrastructures within <strong>and</strong><br />
towards the EU,” Commission Staff Working Document accompanying the Green Paper “Towards a<br />
Secure, Sustainable <strong>and</strong> Competitive <strong>European</strong> <strong>Energy</strong>,” COM(2008) 737.<br />
Caitlin Talmadge, “Closing Time: Assessing the Iranian Threat to the Strait of Hormuz,” International<br />
<strong>Security</strong> 33, no. 1 (Summer 2008): 82–117.<br />
Talmadge, ibid.<br />
US Congress, Joint Economic Committee, “The Strait of Hormuz <strong>and</strong> the Threat of an Oil Shock”, July<br />
2007 available at http://www.house.gov/jec/studies/2007/Straight%20of%20Hormuz%20Study.pdf<br />
The pipeline has been operating at much less than its rated maximum capacity because most customers<br />
of Saudi Aramco prefer to lift from Ras Tanura in the <strong>Gulf</strong> rather than from Yanbu. Nevertheless, a<br />
study conducted for the Baker Institute of Public Policy (Ewell, Brito <strong>and</strong> Noer An Alternative Pipeline<br />
Strategy in the Persian <strong>Gulf</strong>, http://www.rice.edu/energy/publications/docs/TrendsinMiddleEast_<br />
AlternativePipelineStrategy.pdf) concluded that “the throughput of the existing pipeline system can<br />
be significantly increased with the use of drag reduction technology. As many as 11 MBD could be<br />
moved through the combined Petroline-IPSA system for an investment of $600 million. Alternately,<br />
a noticeable increase in Petroline throughput can be obtained for as little as $100 million. All options<br />
require an additional annual cost of roughly $50 million to hold DRA (drag reduction agent) inventory, or<br />
additional investment to build DRA production capacity in Saudi Arabia. The additional cost of moving<br />
oil during a crisis by this route is less than $1 per barrel. This is clearly economically feasible in the event<br />
of a SoH (Strait of Hormuz) closure; the price of oil will rise more than $1 per barrel in this case, covering<br />
the additional costs. It is just as clearly not economically viable as a routine peacetime alternative: Yanbu<br />
exports are already economically unattractive (compared to Ras Tanura) for most Saudi customers, <strong>and</strong><br />
adding DRAs would increase costs of oil at Yanbu even further.”<br />
This discussion is based on Sam Bateman, Joshua Ho <strong>and</strong> Mathew Mathai, “Shipping Patterns in the<br />
Malacca <strong>and</strong> Singapore Straits: An Assessment of the Risks to Different Types of Vessel,” Contemporary<br />
Southeast Asia 29, No. 2 (2007):309–32.<br />
Sam Bateman, Catherine Zara Raymond, Joshua Ho, Safety <strong>and</strong> <strong>Security</strong> in the Malacca <strong>and</strong> Singapore<br />
Straits — An Agenda for Action, Singapore: Institute of Defence <strong>and</strong> Strategic Studies, 2006.<br />
10. http://www.icc-ccs.org/index.php?option=com_content&view=article&id=30&Itemid=12<br />
11. The map is accessible at http://www.icc-ccs.org/index.php?option=com_fabrik&view=visualization&co<br />
ntroller=visualization.googlemap&Itemid=219<br />
12. http://www.itopf.com/<br />
13.<br />
“Study of Maritime Traffic Flows in the Mediterranean Sea” Regional Marine Pollution Emergency<br />
Response Centre for the Mediterranean Sea (REMPEC), July 2008.
<strong>Energy</strong> <strong>Security</strong>: Potential for EU-GCC Cooperation<br />
Bibliography<br />
• Aissaoui, Ali. “Algeria: The Political Economy of Oil <strong>and</strong> Gas.” OIES, Oxford 2001.<br />
• Aissaoui, Ali. “Managing Hydrocarbon Resources in a New Era: the Call from Algeria.” Oxford<br />
<strong>Energy</strong> Comment, OIES, July 2000.<br />
• Alex<strong>and</strong>ersson, Gunnar. The Baltic Straits. Martinus Nijhoff Publishers, 1982.<br />
• Algerian Ministry of <strong>Energy</strong> <strong>and</strong> Mines, http://www.mem-algeria.org/francais/index.php<br />
• Bateman, Sam, Joshua Ho <strong>and</strong> Mathew Mathai. “Shipping Patterns in the Malacca <strong>and</strong> Singapore<br />
Straits: An Assessment of the Risks to Different Types of Vessel.” Contemporary Southeast Asia 29,<br />
no. 2 (2007): 309–32.<br />
• Bateman, Sam, Catherine Zara Raymond <strong>and</strong> Joshua Ho. Safety <strong>and</strong> <strong>Security</strong> in the Malacca <strong>and</strong><br />
Singapore Straits – An Agenda for Action. Singapore: Institute of Defence <strong>and</strong> Strategic Studies, 2006.<br />
• Boué, Juan Carlos. “The Internationalisation Programme of PDVSA.” OIES, Oxford, 2004.<br />
• Boué , Juan Carlos. “Venezuela: The Political Economy of Oil.” OIES, Oxford, 1993.<br />
• Bower, Tom. Oil: Money, Politics, <strong>and</strong> Power in the 21st Century. Harper Press, 2010.<br />
• BP corporate website.<br />
• BP Official Website: “Kovykta Project” http://www.tnk-bp.com/operations/exploration-production/<br />
<strong>project</strong>s/kovykta/ last accessed May 13, 2010.<br />
• BP Statistical Review of World <strong>Energy</strong>, various years.<br />
• Center of Systemic Peace, http://www.systemicpeace.org/conflict.htm. Accessed May 15, 2010.<br />
• Chapman, Duane. “<strong>Gulf</strong> Oil <strong>and</strong> International <strong>Security</strong>: Can the World’s Only Superpower Keep the<br />
Oil Flowing?” In <strong>Energy</strong> <strong>Security</strong> <strong>and</strong> Global Politics: The Militarization of Resource Management, eds.<br />
Daniel Moran <strong>and</strong> James Russell. London, New York: Routledge, 2009.<br />
• <strong>Energy</strong> Information Administration website, http://www.eia.doe.gov/<br />
• <strong>Energy</strong> Information Administration. “World Oil Transit Chokepoints.” Country Analysis Brief,<br />
January 2008, available at http://www.eia.doe.gov/cabs/World_Oil_Transit_Chokepoints/<br />
•<br />
Background.html<br />
<strong>European</strong> Commission, “Network Oil Infrastructures - An Assessment of the Existing <strong>and</strong> Planned Oil<br />
Infrastructures within <strong>and</strong> towards the EU.” Commission Staff Working Document accompanying the<br />
Green Paper “Towards a Secure, Sustainable <strong>and</strong> Competitive <strong>European</strong> <strong>Energy</strong>.” COM (2008) 737.<br />
• Ewell, M. Webster, Dagobert Brito <strong>and</strong> John Noer, An Alternative Pipeline Strategy in the<br />
Persian <strong>Gulf</strong>, available at http://www.rice.edu/energy publications/docs/TrendsinMiddleEast_<br />
AlternativePipelineStrategy.pdf<br />
• Financial Times. “Russians Step Back from TNK-BP.” January 24, 2010. http://www.ft.com/cms/s/0/<br />
ae2a3c34-090e-11df-ba88-00144feabdc0.html<br />
• Forest, James, <strong>and</strong> Matthew V. Sousa. Oil <strong>and</strong> Terrorism in the New <strong>Gulf</strong>: Framing U.S. <strong>Energy</strong> <strong>and</strong><br />
<strong>Security</strong> Policies for the <strong>Gulf</strong> of Guinea. New York: Lexington Books, 2006.<br />
• Giroux, Jennifer, <strong>and</strong> Caroline Hilpert. “The Relationship between <strong>Energy</strong> Infrastructure Attacks<br />
<strong>and</strong> Crude Oil Prices.” Journal of <strong>Energy</strong> <strong>Security</strong>, October 2009.<br />
• Green, Mathew <strong>and</strong> Catherine Belton. “Gazprom Plans Africa Gas Grab.” Financial Times, January<br />
4, 2008.<br />
• <strong>Gulf</strong> Research Center, Dubai, various working documents.<br />
• Hanelt, C.P., G. Luciani <strong>and</strong> F. Neugart, eds. Regime Change in Iraq: the Transatlantic <strong>and</strong> Regional<br />
Dimensions. EUI <strong>and</strong> Bertelsmann Stiftung, 2004.<br />
•<br />
Heidelberg Institute for International Conflict Research. “Conflict Barometer 2010.” http://hiik.de/<br />
4
•<br />
•<br />
•<br />
•<br />
•<br />
•<br />
•<br />
•<br />
•<br />
•<br />
•<br />
•<br />
•<br />
•<br />
•<br />
•<br />
•<br />
•<br />
•<br />
•<br />
•<br />
•<br />
•<br />
•<br />
Threats to Oil <strong>Supply</strong> <strong>Security</strong><br />
en/konfliktbarometer/pdf/ConflictBarometer_2009.pdf<br />
Hertog, Steffen. “Petromin: The Slow Death of Statist Oil Development in Saudi Arabia.” Business<br />
History 50, no.5 (Autumn 2008).<br />
Ibeanu, Obey <strong>and</strong> Robin Luckham. “Nigeria Political Violence, Governance, <strong>and</strong> Corporate<br />
Responsibility in a Petro-state.” In Oil Wars, edited by Mary Kaldor, Terry Karl, Yahia Said. MacMillan,<br />
2007.<br />
International Crisis Group. “Fuelling the Niger Delta Crisis.” Africa Report no. 118 – 28 September<br />
2006.<br />
International Crisis Group. “Nigeria: Ending Unrest in the Niger Delta.” Africa Report no. 135,<br />
December 5, 2007.<br />
International Crisis Group. “The Swamps of Insurgency: Nigeria’s Delta Unrest.” Africa Report no.<br />
115, August 3, 2006.<br />
International <strong>Energy</strong> Agency. “IEA Response System for Oil <strong>Supply</strong> Emergencies.” December<br />
2008<br />
International <strong>Energy</strong> Agency. “IEA Response System for Oil <strong>Supply</strong> Emergencies 2010.”<br />
Khadduri, Walid. “Iraq: Future of the Oil Industry.” In Regime Change in Iraq: the Transatlantic <strong>and</strong><br />
Regional Dimensions edited by C. Hanelt, G. Luciani <strong>and</strong> Neugart. EUI <strong>and</strong> Bertelsmann Stiftung,<br />
2004.<br />
Khan, Sarah Ahmad. Nigeria: the Political Economy of Oil. Oxford, 1994.<br />
Liukkonen, Seppo. “Technical Requirements for Year-round Baltic Sea Tanker Traffic.” available at<br />
http://www.google.ch/search?client=opera&rls=en&q=tanker+navigation+baltic+straits&sourceid<br />
=opera&ie=utf-8&oe=utf-8<br />
Marcel, Valerie. Oil Titans. Brookings Institution Press, 2006.<br />
Maull, Hans, <strong>and</strong> Otto Pick The <strong>Gulf</strong> War: Regional <strong>and</strong> International Dimensions. London: Pinter,<br />
1989.<br />
MEES, various issues.<br />
“Middle East: History <strong>and</strong> Prospects.” Journal of World <strong>Energy</strong> Law <strong>and</strong> Business 1, no.1, 2008.<br />
Middleton, Roger. “Piracy in Somalia.” Chatham House Briefing Paper, October 2008.<br />
Ministry of <strong>Energy</strong> <strong>and</strong> Mining, Sudanese Petroleum Corporations.<br />
Ministry of Oil, State of Kuwait: http://www.moo.gov.kw/Default.aspx?pageId=198<br />
Mitchell, John, Peter Beck, <strong>and</strong> Michael Grubb. “The New Geopolitics of <strong>Energy</strong>.” Royal Institute of<br />
International Affairs, 1996.<br />
Mommer, Bernard. “Fiscal Regimes <strong>and</strong> Oil Revenues in the UK, Alaska <strong>and</strong> Venezuela.” OIES, June<br />
2001.<br />
Mommer, Bernard. “Sovereignty <strong>and</strong> Oil.” Oxford <strong>Energy</strong> Forum #50, August 2002.<br />
Moran, Daniel <strong>and</strong> James A Russell. “Introduction: The Militarization of <strong>Energy</strong> <strong>Security</strong>.” In <strong>Energy</strong><br />
<strong>Security</strong> <strong>and</strong> Global Politics: The Militarization of Resource Management, eds. Daniel Moran <strong>and</strong><br />
James Russell. London, New York: Routledge, 2009.<br />
Morris, Daniel. “The <strong>European</strong> Union’s African Oil Supplies: Secure?” Research report for the<br />
SECURE <strong>project</strong> (manuscript).<br />
O’Loughlin, John, Frank Witmer, Thomas Dickinson, Nancy Thorwardson, Edward Holl<strong>and</strong>.<br />
Eurasian Geography <strong>and</strong> Economics 48 (2) March-April 2007 http://bellwether.metapress.com/<br />
content/73t6m75244576w90/<br />
OPEC. Annual Statistical Bulletin 1987.
<strong>Energy</strong> <strong>Security</strong>: Potential for EU-GCC Cooperation<br />
•<br />
•<br />
•<br />
•<br />
•<br />
•<br />
•<br />
•<br />
•<br />
•<br />
•<br />
•<br />
•<br />
•<br />
•<br />
•<br />
•<br />
OPEC. Annual Statistical Bulletin 2008.<br />
Parra, Francisco. Oil Politics: A Modern History of Petroleum. London, New York: I.B. Tauris & Co.<br />
Ltd, 2009.<br />
Rahim, Saad. “Regional Issues <strong>and</strong> Strategic Responses: The <strong>Gulf</strong> States.” In <strong>Energy</strong> <strong>Security</strong> <strong>and</strong><br />
Global Politics: The Militarization of Resource Management edited by Daniel Moran <strong>and</strong> James<br />
Russell. London, New York: Routledge, 2009.<br />
Royal Dutch Shell corporate website.<br />
Saudi Aramco corporate website, www.saudiaramco.com<br />
Shell official website, “Gazprom, Shell, Mitsui, Mitsubishi Sign Sakhalin II Protocol.” http://www.<br />
shell.com/home/content/media/news_<strong>and</strong>_library/press_releases/2006/sakhalin_protocol_<br />
21122006.html. Accessed on May 13, 2010.<br />
Simonoff, J.S., C.E. Restrepo <strong>and</strong> R. Zimmermann. “Trends for Oil <strong>and</strong> Gas Terrorist Attacks.”<br />
Institute for Information Infrastructure Protection Research Report No. #2 November, 2005.<br />
Stevens, Paul. “Resource Nationalism <strong>and</strong> the Role of National Oil Companies in the Middle East:<br />
History <strong>and</strong> Prospects.” Journal of World <strong>Energy</strong> Law <strong>and</strong> Business 1, no. 1, (2008).<br />
“Study of Maritime Traffic Flows in the Mediterranean Sea.” Report Prepared for the Regional<br />
Marine Pollution Emergency Response Centre for the Mediterranean Sea (REMPEC). July 2008.<br />
Talmadge, Caitlin. “Closing Time: Assessing the Iranian Threat to the Strait of Hormuz.” International<br />
<strong>Security</strong> 33, no. 1 (Summer 2008): 82–117.<br />
The Uppsala Conflict Data Program, http://www.pcr.uu.se/research/UCDP/index.htm<br />
Ukiwo, Ukoha. “From ‘Pirates’ to ‘Militants’: A Historical Perspective on Anti-state <strong>and</strong> Anti-oil<br />
Company Mobilization among the Ijaw of Warri, Western Niger Delta.” African Affairs, 106/425,<br />
587–610.<br />
US Congress, Joint Economic Committee. “The Strait of Hormuz <strong>and</strong> the Threat of an Oil Shock.”<br />
July 2007, available at http://www.house.gov/jec/studies/2007/Straight%20of%20Hormuz%20Stu<br />
dy.pdf<br />
Waddams, Frank C. The Libyan Oil Industry. Johns Hopkins, 1980, 251-53.<br />
Wennman, Achim. “Breaking the ‘Conflict Trap’? Addressing the Resource Curse in Peace Processes.”<br />
Global Governance, 2010 (forthcoming).<br />
White, Matthew. Historical Atlas of the Twenty First Century. http://users.erols.com/mwhite28/<br />
20centry.htm. Accessed May 21, 2010.<br />
Yergin, Daniel. The Prize. Simon <strong>and</strong> Schuster, 1991.<br />
Consulted websites:<br />
• ICC Commercial Crime Services:<br />
• http://www.icc-ccs.org/index.php?option=com_content&view=article&id=30&Itemid=12<br />
• The International Tanker Owners Pollution Federation Limited:<br />
•<br />
http://www.itopf.com/
SESSION III: Interplay of <strong>Energy</strong> <strong>Security</strong> <strong>and</strong> Price Volatility<br />
Functioning of the International oil Markets<br />
<strong>and</strong> security Implications*<br />
Introduction<br />
<strong>Energy</strong> security is primarily a function of investment.<br />
If investment in new capacity, logistics <strong>and</strong><br />
transmission, <strong>and</strong> emergency preparedness is timely<br />
<strong>and</strong> adequate, energy security will be guaranteed.<br />
Investment in a market economy is a function<br />
of the expected revenue stream, which in turn is a<br />
function of prices. Reliable <strong>and</strong> predictable price<br />
signals are a prerequisite for adequate investment.<br />
If prices are very volatile <strong>and</strong>/or unpredictable,<br />
enterprises will not be confident enough to invest.<br />
<strong>Energy</strong> security will be imperiled.<br />
A well-functioning market is, therefore, a key<br />
component of security. Ideally, the market should<br />
generate stable <strong>and</strong> predictable prices, i.e. prices<br />
that can be modeled on the basis of structural factors<br />
within a sufficiently narrow b<strong>and</strong> to allow enterprises<br />
to have a reasonably good vision of the revenue<br />
stream that their investment might generate.<br />
The main obstacle to the security of supply of<br />
oil <strong>and</strong> gas is the growing volatility of prices <strong>and</strong><br />
their fundamental unpredictability. This leaves<br />
enterprises exposed to very high risk <strong>and</strong>, in fact, will<br />
discourage some of them. In these circumstances,<br />
it is to be expected that enterprises will tend to be<br />
conservative <strong>and</strong> underinvest.<br />
<strong>Security</strong> itself is also dependent on prices.<br />
Customers feel secure if they can buy all the energy<br />
they need at prices that they can afford. A purely<br />
physical concept of security (meaning availability<br />
of the quantities of energy that are in dem<strong>and</strong> at<br />
any moment in time) has little meaning, because<br />
dem<strong>and</strong> varies with price. There always is a price<br />
at which dem<strong>and</strong> will exactly equal supply – it may<br />
be a very high price, however, at which some final<br />
* This paper was written by Giacomo Luciani of GRCF<br />
customers may not be able to satisfy their “essential<br />
needs.” Oil, specifically, has a global market <strong>and</strong> any<br />
supply interruption that one can think of is quickly<br />
translated into higher prices, this being the key<br />
mechanism for rationing dem<strong>and</strong> <strong>and</strong> redistributing<br />
supplies among different bidders. In the end, oil is<br />
almost never physically unavailable.<br />
But even “essential needs” are a function of<br />
prices, in the sense that in the long run customers will<br />
adjust their consumption habits to the expected cost<br />
of energy <strong>and</strong> their disposable income. In the short<br />
term, such adjustments may be difficult, <strong>and</strong> what<br />
creates insecurity is the experience of price volatility,<br />
the fact of being surprised by sudden jumps in prices<br />
which were not <strong>and</strong> could not be expected.<br />
Hence, energy security is as much a matter of<br />
perception as of objective availability. Consumers<br />
make decisions on the basis of the historically<br />
prevailing level of prices: energy may be expensive or<br />
cheap – in the sense of absorbing a large or small share<br />
of their consumption basket – <strong>and</strong> their lifestyles will<br />
adjust accordingly. Lifestyles <strong>and</strong> per capita energy<br />
consumption in Europe <strong>and</strong> Japan are quite different<br />
from those prevailing in North America, because<br />
for decades energy has been relatively expensive in<br />
the former <strong>and</strong> considerably cheaper in the latter.<br />
Nevertheless, consumers in Europe <strong>and</strong> Japan are<br />
not insecure because they have to devote a larger<br />
share of their income to energy than their North<br />
American counterparts – their level of consumption<br />
has adjusted to the price environment.<br />
Well-functioning oil <strong>and</strong> gas markets, therefore,<br />
are not only a prerequisite of energy security through<br />
their influence on investment <strong>and</strong> future availability;<br />
they are a component of security, because volatile
<strong>Energy</strong> <strong>Security</strong>: Potential for EU-GCC Cooperation<br />
<strong>and</strong> unpredictable prices are part of the definition of<br />
insecurity.<br />
This paper looks at the evolution of prevailing<br />
international oil price regimes over the past decades<br />
as well as at past attempts at stabilizing prices<br />
<strong>and</strong> the reasons why they failed. This historical<br />
background is necessary to better underst<strong>and</strong> the<br />
causes of today’s growing volatility <strong>and</strong> potential<br />
remedies to the same. The current reference pricing<br />
regime will then be introduced, <strong>and</strong> the debate on<br />
the causes of increasing volatility <strong>and</strong> whether the<br />
market responds to fundamentals or is dominated<br />
by speculators will be summarized. This debate is<br />
very much underway.<br />
Next, we shall discuss the structural causes of<br />
volatility in the oil <strong>and</strong> gas markets. It is normally<br />
accepted that, even if the current market is reformed<br />
<strong>and</strong> its functioning improved, volatility can be<br />
contained but not eliminated. What institutional<br />
arrangements can we envisage which will create<br />
enough long-term convergence in prices whereby<br />
investment will be sufficient to meeting future<br />
dem<strong>and</strong>?<br />
In the concluding section, we shall discuss<br />
how this relates to other aspects of our analysis of<br />
oil security, notably the geopolitical aspects <strong>and</strong><br />
policies for strategic storage <strong>and</strong> cooperation with<br />
the exporting countries.<br />
1. A short History of oil Price Regimes<br />
Figure 1 is a very well known <strong>and</strong> widely quoted<br />
representation of oil prices in nominal <strong>and</strong> real terms<br />
since the inception of the oil industry. The figure<br />
shows that oil prices were extremely volatile in the<br />
early days of the industry because output increased<br />
suddenly whenever there was a new discovery, then<br />
declined rapidly as fields were uncontrolled due to<br />
the law of capture in the US <strong>and</strong> poor technological<br />
underst<strong>and</strong>ing of petroleum geology.<br />
The industry experienced one long stretch of<br />
stable oil prices, from the early 1920s to the early<br />
1970s: a 50-year period of progressive expansion with<br />
slowly declining prices, which was made possible by<br />
very large discoveries in the Middle East coupled<br />
with oligopolistic control on supplies by the famous<br />
seven (or eight) sisters, the major international oil<br />
companies of the time. This control – albeit slowly<br />
yet systematically eroded by “oil independents”<br />
<strong>and</strong> other newcomers – succeeded in guaranteeing<br />
the “orderly” development of capacity, in line with<br />
the rapid growth of dem<strong>and</strong>. Oil supply security<br />
was guaranteed by the seven sisters, although not<br />
necessarily at the lowest possible price to the final<br />
consumer, nor with the fairest possible distribution<br />
of financial benefits between the various parties<br />
involved.<br />
The seven sisters lost control of the oil market<br />
between 1969 <strong>and</strong> 1973. In 1969, Muammar<br />
Qaddafi seized power in Libya in a bloodless coup,<br />
overturning the Sanusi monarchy. Very soon, he<br />
nationalized some of the companies operating in<br />
the country <strong>and</strong> asked for significant concessions<br />
from the others. The nationalized companies called<br />
for a boycott of Libyan oil, as they had resorted<br />
successfully to a boycott of Iranian oil in 1950-53. But<br />
the boycott failed: Iran joined Libya in challenging<br />
the companies, <strong>and</strong> the so-called Tehran-Tripoli<br />
agreements were arrived at. But the latter were not<br />
destined to last for long: it had been proved that<br />
companies could not resist the dem<strong>and</strong>s of major oil<br />
exporters, <strong>and</strong> the balance of power in the industry<br />
shifted from the major international oil companies<br />
to the major exporting countries.<br />
The companies had unilaterally “posted” a price<br />
for the crude they were producing. The role of the<br />
posted price was primarily to calculate taxes due to<br />
the host governments, avoiding the controversies<br />
that would have arisen had “market prices” been<br />
used instead. There was, in fact, no transparent <strong>and</strong><br />
easily observed international oil market at the time.<br />
In 1973, the power of fixing posted prices shifted<br />
from the companies to the exporting countries. This<br />
opened the door to a period of intense instability<br />
in prices, starting from 1973 to 1985. Prices grew<br />
rapidly until 1980 <strong>and</strong> collapsed thereafter.<br />
Prices rose in the first sub-period because of<br />
political events: the Yom Kippur war of 1973, the<br />
Iranian Revolution of 1978-79, <strong>and</strong> the beginning<br />
of the Iraq-Iran war in 1980. Prices were pushed to<br />
historical highs, <strong>and</strong> OPEC just simply sanctioned<br />
the level that was generated by short-term panic<br />
buying <strong>and</strong> supply disruptions. Notwithst<strong>and</strong>ing the
opposition of some of its members, notably Saudi<br />
Arabia, a longer-term vision of OPEC’s interests<br />
did not prevail: no consideration was given to the<br />
danger of dem<strong>and</strong> destruction <strong>and</strong> growing non-<br />
OPEC supplies – although it was rather clear at<br />
Figure 1: Crude Oil Prices since 1861-2008<br />
US dollar per barrel<br />
World events<br />
that time that significant volumes of oil would be<br />
made available to the market from new producing<br />
provinces, notably the North Sea, Alaska <strong>and</strong><br />
Mexico.<br />
OPEC attempted to defend its posted price by<br />
cutting back on production <strong>and</strong> enforcing quotas<br />
on its members. Non-compliance eroded OPEC’s<br />
solidarity, already badly challenged by multiple<br />
conflicts between its Middle Eastern members.<br />
In 1985, Saudi Arabia ab<strong>and</strong>oned the posted<br />
price system <strong>and</strong> resorted to <strong>net</strong>back pricing. The<br />
<strong>net</strong>back price regime was short lived, lasting only<br />
about two years. It led to a collapse in crude oil<br />
prices, partly because OPEC quota discipline broke<br />
down <strong>and</strong> production increased, <strong>and</strong> partly because<br />
<strong>net</strong>back pricing tends to guarantee refiners’ margins<br />
Functioning of the International Oil Markets <strong>and</strong> <strong>Security</strong> Implications<br />
<strong>and</strong> encourages refineries to run at full capacity,<br />
flooding the market with products <strong>and</strong> eventually<br />
drawing down the <strong>net</strong>back value of the barrel.<br />
Following this came the era of reference pricing,<br />
which is the prevailing regime to date. Reference<br />
pricing means that the price of a crude oil which<br />
is not freely traded is indexed to the price of a<br />
crude oil which is freely traded, plus or minus an<br />
adjustment factor which is periodically reviewed<br />
by the producing country depending on market<br />
conditions. In this system, the producing country<br />
can manipulate the adjustment factor, but by far the<br />
major influence on the price of any non-traded crude<br />
comes from variations in the price of the benchmark<br />
crude, to which it is tied.<br />
Two markets have emerged as benchmark for<br />
all other crude oils – that is Brent in the UK <strong>and</strong><br />
WTI in the US. This regime has proven resilient in<br />
the face of political disturbances, but volatility has<br />
monotonously increased <strong>and</strong> has exploded since<br />
2007. The reason for increased volatility has been
<strong>Energy</strong> <strong>Security</strong>: Potential for EU-GCC Cooperation<br />
the progressive shift from referencing physical oil<br />
prices to referencing futures.<br />
“Initially,” writes Robert Mabro, “the marker<br />
prices were spot WTI, dated Brent, or spot ANS.<br />
The logic is that a marker price must be generated<br />
in a physical market where the transactions are<br />
sales <strong>and</strong> purchases of barrels of oil. Thus ‘marketrelated’<br />
meant a relationship to prices arising at the<br />
margin of the physical market. This conforms to a<br />
fundamental economics principle that prices are<br />
determined at the margin.” 1<br />
However, physical oil transactions became<br />
increasingly unreliable because of dwindling<br />
physical volumes <strong>and</strong> the ease with which the market<br />
could be influenced. As futures trading developed,<br />
originally as an appendix of the physical market<br />
intended to provide liquidity, but subsequently to<br />
attract trading many times in excess of that of the<br />
physical market, the balance of price discovery has<br />
shifted from physical oil to futures.<br />
We are now in the midst of a major controversy<br />
concerning whether “speculation” is “excessive,” or<br />
“investors” are simply providers of badly-needed<br />
liquidity <strong>and</strong> better equipped to judge collectively of<br />
longer- term trends. Nowadays do oil prices respond<br />
to fundamentals or to speculation?<br />
According to some, prices respond to<br />
fundamentals, <strong>and</strong> indeed “investors” or<br />
“speculators” are better judges of long-term trends<br />
than “commercial” traders, i.e. the oil companies.<br />
Throughout the 1990s, <strong>and</strong> well into the early years<br />
of this century, major international oil companies<br />
maintained that the price of oil at $18 per barrel<br />
(on average in the 1990s) was too high <strong>and</strong> would<br />
prove untenable. This opinion, it should be added,<br />
shaped the major companies’ investment policies,<br />
leading to very conservative investment decisions<br />
<strong>and</strong> a preference for mergers <strong>and</strong> acquisitions over<br />
greenfield development of new <strong>project</strong>s.<br />
Against this view, a current of opinion insisted<br />
that oil is finite, <strong>and</strong> production will inevitably peak.<br />
Various versions of the peak oil theory have been<br />
proposed at different times, <strong>and</strong> heated controversy<br />
has characterized this debate.<br />
The futures market signaled a tendency to an<br />
increase already in 2002 <strong>and</strong> early 2003. Prices<br />
0<br />
had risen already in 2000, but this spike had been<br />
deemed untenable by a majority of experts. And in<br />
early 2003 the expectation was that prices would<br />
again fall, following the US <strong>and</strong> allies’ intervention<br />
for regime change in Iraq, which would lead to an<br />
increase in Iraqi production <strong>and</strong> exercise pressure on<br />
OPEC.<br />
Instead, 2004 saw an unexpected increase in<br />
dem<strong>and</strong> <strong>and</strong> further price increases. The futures<br />
market signaled a tendency towards higher prices<br />
through a persistent contango, which at the time<br />
was deemed unjustified. The market was signaling<br />
its fundamental belief that oil would become<br />
relatively scarce, due to dem<strong>and</strong> increasing faster<br />
than supplies. This is not the same as necessarily<br />
expecting a peak: all that is required is an expectation<br />
that supply will grow more slowly than dem<strong>and</strong>.<br />
Today, most experts would agree that the market<br />
was right, <strong>and</strong> preachers of low oil prices had been<br />
wrong.<br />
However, in 2007 <strong>and</strong> even more so in 2008<br />
the market was shaken by such violent swings<br />
that it is impossible to find a rational justification<br />
for fundamentals’ shifts. There was no dramatic<br />
dem<strong>and</strong> increase or supply restriction to justify the<br />
doubling of prices between the beginning of 2008<br />
<strong>and</strong> July of the same year, followed by a dramatic<br />
collapse in the latter part of the year. Such swings<br />
can only be understood as part of the turbulence<br />
which hit financial markets, of which today’s<br />
futures oil market is part <strong>and</strong> parcel. The price<br />
of oil is therefore highly exposed to the vagaries<br />
<strong>and</strong> disequilibria of the financial markets <strong>and</strong> has<br />
ceased to send a useful signal to corporate decisionmakers<br />
for the purpose of sanctioning long-term<br />
investment.<br />
From the point of view of security of supply, if all<br />
that a major disruption can cause is a major swing in<br />
oil prices, but the same kind of swing can happen also<br />
in the absence of a major physical disruption: then<br />
what is the point of worrying about disruptions?<br />
Obviously, it is necessary to address the issue<br />
of price stability, <strong>and</strong> especially of convergence<br />
of prices towards a long-term value which may be<br />
credibly used for investment decisions.
2. structural Causes of oil Price Instability<br />
Oil prices, like the prices of most commodities,<br />
are unstable because of well-understood structural<br />
causes.<br />
Firstly, upfront investment is the key cost<br />
component, while direct costs are relatively less<br />
important. This means that once the investment<br />
is made <strong>and</strong> the capacity created, it will be utilized<br />
even if prices fall well below the break-even point.<br />
It is only if prices fall below direct costs that the<br />
producer will consider shutting capacity, <strong>and</strong> even<br />
then it may be costly (in terms of immediate costs or<br />
forfeited long term revenue) to shut in capacity.<br />
Secondly, investment<br />
gestation times are very long.<br />
For a while, the industry boasted<br />
that it was able to go from<br />
discovery to early production<br />
in a much shorter time than in<br />
the past, but a few exceptional<br />
examples in the offshore of the<br />
<strong>Gulf</strong> of Guinea have since been<br />
overshadowed by numerous<br />
disaster stories – from the <strong>Gulf</strong><br />
of Mexico to Sakhalin passing<br />
through Kashagan. Whether it<br />
is field development, pipeline<br />
construction, or refinery<br />
construction, this is an industry<br />
in which five to 10 years easily<br />
pass from the moment the investment is sanctioned<br />
to the moment it becomes operational. For all<br />
practical purposes, this means that investment is<br />
made with little or no knowledge of the returns it<br />
will bring when it becomes operational. True, the<br />
futures market can mitigate this risk <strong>and</strong> offers<br />
contracts <strong>and</strong> derivatives several years into the<br />
future, but liquidity at such distant maturities is thin<br />
<strong>and</strong> the feasibility of massive hedging of investment<br />
is problematic. In fact, very few major <strong>project</strong>s<br />
are financed with risk mitigation from the futures<br />
market.<br />
Thirdly, <strong>and</strong> most importantly, both dem<strong>and</strong><br />
<strong>and</strong> supply are rigid in the short term. Exhibit 1<br />
reproduces a slide used by Christopher Allsopp<br />
<strong>and</strong> Bassam Fattouh in a presentation given to<br />
Functioning of the International Oil Markets <strong>and</strong> <strong>Security</strong> Implications<br />
Exhibit 1: Oil Dem<strong>and</strong> Price Elasticity<br />
the Bank of Engl<strong>and</strong> in June 2008. 2 It summarizes<br />
different measures of price elasticity of oil dem<strong>and</strong><br />
estimated by various authors at different times.<br />
Short-term price elasticity has consistently been<br />
found to be very low, in fact very close to zero. Longterm<br />
elasticity is more significant, being estimated<br />
in a range of .5-.6 for the OECD countries <strong>and</strong><br />
much lower for the developing countries. Finally,<br />
authors that have repeated the estimation over<br />
time have found that price elasticity is declining<br />
– a consequence of the fact that oil has been<br />
largely substituted by other fuels in uses in which<br />
substitution was easy.<br />
Source: Christopher Allsopp <strong>and</strong> Bassam Fattouh, “Oil Prices: Fundamentals<br />
or Speculation?” (presentation at the Bank of Engl<strong>and</strong>, June 13, 2008)<br />
Exhibit 2 shows that the income elasticity of oil<br />
dem<strong>and</strong> is higher than the price elasticity, meaning<br />
that oil dem<strong>and</strong> can effectively be curbed only by<br />
reducing disposable income, i.e. through a recession.<br />
The very high income elasticity of dem<strong>and</strong> in the<br />
developing countries means dem<strong>and</strong> for oil tends to<br />
grow more rapidly than GDP in those countries.<br />
Finally, Exhibit 2 indicates that price elasticity<br />
of non-OPEC oil supply is also low – a reflection<br />
of the points mentioned above about investment<br />
being the main cost component <strong>and</strong> requiring long<br />
gestation. Of course, OPEC supply is considered a<br />
political variable, <strong>and</strong> it is exp<strong>and</strong>ed or contracted<br />
depending on the organization’s price target <strong>and</strong><br />
perception of market conditions – no structural<br />
elasticity can be measured.<br />
Source: Christopher Allsopp <strong>and</strong> Bassam Fattouh, “Oil Prices: Fundamentals<br />
or Speculation?” (presentation at the Bank of Engl<strong>and</strong>, June 13, 2008)<br />
1
<strong>Energy</strong> <strong>Security</strong>: Potential for EU-GCC Cooperation<br />
2<br />
Source: Christopher Allsopp <strong>and</strong> Bassam Fattouh, “Oil Prices: Fundamentals<br />
or Speculation?” (presentation at the Bank of Engl<strong>and</strong>, June 13, 2008)<br />
Exhibit 2: Oil Dem<strong>and</strong> Income Elasticity<br />
Source: Christopher Allsopp <strong>and</strong> Bassam Fattouh, “Oil Prices: Fundamentals<br />
or Speculation?” (presentation at the Bank of Engl<strong>and</strong>, June 13, 2008)<br />
The combination of rigid dem<strong>and</strong> <strong>and</strong> rigid<br />
supply means that price signals generated by the<br />
market are not very effective in balancing dem<strong>and</strong><br />
<strong>and</strong> supply. Or, conversely, it means that even<br />
very small shifts in the balance between dem<strong>and</strong><br />
<strong>and</strong> supply will provoke large changes in prices. In<br />
essence, this market can be truly balanced only<br />
through income <strong>and</strong> investment adjustments, which<br />
are slow <strong>and</strong> generally considered unwelcome. After<br />
all, the purpose of energy security is to maintain<br />
income <strong>and</strong> consumption levels, <strong>and</strong> concluding that<br />
dem<strong>and</strong> <strong>and</strong> supply can only be balanced through<br />
declining income levels defeats the purpose.<br />
Any discussion of the functioning of the<br />
international oil market in view of fostering security<br />
must therefore acknowledge that in the short term<br />
dem<strong>and</strong> <strong>and</strong> supply are unlikely to be exactly in<br />
balance, <strong>and</strong> this will cause wide swings in prices.<br />
The challenge is to aim at achieving a better balance<br />
of dem<strong>and</strong> <strong>and</strong> supply in the longer term, so that<br />
short-term price swings may be understood as<br />
oscillations around a central value which is the longterm<br />
equilibrium price.<br />
The search for a long-term equilibrium price<br />
is further complicated by our poor underst<strong>and</strong>ing<br />
of the dynamics of both dem<strong>and</strong> <strong>and</strong> supply.<br />
Concerning supply, the most frequent procedure<br />
is attempting to estimate non-OPEC supply <strong>and</strong><br />
calculating the requirement for OPEC supply as the<br />
difference between <strong>project</strong>ed<br />
global dem<strong>and</strong> <strong>and</strong> <strong>project</strong>ed<br />
non-OPEC supplies. However,<br />
estimates of non-OPEC supplies<br />
turn out to be significantly off the<br />
mark even at very short horizons,<br />
such as one year or less. This<br />
is all the more surprising since<br />
at such short time horizons we<br />
know very well which fields are in<br />
production <strong>and</strong> how they behave,<br />
<strong>and</strong> precious few surprises would<br />
seem to be possible. Instead,<br />
estimates of non-OPEC supplies<br />
are almost invariably off the<br />
mark, <strong>and</strong> for the past few years<br />
they have been systematically in<br />
excess of recorded production.<br />
The lack of success in predicting dem<strong>and</strong> is, in<br />
a sense, even more surprising – because here we<br />
are dealing with literally billions of decision-makers,<br />
whose aggregate behavior should be statistically<br />
predictable. In contrast, dem<strong>and</strong> forecasts for any<br />
one year are constantly adjusted <strong>and</strong> by significant<br />
margins as the year progresses, <strong>and</strong> in the end<br />
the distance from the original expectation to the<br />
recorded result can easily be of the order of 1 to 2 per<br />
cent. With .05 price elasticity of dem<strong>and</strong>, this alone<br />
justifies a 20 percent swing in prices.<br />
Thus, at any point in time, we really have very little<br />
confidence about future dem<strong>and</strong> <strong>and</strong> supply, <strong>and</strong><br />
such lack of confidence fundamentally contributes<br />
to the perception of insecurity about energy supply.<br />
Today, the International <strong>Energy</strong> Agency (IEA)<br />
estimates that investment is insufficient, <strong>and</strong> as<br />
soon as the global economy recovers, the price of<br />
oil will again tend to increase rapidly. Fatih Birol has<br />
gone on record asserting that this will limit global<br />
growth unless investment is increased promptly. In<br />
turn, this expectation is influencing “investors” (or<br />
“speculators”) <strong>and</strong> justifies the high prices in the back<br />
end of the futures curve, which in turn are believed<br />
to be the reason why even front end future prices are<br />
relatively high, notwithst<strong>and</strong>ing the market is flush<br />
with oil. In this world, expectations become reality<br />
<strong>and</strong> have greater influence on prices than actual
Exhibit 3: <strong>Supply</strong> Response<br />
Source: Christopher Allsopp <strong>and</strong> Bassam Fattouh, “Oil Prices: Fundamentals<br />
or Speculation?” (presentation at the Bank of Engl<strong>and</strong>, June 13, 2008)<br />
dem<strong>and</strong> <strong>and</strong> supply. But corporate decision-makers<br />
are not convinced that prices will stay high: they see<br />
that supply is abundant <strong>and</strong> read that the recovery<br />
will be slow – so is this the right time to invest?<br />
3. structural Changes in the supply of<br />
Liquid Fuels<br />
In the search for a longer-term equilibrium price<br />
for investment, we may have our task facilitated by<br />
some important changes which are occurring in the<br />
international oil industry.<br />
Conventional crude oil is no longer the sole<br />
source of liquid fuels. Non-conventional sources will<br />
become increasingly important, <strong>and</strong> the common<br />
feature of non conventional sources is that they<br />
are primarily industrial processes in which output<br />
is much more easily predictable as a function of<br />
investment. The timing <strong>and</strong> production profile over<br />
time also are much more easily predictable.<br />
Conventional oil is the realm of uncertainty.<br />
Exploration may or may not be successful, <strong>and</strong> a<br />
discovery may be a giant or a small field. Resources<br />
in place are never exactly known, <strong>and</strong> reserves<br />
estimates are constantly updated, generally<br />
towards an increase, but sometimes in the direction<br />
of a decrease. The time required for developing a<br />
field <strong>and</strong> the development cost per barrel of added<br />
capacity vary widely across the spectrum <strong>and</strong> are<br />
not always exactly predictable (Kashagan will serve<br />
Functioning of the International Oil Markets <strong>and</strong> <strong>Security</strong> Implications<br />
as an example for a long time).<br />
Finally, production from a field<br />
generally reaches a plateau rather<br />
quickly, but it is not easy to know<br />
for how long the plateau will last<br />
<strong>and</strong> how rapid the decline might<br />
be thereafter.<br />
In contrast, most<br />
unconventional <strong>project</strong>s are much<br />
more predictable. The availability<br />
of the resource is not in question,<br />
be it oil s<strong>and</strong>s, Orinoco bitumen<br />
or oil shale: in fact the available<br />
resource is so much greater than<br />
what is used, as to be practically<br />
infinite. The difficulty is in the cost<br />
of the investment, with relatively<br />
minor operational issues involved – even the<br />
technology is not very dem<strong>and</strong>ing. At the time the<br />
investment is sanctioned, the investor knows with<br />
considerable precision what output he will get from<br />
the <strong>project</strong>, <strong>and</strong> this output will be sustained for the<br />
life of the equipment. In this sense, non-conventional<br />
oil <strong>project</strong>s are much closer to a factory than to a<br />
mining operation, although they are a combination<br />
of the two. The limiting factor is the transformation<br />
capacity, not the availability of the raw material.<br />
This is all the more true for gas to liquids or coal to<br />
liquids <strong>project</strong>s, which are essentially petrochemical<br />
ventures.<br />
The incremental capacity obtained through<br />
investment in non-conventional oil <strong>project</strong>s is<br />
relatively small relative to the investment – <strong>and</strong><br />
relative to global supply of crude oil. There is little<br />
danger that a sudden rush of non-conventional<br />
<strong>project</strong>s will cause an unexpected increase in supply<br />
<strong>and</strong> a collapse in prices, which may undermine<br />
investment. Output increases from non-conventional<br />
<strong>project</strong>s will be gradual <strong>and</strong> very predictable.<br />
As for conventional oil, predictability may<br />
also increase because the frequency of very large<br />
discoveries has dwindled to almost zero, while<br />
the number of declining provinces is increasing.<br />
The probability of a sudden increase in capacity,<br />
therefore, is very low.<br />
As declining fields become a growing share
<strong>Energy</strong> <strong>Security</strong>: Potential for EU-GCC Cooperation<br />
of total oil reserves, the importance of enhanced<br />
oil recovery (EOR) will increase. The effects of<br />
implementing EOR on declining fields cannot<br />
exactly be predicted, but the connection between<br />
investment <strong>and</strong> increased capacity is much tighter<br />
than with conventional methods. Also, as EOR<br />
methods are more widely adopted, the weight of<br />
direct costs over investment costs may increase (this<br />
depends on the specific EOR technology adopted),<br />
<strong>and</strong> investment <strong>and</strong> production may become more<br />
responsive to prices.<br />
From the dem<strong>and</strong> side, it is not clear whether<br />
the development of alternatives to the use of fossil<br />
liquid fuels may increase or decrease price elasticity.<br />
As mentioned earlier, the evidence appears to be<br />
that concentration of oil in those uses in which it is<br />
most difficult to substitute has further decreased<br />
elasticity. However, the appearance of alternatives<br />
in the transportation sector may generate greater<br />
responsiveness in dem<strong>and</strong>, if the consumer has<br />
– directly or indirectly – the possibility of switching<br />
from one fuel or source of energy (or mode of<br />
transportation) to a different one.<br />
4. Containing Price Volatility<br />
In the light of extreme price fluctuations since<br />
2007, the attention of politicians <strong>and</strong> experts has<br />
been drawn toward the need to dampen short-term<br />
fluctuations <strong>and</strong> achieve greater reliability of prices.<br />
The pendulum has swung back from the<br />
extreme position that advocated exclusive reliance<br />
on unregulated markets as optimal to a position<br />
advocating reining in of speculators <strong>and</strong> pursuit of a<br />
“fair for all” price. 3<br />
The experience of the oil price yo-yo of 2007-<br />
2009 has been sufficiently traumatic to lead to the<br />
emergence of a degree of political consensus on<br />
the need to dampen volatility <strong>and</strong> agree on a price<br />
that may be acceptable to all sides. Expressions of<br />
concern have been voiced not only by the major<br />
OPEC exporters but also by leaders of the major<br />
industrialized countries, notably former British Prime<br />
Minister Gordon Brown, French President Nicholas<br />
Sarkozy 4 <strong>and</strong> US President Barack Obama. It has been<br />
said that a consensus may be emerging to the extent<br />
that a “fair” price might be in the region of $65-80/b.<br />
4<br />
On the basis of this impression, the proposal<br />
has been put forward to establish an international<br />
committee that would decide on prices 5 or a price<br />
b<strong>and</strong>, 6 similar to what happens with interest rates<br />
(at the national level, though). But how would such a<br />
consensus be implemented <strong>and</strong> enforced? How could<br />
producers <strong>and</strong> major consumers agree on sharing<br />
the burden of implementation (which presumably<br />
would require active market intervention)?<br />
Finally, it has been proposed that the major oilproducing<br />
countries – notably Saudi Arabia – take<br />
a more active role in the price discovery process<br />
<strong>and</strong> engage in direct sales of their crude oil through<br />
auctions of forward contracts for physical delivery<br />
<strong>and</strong> acceptance of a secondary market. 7<br />
4.1 Relying on Longer-term Pricing<br />
Even if speculation is curbed <strong>and</strong> short-term<br />
volatility is successfully dampened, it would be<br />
advisable to rely on price signals from longer-term<br />
maturities rather than on spot or front month prices.<br />
Prices for longer maturities (3 or 6 or 12 months)<br />
always fluctuate less than front month prices <strong>and</strong><br />
are inherently more stable, because they are not<br />
influenced by short-term inconsistencies of dem<strong>and</strong><br />
<strong>and</strong> supply.<br />
There is no overwhelming reason why prices to<br />
the final consumer should reflect the spot or front<br />
month market. Refiners <strong>and</strong> retailers have the option<br />
of hedging forward <strong>and</strong> could very well be asked to<br />
guarantee a price to their customers or give significant<br />
advance notice of any variation. The market will<br />
not spontaneously generate such behavior: no oil<br />
products retailer has conceived of competing on<br />
the basis of guaranteeing a price to its customers<br />
for a given period of time. The reason is simple:<br />
customers cannot be tied to a specific supplier. They<br />
would prefer the supplier that guarantees a price in<br />
the longer run for as long as that price is lower than<br />
the competition, <strong>and</strong> switch to the competition as<br />
soon as it becomes higher. However, if regulations<br />
were adopted making it m<strong>and</strong>atory for all suppliers<br />
to guarantee prices for a given period of time <strong>and</strong>/<br />
or announce changes with sufficient advance notice,<br />
the final consumer could not take advantage of
prices that may be lower in the short term.<br />
It is normally considered that oil products<br />
markets are either free or administered, <strong>and</strong> the latter<br />
frequently means prices that are kept artificially low,<br />
because governments are reluctant to pass on price<br />
increases for crude oil to the final consumers. Indeed,<br />
the extensive reliance on administered prices in the<br />
developing countries, notably in the fast growing<br />
Asian countries, has been singled out as one reason<br />
for the rigidity of dem<strong>and</strong> relative to prices: dem<strong>and</strong><br />
is simply shielded from higher prices.<br />
What is proposed here is not a system of<br />
administered prices, but a set of regulations which<br />
would in essence encourage refiners <strong>and</strong> retailers<br />
to hedge on the futures market <strong>and</strong> lock in prices<br />
which they offer to their clients. Requesting retailers<br />
to “post” prices which can only be changed with, say,<br />
three months’ advance notice would probably yield<br />
the best results: competitors would be able to decide<br />
whether to follow the moves of the price leader <strong>and</strong><br />
price competition would still be possible. If prices<br />
need to be guaranteed over a set period of time,<br />
adjustments will be more difficult <strong>and</strong> competition<br />
will be discouraged. In all cases, coordination in view<br />
of price fixing needs to be repressed.<br />
The combination of advance notice <strong>and</strong> limits to<br />
the frequency of price changes would represent an<br />
increase of energy security for the final consumer<br />
per se. In theory, the final consumer could use<br />
the futures market <strong>and</strong> derivatives to reduce his<br />
risk <strong>and</strong> enhance his own security even in today’s<br />
conditions, but in practice this is beyond the means<br />
of most consumers. Only large consumers, such as<br />
airlines or shipping companies, have done so, <strong>and</strong><br />
they too are vulnerable to the threat of consumer<br />
infidelity whenever their final prices are higher<br />
than the competition. Regulations for encouraging<br />
systematic hedging would contribute to energy<br />
security overall.<br />
4.2 Price B<strong>and</strong>s<br />
The concept of a price b<strong>and</strong> has been around for<br />
some time as a way to dampen volatility through<br />
a maximum <strong>and</strong> minimum price target which<br />
would trigger action on the part of producers <strong>and</strong>/<br />
Functioning of the International Oil Markets <strong>and</strong> <strong>Security</strong> Implications<br />
or consumers as the market price approaches or<br />
crosses the extremes of the b<strong>and</strong>. OPEC had a<br />
notional price b<strong>and</strong> between 2000 <strong>and</strong> 2005. Robert<br />
Mabro, Christopher Allsopp <strong>and</strong> Bassam Fattouh<br />
of the Oxford Institute of <strong>Energy</strong> Studies have all<br />
argued in favor of a b<strong>and</strong>. Behrooz Baik Alizadeh of<br />
the Iranian Ministry of Petroleum has written, “In<br />
its 109th ordinary meeting in March 2000, OPEC<br />
unofficially introduced its price b<strong>and</strong> mechanism<br />
to the market. Within this mechanism, in the case<br />
of the average OPEC Basket crude price falling<br />
under $22/b for more than 10 successive working<br />
days, OPEC member states would be obligated to<br />
cut their daily production by 500,000 b/d, <strong>and</strong> in the<br />
case of the price exceeding $28/b for 20 successive<br />
working days, OPEC would increase production by<br />
500,000 b/d. Although OPEC took advantage of this<br />
mechanism only once, increasing production by<br />
500,000 b/d beginning on 31 October 2000, <strong>and</strong> gave<br />
up the whole idea in January 2005, introduction of<br />
this mechanism affected the market psychologically<br />
<strong>and</strong> stabilized prices during the period that OPEC<br />
was not inclined to change prices beyond specific<br />
limits.” 8<br />
The problem with any price b<strong>and</strong> concept is<br />
the instrumentation of intervention as the price<br />
approaches the limits. In the absence of appropriate<br />
instrumentation, it is not at all clear that the market<br />
psychology will be affected – indeed the market<br />
may be tempted to challenge the b<strong>and</strong> <strong>and</strong> test the<br />
will of governments trying to enforce the same.<br />
A price b<strong>and</strong> may be effective if it is agreed upon<br />
by both importing <strong>and</strong> exporting countries. It is not<br />
clear that such an agreement would ever be possible,<br />
although at present it appears that the target<br />
prices of both sides are very close. The interests of<br />
exporters <strong>and</strong> importers are in structural opposition,<br />
<strong>and</strong> the current convergence is likely to be an<br />
exception. However, it may not be excluded that<br />
the industrial countries’ concern for climate change<br />
<strong>and</strong> their desire to diversify their energy balances<br />
away from fossil fuels <strong>and</strong> specifically oil, <strong>and</strong> the<br />
exporting countries’ fear that oil might be penalized<br />
as a consequence, have indeed created a new order<br />
of priorities in the two sides, such that the importers<br />
no longer wish to minimize, <strong>and</strong> the exporters no
<strong>Energy</strong> <strong>Security</strong>: Potential for EU-GCC Cooperation<br />
longer wish to maximize the price.<br />
Secondly, for the b<strong>and</strong> to be a useful concept<br />
it would be necessary to enforce supply restraint<br />
on all exporters, not just OPEC. It may be argued<br />
that the threat of unrestrained expansion of non-<br />
OPEC supplies is fading away, because non-OPEC<br />
countries are unable to exp<strong>and</strong> their production<br />
very much, <strong>and</strong> in fact non-OPEC production has<br />
already peaked or plateau-ed according to some<br />
interpretations. Nevertheless, the importing<br />
countries should be ready to defend the lower limit<br />
of the b<strong>and</strong> by imposing limitations on imports of oil<br />
from non-OPEC countries, if necessary.<br />
In the opposite case of prices reaching the upper<br />
limit of the b<strong>and</strong>, OPEC countries would obviously<br />
be called to use all of their available capacity to<br />
supply a tight market. However, if OPEC were to<br />
reach the limit of its capacity <strong>and</strong> the market still<br />
remained tight, then the importing countries should<br />
be ready to ration domestic consumption, or use<br />
“strategic” stocks (more on stocks later). In theory,<br />
this would also require concerted action on the part<br />
of all importers – something which is guaranteed to<br />
be very contentious <strong>and</strong> difficult to achieve. In the<br />
absence of concerted action, free riding on the part<br />
of some would prevail.<br />
A further difficulty has to do with revisions or<br />
adjustments to the b<strong>and</strong>. If the b<strong>and</strong> is adjusted<br />
very frequently – à la limite, in response to any<br />
price movement – it ends up being no restraint at<br />
all on volatility. At the same time, a b<strong>and</strong> that is<br />
never adjusted is bound to become obsolete <strong>and</strong><br />
untenable. Finding the optimal middle-of-the-road<br />
solution is highly subjective <strong>and</strong> controversial. If<br />
we add that this middle-of-the-road compromise<br />
would need to be collectively endorsed by both oil<br />
exporters <strong>and</strong> importers, we may conclude that the<br />
task is very difficult indeed.<br />
A price b<strong>and</strong> might be useful if it is intended to<br />
limit price volatility only within a specified period of<br />
time <strong>and</strong> involves a market-responsive automatic<br />
adjustment mechanism. For example, it may be<br />
envisaged that the price b<strong>and</strong> would extend x%<br />
above <strong>and</strong> below a central price equal to the average<br />
of observed prices in the previous year. In this way,<br />
if the price remains consistently close to the upper<br />
or lower limit of the b<strong>and</strong>, the central price for the<br />
following year will be adjusted <strong>and</strong> the b<strong>and</strong> moved<br />
up or down. The frequency of adjustment of the<br />
central price should be inversely proportional to<br />
the scope of the b<strong>and</strong>. A system of very frequent<br />
adjustments (e.g. weekly adjustments of the central<br />
price to a moving average of the observed price<br />
over the previous x months) might be compatible<br />
with a relatively narrow b<strong>and</strong> (say 10 percent above<br />
or below the central price). This would serve the<br />
purpose of dampening very short-term volatility.<br />
However, if the objective is creating a more<br />
reliable investment environment, priority should be<br />
given to less frequent adjustments <strong>and</strong> a wider b<strong>and</strong>.<br />
The beneficial effect on investment decisions of a<br />
broadly-based agreement on a central price is likely<br />
to outweigh the uncertainty intrinsic in a relatively<br />
broader b<strong>and</strong>.<br />
Finally, as mentioned, the effectiveness of<br />
a b<strong>and</strong> depends on its instrumentation. <strong>Supply</strong><br />
restraint may take the form of output limits or the<br />
accumulation of stocks, which in turn could be used<br />
to counter excessive price increases. This leads us<br />
to the possibility of using intervention stocks in<br />
addition to strategic stocks, or some hybrid formula<br />
of strategic/intervention stocks.<br />
5. Managing stocks<br />
In theory, strategic stocks are clearly distinct from<br />
commercial or intervention stocks. Strategic stocks<br />
are meant to be used in case of supply emergencies<br />
<strong>and</strong> to serve the purpose of guaranteeing energy<br />
security. Intervention stocks are meant to maintain<br />
prices at a fixed level or within a b<strong>and</strong>. In practice, the<br />
distinction is blurred, because the concept of energy<br />
security incorporates the notion of affordability, <strong>and</strong><br />
therefore some notion of a maximum acceptable<br />
price. Furthermore, emergencies or disturbances<br />
arising from geopolitical events such as wars or<br />
revolutions tend to be reflected in price levels more<br />
so than in physically available supplies: in the end,<br />
dem<strong>and</strong> always is matched by supply. Consequently,<br />
strategic stocks whose utilization is based on a strict<br />
quantitative criterion (such as is the case for the IEA<br />
emergency response mechanism) tend never to be<br />
used.
Intervention stocks are normally not very well<br />
regarded because in all cases in which the defense of<br />
a rigid price through the use of an intervention stock<br />
has been attempted, the stock facility eventually<br />
went bust. A rigid price regime invites speculation,<br />
<strong>and</strong> eventually market forces overwhelm any stock<br />
that might be accumulated.<br />
At the same time, it st<strong>and</strong>s to reason that stocks<br />
should be accumulated at times when the price is<br />
declining or low <strong>and</strong> liquidated at times when prices<br />
are high or increasing. Accumulating stocks even<br />
at times when prices are increasing, as the Bush<br />
administration did in the US, appears intuitively<br />
irrational.<br />
What this means is that institutions <strong>and</strong> facilities<br />
should be established to manage stocks in a flexible<br />
way <strong>and</strong> in the absence of a fixed price regime. If a<br />
b<strong>and</strong> is broadly agreed, as discussed in the previous<br />
paragraph, then institutions managing stocks will<br />
feel encouraged to sell when the price approaches<br />
the top of the b<strong>and</strong>, <strong>and</strong> buy when it approaches the<br />
bottom, but it might be dangerous to impose a rigid<br />
rule on the stock managers.<br />
Should governments establish intervention<br />
stocks? In theory, managing stocks in a way which<br />
is functional to maintaining prices within a b<strong>and</strong> is<br />
a profitable operation, which might very well be<br />
undertaken by private investors. Investors may<br />
choose to buy <strong>and</strong> sell purely paper barrels or they<br />
may decide to hold physical barrels: the latter<br />
option is likely to have a beneficial effect on price<br />
stability. The objective of government regulations,<br />
therefore, should be to encourage private investors<br />
to hold physical stocks. Today, individual investors<br />
(the doctors <strong>and</strong> dentists of Chicago fame) <strong>and</strong> large<br />
financial investors shy away from physical barrels<br />
<strong>and</strong> only want to deal in paper.<br />
Encouraging holding physical stocks requires<br />
passing legislation that will make it easier to build<br />
<strong>and</strong> maintain storage. This is partly an issue of<br />
environmental <strong>and</strong> fiscal rules, partly an issue of<br />
market organization. Physical storage operators<br />
(who shall be separate legal entities from the<br />
owners of the stored oil) should be empowered to<br />
issue certificates convertible in physical barrels: oil<br />
deposited into the storage would be exchanged for<br />
Functioning of the International Oil Markets <strong>and</strong> <strong>Security</strong> Implications<br />
such certificates, <strong>and</strong> certificates could be used to<br />
withdraw oil from storage. There is nothing exotic<br />
about this, but such a facility <strong>and</strong> a market for the<br />
certificates that it might issue does not exist.<br />
Governments may well decide to facilitate<br />
this development by establishing an agency to<br />
build <strong>and</strong> manage the storage facility 9 – this can<br />
be established at the national or regional level or<br />
both – <strong>and</strong> issue certificates to oil depositors. The<br />
possibility of depositing oil would be open to all,<br />
including national oil companies of oil-exporting<br />
countries. Storage facilities could be established<br />
in all appropriate locations, not necessarily in<br />
the territory of the country or group of countries<br />
establishing the same. In fact, it might be very<br />
interesting to establish large storage facilities at<br />
critical logistical junctures, such as the Suez Canal<br />
or the Malacca Strait, or in conjunction with pipeline<br />
<strong>project</strong>s to bypass the same.<br />
Major trading companies already maintain<br />
storage facilities, but the phenomenon is limited 10<br />
<strong>and</strong> not sufficient to influence crude oil prices. Much<br />
larger storage facilities are needed, <strong>and</strong> private<br />
sector initiative may not be attracted to establishing<br />
them. Nevertheless, per se the business of operating<br />
storage facilities may very well be profitable if<br />
investment in physical stocks develops as envisaged<br />
here.<br />
Stored oil certificates should be designed <strong>and</strong><br />
regulated in such a way that they will be accepted<br />
as collateral by financial institutions. This would<br />
open the possibility for oil exporting countries of<br />
“depositing” oil that they cannot sell at prices which<br />
they deem convenient, <strong>and</strong> borrow funds to make<br />
up for the temporary shortfall in revenue. Of course,<br />
if assumptions about future prices are unrealistic,<br />
they may end up defaulting – but this should be a<br />
concern of the banks, as is the case for any credit<br />
issued against real collateral.<br />
6. Dem<strong>and</strong> security<br />
In discussions on energy security, producing<br />
countries have frequently stated that they are willing<br />
to engage in the investment which is required to<br />
meet expected future dem<strong>and</strong>, but they need some<br />
dem<strong>and</strong> security, i.e. assurance that the dem<strong>and</strong>
<strong>Energy</strong> <strong>Security</strong>: Potential for EU-GCC Cooperation<br />
will be there as expected. In other words, security of<br />
supply begs security of dem<strong>and</strong>.<br />
In a free market environment, there can of<br />
course be no assurance of future dem<strong>and</strong>. Importing<br />
countries are at a loss in responding to the request<br />
for dem<strong>and</strong> security, because they possess no tools<br />
to guarantee dem<strong>and</strong>. How can this problem be<br />
approached?<br />
The establishment of storage facilities where oil<br />
could be deposited against certificates that may be<br />
discounted at financial intermediaries is, of course,<br />
already a step in the right direction. An agreement<br />
to consult <strong>and</strong> coordinate in the accumulation/<br />
decumulation of strategic stocks may also be of<br />
help. But neither is likely to be viewed as providing<br />
sufficient security of dem<strong>and</strong>.<br />
Historically, the gas industry solved the problem<br />
through take-or-pay contracts. These were said<br />
to place the burden of the volume risk on the<br />
buyer <strong>and</strong> leave the burden of the price risk on the<br />
seller. There is no denying that this arrangement,<br />
unpopular as it might have become, has allowed the<br />
implementation of some very ambitious investment<br />
<strong>project</strong>s, <strong>and</strong> significant improvement in Europe’s<br />
energy supplies. But these arrangements were<br />
possible only because prices were exogenously<br />
generated: gas prices were indexed to oil <strong>and</strong> oil<br />
products prices, to guarantee the competitiveness<br />
of gas in marginal uses.<br />
In the case of oil, we cannot think in terms of<br />
take-or-pay contracts because the price needs to be<br />
internally generated. However, individual countries,<br />
including large ones, could conceivably conclude<br />
take-or-pay contracts <strong>and</strong> index the price to signals<br />
generated elsewhere in the world. For example,<br />
China or India could put in place take-or-pay<br />
contracts for volumes of <strong>Gulf</strong> oil, <strong>and</strong> index the price<br />
to Brent or WTI or some other traded market (e.g.<br />
the DME Oman contract).This would provide the<br />
<strong>Gulf</strong> producers with significant dem<strong>and</strong> certainty,<br />
<strong>and</strong> probably would be viewed with considerable<br />
anxiety by importers in the US, Japan <strong>and</strong> Europe. It<br />
must be pointed out that we are not quite there yet,<br />
although the intensification of relations between<br />
the <strong>Gulf</strong> <strong>and</strong> the emerging countries in Asia does<br />
point in this direction.<br />
The drawback of this arrangement is that it<br />
would divide the oil market into price making <strong>and</strong><br />
price taking segments; it is to be expected that<br />
volatility on the price making segment would be<br />
relatively higher the smaller the price making<br />
segment is relative to the price taking segment.<br />
This is the same as saying that oil may be sold<br />
on the basis of long-term evergreen contracts or<br />
on a short-term basis: price is generated on the<br />
short-term market, <strong>and</strong> this is where all potential<br />
dem<strong>and</strong>/supply imbalances will be felt. Such<br />
imbalances may be minor when related to global<br />
dem<strong>and</strong> <strong>and</strong> supply, but large when related to<br />
short-term trading only.<br />
Today, we have a system which is very close to<br />
this: prices are indexed to traded markets that are a<br />
very small component of global physical supply <strong>and</strong><br />
dem<strong>and</strong>. The difference is that there are no proper<br />
take-or-pay contracts, only evergreen contracts<br />
which envisage neither an obligation to supply on<br />
the part of the seller nor an obligation to lift on<br />
the part of the buyer. In addition, the price directly<br />
reflects all the volatility of short-term markets. But<br />
an evolution towards take-or-pay contracts closer<br />
to those seen in the gas industry is conceivable.<br />
7. Vertical Integration<br />
Another potential step in the direction of a<br />
longer-term perspective to investment in the<br />
industry is facilitating vertical integration. In the<br />
current downturn, the large, vertically integrated<br />
international oil companies have claimed that their<br />
investment plans are unaffected by the downturn<br />
<strong>and</strong> based on their long-term strategy.<br />
This may or may not be true, of course. In past<br />
years, these same companies have frequently been<br />
criticized for allocating larger funds to purchasing<br />
their own stock <strong>and</strong> propping up the value of their<br />
shares than in industrial <strong>project</strong>s proper. They<br />
have also extensively engaged in mergers <strong>and</strong><br />
acquisitions, leading to the disappearance of several<br />
independent corporations – a loss of diversity which<br />
can only negatively affect the vitality of the species.<br />
At the same time, it is true that large integrated<br />
companies “own” their market thanks to their<br />
presence at the retail level <strong>and</strong> the oligopolistic
nature of the business. Therefore, they enjoy a<br />
considerable degree of dem<strong>and</strong> security, although<br />
they face the price risk <strong>and</strong> are exposed to price<br />
volatility as any other player in the industry. Large<br />
integrated companies also have a broader capital<br />
base <strong>and</strong> may be better able to continue funding<br />
investment <strong>project</strong>s out of internally generated<br />
resources than smaller independents.<br />
Nevertheless, the “old” large integrated<br />
companies remain vulnerable to the pressure<br />
from financial analysts <strong>and</strong> investors, who are<br />
typically only interested in “returning value” to<br />
the shareholders in the short run. The functioning<br />
of financial markets does not encourage strategic<br />
thinking, as investors can enter <strong>and</strong> exit a stock at<br />
any time, <strong>and</strong> are mostly interested in short-term<br />
appreciation. This is a problem for all industrial<br />
corporations, but is an especially difficult problem<br />
for the oil companies, whose outlook is structurally<br />
long-term.<br />
It is typical of the distorting signals that<br />
management receives from the financial market<br />
that all attention in recent years has been focused<br />
on cutting costs rather than guaranteeing the longterm<br />
growth of the company.<br />
It must be noted that security of energy supply<br />
is also dependent on the functioning of financial<br />
markets <strong>and</strong> the kind of signals that originate<br />
from them – however, we cannot enter here into<br />
a discussion on how financial markets might be<br />
reformed to encourage longer-term thinking on the<br />
part of management.<br />
In any case, the problem which affects the<br />
behavior of the “old” large integrated companies<br />
does not affect the “new” integrated companies:<br />
these are the national companies of the major<br />
importers which are venturing internationally in<br />
order to improve their security of supply, as well<br />
as the national oil companies of the exporting<br />
countries which are investing downstream in<br />
order to gain better control of their markets. In<br />
both cases, ownership remains either entirely<br />
or to a large extent in the h<strong>and</strong>s of strategic<br />
investors, frequently the state itself, <strong>and</strong> strategic<br />
thinking is encouraged rather than short-term<br />
profitability.<br />
Functioning of the International Oil Markets <strong>and</strong> <strong>Security</strong> Implications<br />
The growing role of these companies is a factor<br />
increasing energy security because they will invest<br />
with a long-term perspective. The activism (or shall<br />
we say “aggressive” approach) of Chinese companies<br />
to acquiring reserves internationally has frequently<br />
been portrayed as being a threat to importers<br />
in the OECD – while it should be more properly<br />
understood as an example to imitate. Equally, the<br />
drive of some national oil companies to integrate<br />
downstream, acquiring refining <strong>and</strong> retailing assets<br />
in the importing countries, has frequently been<br />
viewed as a threat, as if it entailed a further degree<br />
of dependence <strong>and</strong> loss of control, while in fact it<br />
should be viewed as improving security of supply<br />
<strong>and</strong> reinforcing the commitment of the supplier<br />
to service his own assets <strong>and</strong> keeping the market<br />
supplied.<br />
Hence, vertical integration is important, <strong>and</strong><br />
it is good for energy security. The OECD countries<br />
should look into ways in which they may encourage<br />
more of a strategic behavior on the part of the “old”<br />
integrated majors, <strong>and</strong> preserve the species by<br />
putting a limit to the cannibalism represented by<br />
mergers <strong>and</strong> acquisitions. And they should welcome<br />
the downstream integration of the national oil<br />
companies of major producers, interpreting the will<br />
to invest as a commitment to supply.<br />
Conclusion<br />
This paper has argued that the functioning of<br />
markets is a key determinant of energy security.<br />
Geopolitical <strong>and</strong> other threats to physical supply<br />
may cause price shocks, but, based on historical<br />
experience, are unlikely to cause any significant<br />
physical shortage. Therefore, insecurity is<br />
manifested by price shocks <strong>and</strong> price shocks are<br />
insecurity. However, price shocks may very well<br />
originate in the absence of major disturbances<br />
to physical supplies, simply as runs originated by<br />
investors, or “speculators,” which the market does<br />
not correct because both dem<strong>and</strong> <strong>and</strong> supply are<br />
rigid relative to prices.<br />
Therefore, price volatility is a threat per se, <strong>and</strong><br />
in many ways more important <strong>and</strong> more devastating<br />
than potential threats to physical supplies. The cost<br />
of price volatility is very high, much higher than the
<strong>Energy</strong> <strong>Security</strong>: Potential for EU-GCC Cooperation<br />
potential cost of possible disruption to physical supply;<br />
<strong>and</strong> it is significant not just in the short run, but even<br />
more so in the long run, because of the depressive<br />
effect it has on energy investment generally.<br />
Thus, addressing price volatility is a key<br />
component of energy security policy.<br />
Unfortunately, there is no easy recipe to dampen<br />
price volatility: this paper has reviewed several<br />
approaches that may reduce volatility, notably:<br />
• Encourage the freer trading of major crude oil<br />
streams, notably those from the <strong>Gulf</strong><br />
• Increase reliance on long-term pricing<br />
0<br />
endnotes<br />
1.<br />
2.<br />
3.<br />
4.<br />
5.<br />
6.<br />
7.<br />
8.<br />
9.<br />
• Enforce an internationally agreed price b<strong>and</strong><br />
• Manage stocks<br />
• Offer dem<strong>and</strong> security through take-or-pay<br />
contracts<br />
•<br />
Encourage vertical integration<br />
None of these approaches is sufficient to<br />
stabilize prices, but collectively they may very well<br />
succeed in reducing the extreme volatility that has<br />
been experienced since 2004. Volatility will never be<br />
eliminated because it is a structural feature of the oil<br />
industry, but it may be contained, <strong>and</strong> energy supply<br />
would be perceived as being much more secure.<br />
Robert Mabro, “The International Oil Price Regime - Origins, Rationale <strong>and</strong> Assessment,” The<br />
Journal of <strong>Energy</strong> Literature XI, no. 1 (June 2005): 3-20.<br />
Christopher Allsopp <strong>and</strong> Bassam Fattouh, “Oil Prices: Fundamentals or Speculation?” (presentation<br />
at the Bank of Engl<strong>and</strong>, June 13, 2008).<br />
The Oxford Institute for <strong>Energy</strong> Studies held a conference on oil price volatility in October 2009 at<br />
St. Catherine’s College. A summary of the discussion, which was held under Chatham House rules,<br />
was published in the Oxford <strong>Energy</strong> Forum #79 of November 2009.<br />
Gordon Brown <strong>and</strong> Nicholas Sarkozy, “Oil Prices Need Government Supervision,” Wall Street<br />
Journal, July 8, 2009.<br />
Robert Mabro has proposed the creation of an independent commission backed by significant<br />
research capability <strong>and</strong> an international convention that would be expected to set a reference price<br />
for oil once a month. ENI has proposed the creation of a global energy agency “which might possess<br />
the tools to implement concrete initiatives as needed to stabilize the price of oil” (my translation of<br />
Scaroni’s original speech, available in Italian from http://www.eni.com/en_IT/attachments/media/<br />
speeches-interviews/italian-version-speech-scaroni-G8-energia-25-maggio-2009.pdf )<br />
In particular, Bassam Fattouh <strong>and</strong> Christopher Allsopp, “The Price B<strong>and</strong> <strong>and</strong> Oil Price Dynamics,”<br />
Oxford <strong>Energy</strong> Comment, July 2009.<br />
Giacomo Luciani, “From Price Taker to Price Maker? Saudi Arabia <strong>and</strong> the World Oil Market,”<br />
Rahmania Occasional Paper, forthcoming.<br />
MEES, February 9, 2009.<br />
Japan, Abu Dhabi <strong>and</strong> Saudi Arabia have an agreement along these lines. Japan has built storage in<br />
Japan itself that is offered to Abu Dhabi <strong>and</strong> Saudi Arabia free of charge to store its oil. The stored<br />
oil belongs to the producer but obviously Japan gains a degree of security because of this. See<br />
“Saudi Arabia to Store Oil in Japan” Reuters, December 23, 2009.<br />
10. In May 2010, Vitol sold 50 percent of its global storage business to Malaysia’s MISC, a subsidiary<br />
of Petronas, the purpose being to attract additional equity to exp<strong>and</strong> the business. Vitol being a<br />
privately held company owned by its employees faces difficulty in tapping the equity market <strong>and</strong><br />
finance expansion. See Financial Times, May 17, 2010.
References<br />
•<br />
•<br />
•<br />
•<br />
•<br />
•<br />
•<br />
•<br />
•<br />
•<br />
•<br />
•<br />
•<br />
•<br />
•<br />
•<br />
•<br />
•<br />
•<br />
•<br />
Functioning of the International Oil Markets <strong>and</strong> <strong>Security</strong> Implications<br />
Aissaoui, Ali. 2008. Shaping long term oil price expectations for investment : Is it workable? Is it<br />
achievable? APICORP Commentary 3, no. 11-12 (Nov.-Dec). http://www.apicorp-arabia.com/html/<br />
cms/media/pdf/research/Commentary03112008.pdf<br />
Aissaoui, Ali. 2009. What is a fair price for oil <strong>and</strong> what makes $75 a barrel seem fair? APICORP<br />
Commentary 4, no. 4 (April). http://www.apicorp-arabia.com/html/cms/media/pdf/research/<br />
Commentary_Vol_4_No_4_2009.pdf<br />
Allsopp, Christopher <strong>and</strong> Bassam Fattouh. 2009. The price b<strong>and</strong> <strong>and</strong> oil price dynamics. OIES Comment,<br />
July. http://www.oxfordenergy.org/pdfs/comment_01_07_09.pdf<br />
Allsopp, Christopher <strong>and</strong> Bassam Fattouh. 2008. Oil prices: fundamentals or speculation? Presentation<br />
at the Bank of Engl<strong>and</strong>, June 13.<br />
Diwan, Roger. Forthcoming. The financialization of the oil market <strong>and</strong> the increasing impact of<br />
financial institutions in the pricing of crude oil. Rahmania Occasional Paper.<br />
<strong>Energy</strong> Charter Secretariat. 2007. Putting a price on energy – pricing mechanisms for oil <strong>and</strong> gas.<br />
Fattouh, Bassam. 2007. The drivers of oil prices: The usefulness <strong>and</strong> limitations of non-structural<br />
model, the dem<strong>and</strong>–supply framework <strong>and</strong> informal approaches. OIES WPM, 32. March. http://www.<br />
oxfordenergy.org/pdfs/WPM32.pdf<br />
Fattouh, Bassam. 2008. The dynamics of crude oil price differentials. OIES WPM 36, January. http://<br />
www.oxfordenergy.org/pdfs/WPM36.pdf<br />
Fattouh, Bassam. 2008. Prospects of the DME Oman crude oil futures contract. OIES Monthly<br />
Comment, March. http://www.oxfordenergy.org/pdfs/comment_0308-1.pdf<br />
Fattouh, Bassam. 2009. Basis variation <strong>and</strong> the role of inventories: Evidence from the crude oil market.<br />
OIES WPM 38, January. http://www.oxfordenergy.org/pdfs/WPM38.pdf<br />
Fattouh, Bassam. 2009. Reinforcing feedbacks, time spreads <strong>and</strong> oil prices. Oxford <strong>Energy</strong> Comment,<br />
March. http://www.mees.com/postedarticles/oped/v52n17-5OD02.htm<br />
Fattouh, Bassam. 2009. The oil market through the lens of the latest oil price cycle: Issues <strong>and</strong><br />
proposals. Presentation at the OIES conference on “Oil Price Volatility: Causes <strong>and</strong> Mitigation<br />
Strategies,” October 9.<br />
Fattouh, Bassam. 2010. Price formation in oil markets: Some lessons from 2009. Oxford <strong>Energy</strong><br />
Comment, March.<br />
Horsnell, Paul. 2007. The dynamics of oil price determination. Oxford <strong>Energy</strong> Forum #71, November.<br />
Kilian, Lutz. 2010. Oil price volatility: Origins <strong>and</strong> effects. WTO Staff Working Paper ERSD-2010-02:<br />
January.<br />
Luciani, Giacomo. Forthcoming. From price taker to price maker? Saudi Arabia <strong>and</strong> the world oil<br />
market. Rahmania Occasional Paper.<br />
Luciani, Giacomo. Forthcoming. Price <strong>and</strong> revenue volatility: What policy options <strong>and</strong> role for the<br />
state. Global Governance.<br />
Mabro, Robert. 2005. The international oil price regime: Origins, rationale <strong>and</strong> assessment. JEL XI, 1<br />
(June): 3-20.<br />
OIES Summary. 2009. Conference on “Oil Price Volatility: Causes <strong>and</strong> Mitigation Strategies.” Oxford<br />
<strong>Energy</strong> Forum #79, November.<br />
US Interagency Task Force on Commodity Markets. Interim report on crude oil. http://www.cftc.<br />
gov/stellent/groups/public/@newsroom/documents/file/itfinterimreportoncrudeoil0708.pdf<br />
1
SESSION IV: LNG <strong>and</strong> Gas Supplies to Europe<br />
Geopolitical Issues of Europe’s Future Gas <strong>Supply</strong><br />
Geopolitical Issues of europe’s Future Gas supply*<br />
Introduction <strong>and</strong> Definition of the Concept<br />
of Geopolitical Risk<br />
The gas industry is gaining an ever-growing<br />
importance in the energy system of the <strong>European</strong><br />
Union (EU) <strong>and</strong> on the global energy scene. As the<br />
2020 target approaches, 1 the need for using less<br />
carbon-producing energy resources becomes more<br />
urgent. The targeted use of renewable resources<br />
might account for 15 percent of the EU’s total energy<br />
mix; it naturally follows that a complete halt to fossil<br />
fuel usage is not possible in the short or medium<br />
term. However, the process of switching to non-fossil<br />
energy sources can be accompanied by increased use<br />
of more environment-friendly fossil fuels. Natural<br />
gas is indeed a particularly adequate alternative to<br />
oil <strong>and</strong> coal, especially for power-producing plants.<br />
Gas can be considered to emit half the amount of CO₂<br />
compared to oil <strong>and</strong> one fourth compared to coal.<br />
The strategic importance of natural gas for the<br />
EU is very clear. Until recently, an important share<br />
of gas consumed in the EU was produced internally,<br />
thanks mainly to the Dutch <strong>and</strong> British resources.<br />
Today, however, imports represent the major supply<br />
source. This situation is expected to worsen as fields<br />
in the Dutch <strong>and</strong> British part of the North Sea are<br />
rapidly depleting. At this moment, the EU will face<br />
the potentially dangerous situation of being forced<br />
to import the vast majority of an energy source vital<br />
for its functioning.<br />
The major element causing unease among<br />
experts <strong>and</strong> governments is that certain sources of<br />
gas supplies to the EU are believed to be vulnerable<br />
in the sense that they face the threat of being<br />
disrupted or even completely stopped. The reasons<br />
for this may lie in a technical issue, a physical<br />
impossibility to supply the required volumes of gas,<br />
or the inappropriate behavior of one actor in the<br />
supply process. This last category, which falls under<br />
‘geopolitical risks,’ is dealt with in this paper.<br />
For the purpose of this paper, risk could be<br />
described as the set of threats imposed on the<br />
security of natural gas supply to <strong>European</strong> Union<br />
members <strong>and</strong> caused by the specific behavior of one<br />
or more countries (producing or transit) or non-state<br />
actors <strong>and</strong> by the evolution of global institutions <strong>and</strong><br />
markets.<br />
1.theoretical Geopolitical Risks<br />
It seems appropriate, as a theoretical<br />
recapitulation, to provide a list of events or situations<br />
that could be considered as threats for the supply<br />
of natural gas to the EU. At the outset, it must<br />
also be stressed that the gas business functions<br />
very differently from the oil one, the first reason<br />
being the physical characteristics of each energy<br />
source. While oil can be put in vessels <strong>and</strong> shipped<br />
all over the world, gas is primarily transported by<br />
pipeline. Consequently, the gas market is less prone<br />
to experiencing high <strong>and</strong> unexpected volatility,<br />
although gas prices are tied to oil prices.<br />
Until now, the political economy of gas has<br />
been much more regional <strong>and</strong> bilateral as the main<br />
instrument used by the market is the take-or-pay<br />
long-term contract. There are advantages <strong>and</strong><br />
disadvantages to this situation. First of all, gas prices<br />
are less likely to experience dramatic increases, as a<br />
shock in one part of this fragmented market does not<br />
necessarily impact another part. Pipeline flows can<br />
hardly be reversed unless the pipe is designed to do<br />
so, <strong>and</strong> the customer at the end of the pipe cannot<br />
* This paper was written by François-Loïc Henry (GRCF) also based on work by Stefan Schaar Kruse (Ramboll) <strong>and</strong> Sohbet Karbuz (OME)
<strong>Energy</strong> <strong>Security</strong>: Potential for EU-GCC Cooperation<br />
be changed. The interdependence of producers<br />
<strong>and</strong> consumers is a fundamental feature of EU gas<br />
supplies. On the other h<strong>and</strong>, if the flow is interrupted<br />
or halted, the consuming country experiences great<br />
difficulties in accessing other suppliers. The situation<br />
becomes particularly dangerous when the country<br />
does not possess sufficient storage capacities. In<br />
that case, the country is left with no gas at all <strong>and</strong><br />
is forced to direct its consumption to alternative<br />
energies. This is precisely what happened in the<br />
Balkan region following a dispute between Russia<br />
<strong>and</strong> Ukraine in 2008-2009.<br />
1.1 Armed Conflicts<br />
So far, no major gas-producing country has been<br />
involved directly in a major inter-state conflict (with<br />
the exception of the Russia-Georgia war of 2008). In<br />
the case of armed conflicts involving oil-producing<br />
countries, the situation has proved potentially<br />
dangerous even for third parties located in the vicinity<br />
of the conflict area. In 1984, for example, during the<br />
Iran-Iraq war, Saudi <strong>and</strong> Kuwaiti oil tankers were<br />
attacked while crossing the Arabian <strong>Gulf</strong>. 2 At that<br />
time, Japan was in the first phase of negotiating<br />
an LNG deal with Qatar; the negotiations were<br />
interrupted <strong>and</strong> only resumed a decade later. During<br />
the 2009 Russia-Georgia war, Georgian officials<br />
claimed that Russian bombing had targeted the Baku-<br />
Tbilisi-Ceyhan oil pipeline. Close to this pipeline also<br />
flows the Baku-Tbilisi-Erzurum gas pipeline (South<br />
Caucasus), while other important proposed pipelines<br />
could follow the same route. Although the allegation<br />
turned out to be false, it caused concern in Europe as<br />
it showed that a supply axis was under the threat of<br />
collateral damage from a conflict.<br />
However, looking only at countries officially<br />
at war gives an incomplete picture as the majority<br />
of ongoing conflicts today do not fall within the<br />
traditional definition of war. 3 Asymmetrical conflicts<br />
appearing within the environment of a civil or intrastate<br />
war represent the most important category<br />
of armed conflicts now. This has repercussions on<br />
the underst<strong>and</strong>ing of the security of gas supply,<br />
as a producing or transit country that is not per se<br />
involved in a war can still represent a threat when<br />
a part of its territory is affected by conflict. This is<br />
4<br />
particularly the case if the physical infrastructure lies<br />
close to combat zones or within reach of a faction<br />
fighting the central government.<br />
It should be underlined that although no major<br />
gas producer is currently involved in a traditional war,<br />
many are affected in varying degrees by internal<br />
conflicts.<br />
War, therefore, could be an important risk for<br />
gas trade if:<br />
• a producing or transit country is directly involved<br />
in the conflict<br />
• a producing or transit country is located in a<br />
region close to the conflict<br />
•<br />
a gas pipeline takes a route affected by the<br />
conflict<br />
On the basis of historical experience, however,<br />
it can be said that armed conflicts, while they have<br />
greatly impacted prices <strong>and</strong> the development of new<br />
infrastructure, have rarely been the cause of a major<br />
physical disruption. To come back to the example of<br />
the 2008 Russia-Georgia war, all the variables tended<br />
to indicate a military intervention threatening<br />
the oil <strong>and</strong> gas transportation infrastructure; but<br />
nothing happened, showing that the effects of an<br />
armed conflict on the gas infrastructure are highly<br />
unpredictable <strong>and</strong> not always damaging.<br />
1.2 Political Instability<br />
The risk associated with regime change in a<br />
producing country is linked to the possibility of<br />
consequent policy changes affecting gas supplies.<br />
Political instability in gas-producing countries has<br />
never resulted in a cut-off of the physical flow of<br />
gas. However, in some cases, newly-established<br />
governments have forced gas buyers to enter into<br />
a renegotiation of the existing contracts. However,<br />
this is generally the exception as economic interests<br />
take primacy over political or ideological interests.<br />
The governments of producing countries tend to<br />
protect their reputation as reliable suppliers.<br />
To illustrate the risk caused by political instability,<br />
we may refer to two contrasting examples: first,<br />
Algeria after the death of President Boumedienne<br />
<strong>and</strong> second, Qatar in the mid-1990s.<br />
Following the death of President Boumedienne<br />
in 1978, a new administration took charge. They
had a drastically different vision from that of<br />
the Boumedienne government concerning the<br />
country’s natural resources. Building on the success<br />
of the OPEC, Algeria decided to apply a strategy<br />
where high prices were to replace large volumes.<br />
The ruling party also held the belief that national<br />
natural resources had to be directed toward the<br />
fulfilment of long-term domestic requirements <strong>and</strong><br />
the constitution of strategic reserves. 4<br />
The direct consequence was a push to get a<br />
vigorous increase in the gas export price. When<br />
the pipeline to Italy was ready to be operational at<br />
the end of 1980, Algeria dem<strong>and</strong>ed that the prices<br />
received at the Tunisian border be increased by $2<br />
per mmbtu from the price negotiated in 1977 which<br />
was $3.5 per mmbtu. The dispute escalated as ENI<br />
refused the request. Algeria stopped payments due<br />
to Italy for the construction of the pipeline <strong>and</strong> Italy<br />
ordered that all Italian construction <strong>and</strong> industrial<br />
<strong>project</strong>s in Algeria be frozen. As Aïssaoui notices,<br />
the battle became an attempt to change the <strong>net</strong>back<br />
pricing formula for oil-gas price parity. Italy had to<br />
cede <strong>and</strong> accept a price of $5.13 per mmbtu for gas<br />
delivered to it, <strong>and</strong> some other <strong>European</strong> countries<br />
importing gas from Algeria also had to accept the<br />
modification of the pricing formula.<br />
Eventually, the damage done to Algeria’s<br />
reputation by this issue of breach of contract was<br />
more significant than the short-term mo<strong>net</strong>ary<br />
gains made by the country.<br />
In contrast, the Qatari experience proves that<br />
sometimes even when countries undergo changes<br />
at the level of the head of state, no disruption of<br />
gas export conditions appears. In 1995, as the first<br />
trains of LNG shipment from the Qatari North field<br />
to Japan were almost finalized, the Crown Prince of<br />
Qatar Shaikh Hamad bin Khalifa Al-Thani deposed<br />
the Emir, his father Shaikh Khalifa Bin Hamad Al-<br />
Thani, in a non-violent coup. The new ruler was a<br />
proponent of the development of gas exports <strong>and</strong><br />
privileged good relations with the West. Hence, no<br />
alteration of the contractual obligations took place.<br />
The death of the President of Turkmenistan<br />
Saparmurat Niyazov in 2006 also raised questions<br />
concerning the future direction of the country.<br />
Many saw this event as the opportunity for a radical<br />
Geopolitical Issues of Europe’s Future Gas <strong>Supply</strong><br />
adjustment of the Great Game going on in Central<br />
Asia over the access to natural resources. Yet the<br />
new government did not significantly alter the<br />
objectives of Turkmenistan.<br />
Historical evidence tells us that rapid <strong>and</strong><br />
profound changes at the top in producing countries<br />
have very rarely resulted in the disruption of natural<br />
gas exports. Bilateral gas contracts generally create<br />
favorable conditions for both parties <strong>and</strong> tend to be<br />
resilient in case of political instability.<br />
1.3 Commercial Disputes<br />
Commercial disputes have been the principal<br />
cause of disruptions of gas flows lately <strong>and</strong> should<br />
thus be considered one of the main risks for the<br />
EU. As a matter of fact, it is the only threat that has<br />
actually materialized <strong>and</strong> has caused insecurity in<br />
the recent past such as in the 2006 <strong>and</strong> 2009 Russia-<br />
Ukraine gas crises.<br />
The political economy of gas trade gives the<br />
bargaining power first to the customer, but then<br />
the leverage shifts into the h<strong>and</strong>s of the producing<br />
country, which knows that once the pipeline has<br />
been constructed, the funds already invested being<br />
extremely large, the customer needs a steady cash<br />
flow. Therefore, the customer needs the gas to keep<br />
flowing in <strong>and</strong> cannot afford a cut; it will thus accept<br />
an increase of the price asked by the producer.<br />
Vernon, 5 <strong>and</strong> later Victor et al. (2003) have<br />
referred to this phenomenon as the “obsolescing<br />
bargain.” 6 These authors list the risks embedded in<br />
the development of a cross-border pipeline <strong>project</strong>:<br />
• The investment climate is the primary factor to be<br />
overviewed<br />
• The involvement of a transit country can<br />
•<br />
complicate the negotiations<br />
Gas infrastructure in the off-take markets needs<br />
to be sufficiently developed to allow a satisfactory<br />
off-take quantity to be introduced into the market<br />
<strong>and</strong> to render the pipeline profitable<br />
• The off-take price of gas also needs to be<br />
competitive compared to incumbent fuels (such<br />
as coal or hydroelectric generating stations)<br />
•<br />
Partner countries along the gas value chain profit<br />
from being linked to international institutions,<br />
which reduce the transaction costs <strong>and</strong> ease the
<strong>Energy</strong> <strong>Security</strong>: Potential for EU-GCC Cooperation<br />
enforcement of the contracts. This can be seen<br />
as referring directly to the <strong>Energy</strong> Charter Treaty,<br />
designed to perform the mentioned tasks, but<br />
still not ratified by Russia.<br />
1.4 Resource Nationalism<br />
Every country in the world is indeed resource<br />
nationalist in the sense that it wants to harvest the<br />
most fruits out of its soil. The reality is that while in<br />
the past International Oil Companies (IOCs) could<br />
easily manage the rate of depletion of the fields<br />
they were operating <strong>and</strong> could easily prospect<br />
foreign territories, nowadays those prerogatives<br />
have fallen back in the h<strong>and</strong>s of the national<br />
governments.<br />
Some authors 7 have argued that the NOCs have<br />
different stakeholders from IOCs <strong>and</strong>, therefore,<br />
a different way of envisaging their activity. They<br />
play an important role in their domestic economies,<br />
need to satisfy actors other than international<br />
investors, <strong>and</strong> sometimes play the role of an<br />
instrument of foreign policy. The maximization of<br />
the benefits is consequently “one of the variables<br />
in the equation” <strong>and</strong> not the only one, which has<br />
led some to argue that NOCs take less efficient<br />
decisions than IOCs. This being said, the situation<br />
greatly varies depending on the country as each<br />
state has a specific attitude, some behaving in more<br />
efficient ways than others.<br />
Resource nationalism is not different from any<br />
other foreign policy issue; countries protect their<br />
interests, like they always have. For example, Saudi<br />
Arabia directs gas to the production of chemicals<br />
<strong>and</strong> uses this resource to propel the industrialization<br />
of the country; therefore, it has no intention to<br />
export gas. Can this be called resource nationalism?<br />
It is rather the logical expression of a development<br />
strategy. The EU will have to deal with this like it<br />
would any other issue of international economics;<br />
resource nationalism per se should not be considered<br />
as a cause for heightened concern.<br />
2.Risk Quantification by source<br />
As we have outlined the major geopolitical<br />
factors threatening the global natural gas industry,<br />
the discussion now needs to be focussed on the<br />
analysis of each major gas source so as to determine<br />
individual weaknesses <strong>and</strong> opportunities.<br />
2.1. Russia<br />
Russia is today the EU’s largest external supplier<br />
of natural gas with about 196 bcm exported in 2008. 8<br />
It is also the country possessing the largest reserves<br />
in the world (44.38 tcm), the second largest producer<br />
(527.5bcm) <strong>and</strong> the largest natural gas exporter.<br />
Russia has been a reliable partner for its main<br />
clients for decades, <strong>and</strong> it is likely to remain one in the<br />
future. Historical experience shows that even during<br />
periods of heightened tensions between the West<br />
<strong>and</strong> the Soviet Union, supplies were not cut. In the<br />
recent past, three unfortunate incidents involving<br />
Europe’s gas supplies occurred, which fuelled fears<br />
<strong>and</strong> motivated many to call for a reduction of the<br />
dependence on Russia <strong>and</strong> an increased quest for<br />
alternative sources, which led to the emergence of<br />
the Nabucco <strong>project</strong>. 9<br />
All Russian gas is exported by pipeline. This<br />
assures the customer at the end of the pipeline that<br />
the gas flow cannot be diverted easily <strong>and</strong> quickly.<br />
When political motivations are balanced by economic<br />
interests, the mutual dependence between Russia<br />
<strong>and</strong> the EU is a factor that limits, to a great extent,<br />
unilateral decisions. On the other h<strong>and</strong>, countries<br />
allowing the pipeline to go through their territories<br />
can exert pressure on either the producer or the<br />
customer. Therefore, Russia is a reliable partner over<br />
the long run, but can present significant risks in the<br />
short term, whether those risks are directly created<br />
by Russia or by third countries.<br />
Russian gas export routes all point in the<br />
direction of Europe <strong>and</strong> are concentrated in Ukraine.<br />
The Ukrainian problem has motivated Russia to find<br />
new routes to reach West <strong>European</strong> markets. Both<br />
the Nord Stream <strong>and</strong> South Stream <strong>project</strong>s follow<br />
this logic.<br />
The growing ties between Russia <strong>and</strong> China have<br />
been deemed to have the potential to divert gas<br />
flows away from Europe. Chinese energy needs have<br />
grown dramatically in the last few years, but the usage<br />
of natural gas remains relatively limited. However,<br />
several import <strong>project</strong>s have caught the attention<br />
of observers. For the small volumes imported until
now, China has preferred the LNG option. Pipelines<br />
are now on the agenda, <strong>and</strong> a first link to import gas<br />
from Kazakhstan, Uzbekistan <strong>and</strong> Turkmenistan<br />
became operational in December 2009. 10<br />
It would take decades for gas flows towards<br />
China to equal those towards Europe. Russian gas<br />
exports to East Asia will continue <strong>and</strong> certainly<br />
exp<strong>and</strong>, but Russia will be able to keep on supplying<br />
Europe <strong>and</strong> slowly exp<strong>and</strong> its Asian markets.<br />
Russia’s internal situation <strong>and</strong> domestic market<br />
are likely to have more direct influence on gas<br />
supply issues than China. Indeed, Russia’s available<br />
export surplus is determined by domestic political<br />
<strong>and</strong> social factors. Two major factors have broad<br />
implications for the security of <strong>European</strong> supplies:<br />
domestic prices <strong>and</strong> investments.<br />
Gas prices in Russia are extremely low compared<br />
to export prices, about $43/1000 cm for industrial<br />
users <strong>and</strong> $32/1000cm for individual users 11 against<br />
around $275/1000cm on average in 2009 for Western<br />
Europe. Western <strong>European</strong> markets represent<br />
70 percent of Gazprom’s profits. Consequently,<br />
Gazprom is constantly pushing the government to<br />
increase domestic prices. The Russian government<br />
has promised to put industrial prices on par with<br />
export prices from 2011. The increase of prices for<br />
individual users is considered too politically sensitive<br />
<strong>and</strong> is likely to remain untouched in the near future.<br />
If Russian industrial prices are increased, <strong>and</strong><br />
the Russian domestic market liberalized, the<br />
consequences for Europe would be very important.<br />
First of all, many observers agree that it would<br />
force Russian industrial infrastructure to become<br />
more efficient. Therefore, if less gas is consumed<br />
domestically, Gazprom (which still holds the state<br />
monopoly on exports) would have larger surpluses<br />
for exports. Those could potentially momentarily<br />
offset the decrease of output due to the lack of<br />
investment.<br />
Another consequence would be the end of<br />
friction between Russia <strong>and</strong> Central Asian producers.<br />
The latter would have no particular incentive to<br />
reach <strong>European</strong> markets if the Russian one offers a<br />
similar price level.<br />
The second problem concerns the lack of<br />
investment in infrastructure <strong>and</strong> exploration. As<br />
Geopolitical Issues of Europe’s Future Gas <strong>Supply</strong><br />
Jonathan Stern recently underlined, 12 <strong>European</strong><br />
gas dem<strong>and</strong> has significantly decreased because of<br />
the crisis <strong>and</strong> is difficult to predict in the long run.<br />
Moreover, if supply capacity became tight, supplies<br />
to the Russian domestic market <strong>and</strong> exports to CIS<br />
countries would likely be reduced before exports to<br />
Europe. It is also important to notice that Russia has<br />
no interest in massive investments in new production<br />
facilities, because tight supply allows prices to be<br />
kept higher than if supply was abundant, <strong>and</strong> it<br />
gives Russia leverage when negotiating contracts.<br />
Moreover, Dasseleer (2008) even notices that a<br />
present abundant supply would promote short-term<br />
deals over long-term take-or-pay contracts. The<br />
uncertainty on the markets <strong>and</strong> the EU’s insistence<br />
on diversifying its imports away from Russia does<br />
not favor accelerated investment; on the other<br />
h<strong>and</strong>, Russia has no particular interest in letting the<br />
situation deteriorate <strong>and</strong> thus risk being short of gas<br />
to fulfil its commitment in the future.<br />
2.2. Nigeria<br />
Nigeria is Africa’s first oil producer <strong>and</strong> also<br />
possesses large gas resources (about 5.22 tcm of<br />
proved reserves according to BP, 2009). The gas<br />
produced so far has largely been flared because<br />
of the lack of the necessary infrastructure. Today<br />
the flaring rate reaches 40 percent of a production<br />
of about 35 bcm/yr; (this rate used to rise up to 75<br />
percent a few years ago), which partly explains<br />
why Nigeria remains below its potential production<br />
capacity (35 bcm in 2008, while Egypt, for example,<br />
produced 59 bcm, according to BP).<br />
The relative distance of Nigeria from its export<br />
markets requires that exports take the form of LNG.<br />
A pipeline <strong>project</strong> connecting Algeria <strong>and</strong> Nigeria<br />
is under study (Trans-Saharan Gas Pipeline) but<br />
is subject to too much geopolitical instability to<br />
represent a real step forward for the overall gas<br />
industry. As in many other oil- <strong>and</strong> gas-producing<br />
countries, the government aims at increasing the<br />
domestic consumption of gas as a means to kickstart<br />
the development of the country. Nevertheless,<br />
it is not certain that the state will have the capacity<br />
to do this on a large scale, as the country lacks the<br />
most basic infrastructure.
<strong>Energy</strong> <strong>Security</strong>: Potential for EU-GCC Cooperation<br />
Nigeria possesses large gas reserves, but<br />
gas fields are quite scattered. This requires that<br />
important collection infrastructure is built. From<br />
the current 12bcm/yr, the potential domestic<br />
consumption could reach 35 to 40bcm/yr by 2030.<br />
The positive corollary of this rather low consumption<br />
for decades to come is that, providing appropriate<br />
investments are done, the production surplus that<br />
could be exported would be rather large.<br />
In fact, the export potential could increase from a<br />
small 21bcm today to 100bcm by 2030. While the EU<br />
countries are likely to remain the main customers of<br />
Nigerian gas, the US also may become an important<br />
buyer. However, the previous arguments do not<br />
take into account the instability of the Nigerian<br />
political l<strong>and</strong>scape. The area where most of oil<br />
<strong>and</strong> gas deposits lie, the Niger Delta, is plagued by<br />
constant unrest <strong>and</strong> violence since the Biafran war<br />
in 1967. Although the country’s regulations offer<br />
interesting prospects for IOCs, the possibility for<br />
effective work is greatly hindered by local politics.<br />
The characteristics of Nigerian politics render the<br />
country a potentially unreliable supplier.<br />
2.3 Norway<br />
Norway has traditionally been a very important<br />
gas supplier to Europe. Although it is not part of<br />
the EU, it follows EU regulations <strong>and</strong> has proved a<br />
perfectly reliable partner for decades. Important<br />
resources are still to be extracted (3,000 bcm)<br />
<strong>and</strong> perhaps even discovered. However, the OME<br />
expects Norway’s production to start declining after<br />
2030. This constitutes a potential risk, as Europe is<br />
dependent on Norwegian gas.<br />
2.4. North Africa<br />
In a recent report, C. Spencer has drawn a<br />
portrait in which Maghreb countries were depicted<br />
as less reliable than commonly believed. 13 Internal<br />
politics <strong>and</strong> the emergence of terrorist groups<br />
create areas of tension detrimental to the economic<br />
development of the region. However, while many<br />
producing countries face internal problems, they<br />
have proved reliable suppliers of oil or gas for many<br />
decades. Therefore, any political analysis should be<br />
analyzed critically.<br />
Spencer lists in particular three main threats<br />
common to Maghreb countries:<br />
• Challenges to authoritarianism: Many political<br />
leaders have managed to secure life-long grip<br />
over power (through constitutional amendments<br />
in Tunisia <strong>and</strong> Algeria). The conjunction of poor<br />
economic performance <strong>and</strong> loss of aura gained<br />
during the decolonization period offers the<br />
possibility of social disturbances.<br />
• Growth of Islamism <strong>and</strong> civil unrest: The<br />
•<br />
failure of the governments to foster economic<br />
development through Western-imported models<br />
has permitted the emergence of groups calling for<br />
the regeneration of the society by Islamic values.<br />
These groups range from political formations to<br />
terrorist organizations such as Al-Qaeda in the<br />
Islamic Maghreb. The latter remains a minority<br />
fringe, but the wider movement has the capacity to<br />
be “gently subversive” <strong>and</strong> to push for a completely<br />
alternative way to organize society <strong>and</strong> politics.<br />
Economic weakness (distorted development):<br />
A very large fraction of the population of those<br />
countries is composed of children <strong>and</strong> young<br />
adults. In Morocco <strong>and</strong> Algeria, about 250,000<br />
new job-seekers enter the work market each<br />
year <strong>and</strong> about 16 million jobs will need to be<br />
created by 2020 in the entire Maghreb region. If<br />
governments fail to do so, unemployment will<br />
certainly fuel social opposition to the established<br />
political order <strong>and</strong> encourage a growth in radical<br />
Islamic sentiment.<br />
2.4.1 Algeria<br />
Algeria possesses the 10th largest gas reserves<br />
with 4.5 tcm proved in 2008. 14 Those reserves are<br />
very large <strong>and</strong> concentrated in one field (Hassi<br />
R’Mel), while the rest of Algeria has remained<br />
largely under-exploited. New discoveries have been<br />
rare <strong>and</strong> have only allowed the compensation of gas<br />
already extracted, but more active prospecting <strong>and</strong><br />
reduction of flaring could drastically augment future<br />
production from 90 bcm/yr today to about 180 bcm/<br />
yr by 2030, according to OME’s <strong>project</strong>ions. 15<br />
On the geopolitical front, the problem of the<br />
status of Western Sahara <strong>and</strong> the differences<br />
between Algeria <strong>and</strong> Morocco should not be
considered an issue. Though the border has been<br />
closed since 1994 <strong>and</strong> relations between Algeria<br />
<strong>and</strong> Morocco can still be considered bad, it has never<br />
prevented the Maghreb-Europe pipeline (Pedro<br />
Duran Farell) from bringing gas to Spain. As of today,<br />
there is no reason why this would change.<br />
A source of greater concern is the course taken<br />
by domestic politics. In fact, “the real security<br />
threats are not so much transnational as local <strong>and</strong><br />
humans.” 16 Algeria has known decades of instability<br />
caused by the post-independence institutional<br />
chaos <strong>and</strong> the struggle against Islamic groups such<br />
as the FIS (Front Islamic du Salut) <strong>and</strong> GIA (Groupe<br />
Islamique Armé) in the 1990s. This has weakened<br />
the country, although direct terrorist threats in the<br />
northern part of the country <strong>and</strong> in urban centres<br />
seem to have become more sporadic in the last few<br />
years.<br />
In April 2009, President Bouteflika won the<br />
presidential elections for the third time. There<br />
is some concern owing to the fact that, to a large<br />
extent, the stability of the country is due to President<br />
Bouteflika’s control of the government, <strong>and</strong> he will<br />
not be able to retain power forever.<br />
If a radical Islamic political formation were to<br />
come to power in Algeria, the consequences on<br />
the management of mineral resources would be<br />
unpredictable.<br />
This, however, remains a low-probability risk.<br />
The AQIM group has been at the center of much<br />
discussion, but the probability that it may undertake<br />
a major terrorist action against energy infrastructure<br />
remains limited.<br />
Another uncertainty representing a risk for<br />
the future is the increasing domestic dem<strong>and</strong> for<br />
gas that could upset export strategies. President<br />
Bouteflika’s government wants to exp<strong>and</strong> Algeria’s<br />
domestic industrial capacity. Much of Algerian<br />
power generation comes from gas-fired stations,<br />
<strong>and</strong> the government has induced a switch from oil to<br />
gas consumption. If domestic consumption reaches<br />
50 bcm/yr by 2030, as the OME forecasts, it is hoped<br />
that the necessary investments in new fields will be<br />
performed in time so that exports are not affected<br />
(180 bcm/yr expected by 2030). It must also be noticed<br />
that Algerian domestic dem<strong>and</strong> may increase by 7.4<br />
Geopolitical Issues of Europe’s Future Gas <strong>Supply</strong><br />
percent per year on average <strong>and</strong> would thus double<br />
by the end of the next decade (2018), according to<br />
a report from the Algerian Ministry of <strong>Energy</strong> <strong>and</strong><br />
Mines presented on September 24, 2009. 17 Although<br />
it is doubtful that the country has the capacity to<br />
generate a growth rate capable of absorbing this<br />
increase, those figures nevertheless show the clear<br />
intention of the government to privilege domestic<br />
consumption of gas so as to maximize oil exports.<br />
The recent Algerian call for the rapid<br />
establishment of a gas OPEC so as to increase gas<br />
prices is a further cause of concern. Algeria’s former<br />
<strong>Energy</strong> <strong>and</strong> Mines Minister Chakib Khelil recently<br />
said that gas prices are “unjust” <strong>and</strong> should be “two<br />
times their current level.” 18 He also called for a new<br />
gas pricing system. Also, experts from the <strong>Energy</strong><br />
<strong>and</strong> Mines ministry have claimed that Algeria is<br />
committed to increasing the volume of gas being<br />
sold through short-term contracts or via the spot<br />
market. Two new LNG trains with a capacity of<br />
9mn tons/yr will come on-stream soon, which will<br />
allow the volumes sold spot to double, from 10bcm/<br />
yr today to 20bcm/yr by 2012. The development<br />
of the new LNG terminals in Arzew <strong>and</strong> Skikda<br />
could be a signal that Algeria wants to diversify its<br />
exports destination in order to be less dependent<br />
on Europe.<br />
However, facts tell us a different story. The<br />
construction of the Galsi pipeline, which will connect<br />
Algeria <strong>and</strong> Northern Italy (via Sardinia), <strong>and</strong> the<br />
impending entry into operation of the alreadyconstructed<br />
Medgas pipeline will help to strengthen<br />
EU-Algerian relations.<br />
2.4.2 Libya<br />
For the moment, Libya is a relatively small<br />
supplier of gas. The country has put little effort<br />
in exploration <strong>and</strong> shown only limited interest<br />
in the gas business. Its reserves are smaller than<br />
Algeria’s (1.5 tcm according to BP, 2009) but<br />
the country is also largely underexplored. The<br />
actual small production of 15 bcm/yr is expected<br />
to increase rapidly in the future <strong>and</strong> could reach<br />
55bcm/yr by 2030. 19 In 2008, only 10 bcm were<br />
exported (Eurostat, EIA), <strong>and</strong> only two <strong>European</strong><br />
countries, namely Italy <strong>and</strong> Spain, were supplied.
<strong>Energy</strong> <strong>Security</strong>: Potential for EU-GCC Cooperation<br />
Figure 1. Actual <strong>and</strong> Future Maghreb Export Capacity to Europe<br />
Source: OME Encouraged Del. 6 (2006)<br />
On the overall energy security picture, therefore,<br />
Libya represents a limited risk <strong>and</strong> an important<br />
opportunity.<br />
It must also be noticed that Libya’s export<br />
capacity is small <strong>and</strong> consists of one gasification<br />
facility <strong>and</strong> one undersea pipeline (Greenstream).<br />
Libya also has a long experience with LNG<br />
technology as it historically was the second largest<br />
exporter after Algeria. All these factors allow us to<br />
conclude that Libya possesses a large potential that<br />
could certainly benefit EU’s energy security. The<br />
government has shown clear interest in increasing<br />
gas production, especially for supplying the domestic<br />
market since much of the power generation is gasfired,<br />
alongside developing an export strategy.<br />
Libya’s population, at 6 million, is much smaller<br />
than Algeria’s; consequently, even if the domestic<br />
consumption increases by 2030 – from 6 bcm/yr now<br />
to 12 bcm/yr then – the impact on export capacities<br />
will remain minor.<br />
On the political side, the international situation<br />
of Libya has drastically improved since the lifting<br />
of EU <strong>and</strong> US sanctions in 2004. The largest risk<br />
comes from more internal factors <strong>and</strong> concerns the<br />
underdevelopment of government institutions <strong>and</strong><br />
the total absence of an institutional framework for<br />
the succession to the colonel.<br />
0<br />
2.4.3 egypt<br />
Egypt is, for the moment, a very<br />
small supplier of gas (5.7bcm in 2007<br />
to the EU out of a production of<br />
58bcm), but its geopolitical interest<br />
is great. It possesses around 2.13tcm<br />
of proved reserves, <strong>and</strong> there could<br />
be some 3.3tcm still to be found. This<br />
would position Egypt as an even<br />
larger potential supplier than Libya.<br />
Conversely, Egypt’s population is<br />
much larger than Libya’s <strong>and</strong> when the<br />
OME predicts that Egypt’s domestic<br />
gas consumption will reach 70bcm/yr<br />
in 2030, it leaves a much smaller share<br />
available for export. It is hoped that<br />
new fields coming on-stream will allow<br />
surplus volumes to grow in parallel<br />
with the domestic appetite. It must be<br />
noted that regulations require that a<br />
significant share of the reserves be left untouched. If<br />
production grows sufficiently to reach 120bcm/yr by<br />
2030 (OME’s <strong>project</strong>ions), around 50bcm/yr would be<br />
available for exports. The short-term problem is that<br />
Egypt lacks the infrastructure for large-scale exports.<br />
Only two solutions are available: LNG or the Arab<br />
Gas Pipeline, which bypasses Israel. This pipeline<br />
could potentially fill up Nabucco, but the realization<br />
of such a scenario is still very vague, <strong>and</strong> Egypt alone<br />
could not sustain Nabucco.<br />
2.5 The Fourth Corridor - Central Asia <strong>and</strong> the<br />
<strong>Gulf</strong> Region<br />
The so-called fourth corridor could potentially<br />
pool the resources from several areas: the Caucasus<br />
(Azerbaijan), the Caspian basin countries (Central<br />
Asia <strong>and</strong> Iran), <strong>and</strong> the Middle East countries (Iraq,<br />
Egypt, <strong>and</strong> potentially, Qatar), thus acting as an<br />
alternative route allowing Europe to diversify away<br />
from Russia, Norway <strong>and</strong> the Maghreb.<br />
The primary means of attracting those<br />
resources has materialized as the Nabucco<br />
pipeline. The pipeline, favored by the EU <strong>and</strong> the<br />
United States would rely, as of today, on Azeri<br />
production. Azerbaijan possesses the giant Shah<br />
Deniz field that could produce between 30 <strong>and</strong>
70bcm/yr by 2020. Even if only a fraction of this<br />
amount is devoted to export, this represents a<br />
very large potential supply for the EU <strong>and</strong> for the<br />
Nabucco pipeline. However, Shah Deniz will reach<br />
a plateau by 2020 <strong>and</strong> start declining afterwards.<br />
Moreover, Gazprom announced last April 2009 that<br />
it would start purchasing Azeri gas at <strong>European</strong><br />
prices ($350/1000cm according to the newspaper<br />
Kommersant) in 2010. It is clear that this move<br />
is intended primarily at attacking the viability of<br />
Nabucco, as Russia used to be a supplier of gas to<br />
Azerbaijan, not vice versa. Consequently, Nabucco<br />
needs a much wider country base to be profitable.<br />
Moreover, the Gazprom’s South Stream <strong>project</strong><br />
connecting Russia to Bulgaria with a pipeline under<br />
the Black Sea is a serious threat to the completion<br />
of Nabucco, as two <strong>project</strong>s of large capacities in<br />
the region would be mutually exclusive.<br />
The region has large reserves <strong>and</strong> a significant<br />
export potential, but the instability of the<br />
commitment of the most important potential<br />
suppliers as well as the potential competition to<br />
access those reserves significantly reduces its<br />
attractiveness. In terms of reserves, many of the<br />
countries presenting large potential are not the<br />
easiest to deal with, such as Iran, Turkmenistan <strong>and</strong><br />
Iraq; Qatar, on the other h<strong>and</strong>, offers much more<br />
interesting perspectives.<br />
2.5.1 the Caspian Basin <strong>and</strong> Central Asia: the<br />
new Great Game<br />
In Central Asia, the most important resources<br />
Table 1: Greater Caspian Basin Proven Reserves<br />
Proven Reserves at end 2008<br />
Trillion cubic meters<br />
Share of<br />
world total Rank<br />
Iran 29.61 16.0% 2<br />
Turkmenistan 7.94 4.3% 4<br />
Iraq 3.17 1.7% 12<br />
Kazakhstan 1.82 1.0% 18<br />
Uzbekistan 1.58 0.9% 21<br />
Azerbaijan 1.20 0.6% 25<br />
Source: BP 2009<br />
Geopolitical Issues of Europe’s Future Gas <strong>Supply</strong><br />
are located on the Eastern side of the Caspian<br />
Sea (mainly Turkmenistan – <strong>and</strong>, in fact, mostly in<br />
Eastern Turkmenistan, close to the Afghan border).<br />
From there, only three routes can be taken to<br />
establish a link to Europe:<br />
• through Russia, which makes no sense as it is<br />
precisely what the EU wants to avoid.<br />
• through Iran, which would make much sense<br />
geographically <strong>and</strong> geologically, as the country<br />
possesses the second largest reserves in the world<br />
<strong>and</strong> a pipeline connecting southern Turkmenistan<br />
<strong>and</strong> Iran already exists; it was initially designed<br />
to supply gas to Iran <strong>and</strong> Turkey <strong>and</strong> later on to<br />
Europe. It was not completed not only because<br />
of the lower-than-expected Turkish natural gas<br />
needs but also because of Turkmenistan’s lack<br />
of real commitment to any <strong>project</strong> bypassing<br />
Russia. Also, a major impediment resides in the<br />
well-publicized poor political characteristics of<br />
Iran <strong>and</strong> its difficult relations with the Western<br />
world. Although Europe would greatly benefit<br />
from Iranian gas, it seems politically unfeasible for<br />
the moment because of international sanctions<br />
on Iran (also threatening Western companies<br />
having activities in Iran) <strong>and</strong> because of manifest<br />
demonstrations of aggressiveness coming from<br />
the Iranian side.<br />
• Directly across the Caspian Sea <strong>and</strong> into Turkey.<br />
This third route would be an effective alternative<br />
<strong>and</strong> could help materialize the hoped-for fourth<br />
corridor. It could, for instance, fill up Nabucco.<br />
But there are three reasons why the Trans-<br />
Caspian route is potentially hazardous. First of<br />
all, a pipeline under the Caspian Sea would need<br />
to be built, <strong>and</strong> this is impossible as long as the<br />
territorial status of the sea is not settled. Secondly,<br />
it crosses the Caucasus, which is far from being<br />
a model of stability. Finally, the reliability of the<br />
supply on the Turkmen <strong>and</strong> Kazakh ends is far<br />
from guaranteed. One could also add that the<br />
cost of the <strong>project</strong> would be prohibitive.<br />
Concerning the legal status of the Caspian Sea,<br />
Bahgat (2007) writes:<br />
“According to the United Nations Convention<br />
on the Law of the Sea, nations bordering a sea may<br />
claim 12 miles from shore as their territorial waters<br />
1
<strong>Energy</strong> <strong>Security</strong>: Potential for EU-GCC Cooperation<br />
<strong>and</strong> beyond that a 200-mile exclusive economic zone<br />
(EEZ). If the Law of the Sea convention were applied<br />
to the Caspian, full maritime boundaries of the five<br />
littoral states bordering it would be established<br />
based upon an equidistant division of the sea <strong>and</strong><br />
undersea resources international sectors. If the<br />
Law were not applied, in other words if the basin<br />
is considered a lake, the Caspian <strong>and</strong> its resources<br />
would be developed jointly – a division referred to<br />
as the condominium approach. After more than a<br />
decade since the breakup of the Soviet Union, the<br />
five littoral states have not agreed on whether to<br />
characterize the Caspian as a sea or a lake.” 20<br />
Russia favors the median line solution where the<br />
Caspian Sea is divided according to a line running<br />
across the seabed at the same distance from both<br />
opposite shores. Russia, Kazakhstan <strong>and</strong> Azerbaijan<br />
have already agreed (in 1998 <strong>and</strong> 2001) to divide<br />
the Northern part of the Sea based on this criterion.<br />
Iran presents a roadblock as it dem<strong>and</strong>s that the Sea<br />
be divided equally between every coastal country<br />
(20 percent of the sea surface <strong>and</strong> seabed for each<br />
of them). Finally, what is most important for the<br />
purpose of building the Trans-Caspian Pipeline is an<br />
agreement between Turkmenistan <strong>and</strong> Azerbaijan<br />
as the pipe would connect those two countries.<br />
They have agreed that the section of the Sea shared<br />
Figure 2. Major Caspian Existing <strong>and</strong> Potential Pipelines<br />
Source: Platts (cited in chapter 5.2.3)<br />
2<br />
between them should be divided according to the<br />
median line principle, but they have disagreed on<br />
the exact position of that line.<br />
Consequently, it must be remarked that there is<br />
no viable solution to fill in Nabucco in Central Asia<br />
<strong>and</strong> over the short term. From that perspective, a<br />
pipeline originating from the <strong>Gulf</strong> <strong>and</strong> reaching<br />
Turkey directly could be a satisfactory solution.<br />
In the perspective of the <strong>Gulf</strong> countries, a last<br />
solution to create the fourth corridor is through<br />
Iraq <strong>and</strong> Turkey.<br />
Central Asian resources were not used to their<br />
maximum potential due to the inclusion of those<br />
countries in the Soviet Union. The disintegration of<br />
the USSR has, so to speak, brought those resources<br />
to a market in need of an alternative to the Middle<br />
East concerning oil <strong>and</strong> to Russia concerning gas. It<br />
is therefore logical that this attracted the attention<br />
of all the surrounding powers. First of all, Russia<br />
still has very strong ties in the region <strong>and</strong> has the<br />
advantage of being connected to those countries<br />
by the Soviet gas <strong>net</strong>work. Presidents Vladimir<br />
Putin <strong>and</strong> then Dmitry Medvedev have been active<br />
in strengthening these ties. Secondly, Europe sees<br />
Central Asia as a means to reduce the dependence<br />
on Russia. Finally, China could tap Eastern Siberian<br />
reserves; but China is unlikely to accept being<br />
dependent on Russia. Therefore, it will try to<br />
access Central Asian resources. Central Asian<br />
countries represent a potential for new diplomatic<br />
ties for Beijing <strong>and</strong> they offer China the possibility<br />
to create a sort of buffer zone on its Western<br />
border. 21 •<br />
In any case, China is slowly extending<br />
its <strong>net</strong>work in the region <strong>and</strong> has increased<br />
trade with those countries in the past years. The<br />
Turkmenistan-China pipeline has been completed<br />
<strong>and</strong> is now operational <strong>and</strong> connects Kazakhstan,<br />
Uzbekistan <strong>and</strong> Turkmenistan to China. There<br />
is no reason that the <strong>project</strong> will not be fully<br />
implemented, <strong>and</strong> it could allow the supply of up<br />
to 40bcm/yr of gas to China in a few years.<br />
Therefore, one realizes that Central Asian<br />
countries can play three games, with three<br />
different actors. It would be a mistake to see those<br />
countries as flexible <strong>and</strong> powerless as they were<br />
right after the events of 1991. The simple fact
that Russia <strong>and</strong> China have started an upward move<br />
regarding the prices they offer for Central Asian gas<br />
proves that both Kazakhstan <strong>and</strong> Turkmenistan<br />
will take advantage of their position to maximize<br />
the revenues from their natural resources. Despite<br />
<strong>European</strong> <strong>and</strong> American eagerness to open up the<br />
region, the physical <strong>and</strong> geopolitical variables at<br />
play seem to have established a tripartite game<br />
between China, Russia <strong>and</strong> the Central Asian states,<br />
thus excluding <strong>European</strong> interests. The successful<br />
completion of a Trans-Caspian pipeline or Iranian<br />
bypass could change the nature of the game <strong>and</strong><br />
increase the attractiveness of <strong>European</strong> markets;<br />
but the pre-requisite for these solutions to be<br />
implemented is that Central Asian countries commit<br />
themselves to directly supplying the West. This is a<br />
vicious circle, from which an exit remains distant.<br />
Turkmenistan embodies the major difficulties<br />
inherent in dealing with Central Asia. Any pipeline<br />
aiming at bypassing Russia would necessarily enter<br />
into direct competition with the Central Asian Center<br />
transmission system inherited from the Soviet period.<br />
For such a <strong>project</strong> to receive the green light, it would<br />
need to be profitable. For Turkmenistan, it would<br />
mean the disadvantage of having to pay for it, while<br />
the pipeline to Russia already exists <strong>and</strong> is amortized;<br />
but, at the same time, the <strong>project</strong> would also present<br />
it with the advantage of avoiding Russian intake<br />
prices <strong>and</strong> transit fees <strong>and</strong> supplying end markets<br />
directly. For the partner company or country, it<br />
presents the disadvantage of having to fund an<br />
Figure 3. The Future Turkmenistan-China Pipeline<br />
Source: Platts (cited in Chapter 5.2.3)<br />
Geopolitical Issues of Europe’s Future Gas <strong>Supply</strong><br />
extremely expensive <strong>project</strong> <strong>and</strong> not being sure that<br />
Turkmenistan will fully respect its commitments.<br />
Moreover, Russia <strong>and</strong> Turkmenistan have<br />
apparently solved their disputes over prices for the<br />
time being, <strong>and</strong> Russia probably acknowledges<br />
the importance of remaining the principal buyer<br />
of Turkmen gas. Under those circumstances, the<br />
prospects of connecting Turkmenistan more<br />
directly to Southern Europe <strong>and</strong> the Balkans seem<br />
significantly compromised. This is even truer since<br />
a new <strong>and</strong> cheaper export destination has opened<br />
eastward, in China.<br />
3.the <strong>Gulf</strong> <strong>and</strong> the security of europe’s<br />
Gas supplies<br />
The <strong>Gulf</strong> region holds the largest gas reserves in<br />
the world, is significantly unexplored (concerning<br />
gas), <strong>and</strong> its gas resources lie geographically closer<br />
to Europe than Russian resources. <strong>Gulf</strong> countries<br />
could become the major source of supply for a<br />
potential fourth corridor <strong>and</strong> for filling up Nabucco,<br />
if dealing with Central Asia proves unsuccessful for<br />
the EU. Unlike Central Asia, <strong>Gulf</strong> countries enjoy easy<br />
access to the high seas <strong>and</strong> are not constrained with<br />
previously existing infrastructure; transit risks are<br />
thus much smaller than for other regions. Moreover,<br />
gas is generally found in large deposits thus making<br />
the extraction much easier than in countries such as<br />
Nigeria. On the other h<strong>and</strong>, in terms of economic<br />
<strong>and</strong> political characteristics the countries of the<br />
region – both those with major export potential<br />
<strong>and</strong> those whose resources are<br />
limited – differ substantially.<br />
Iran <strong>and</strong> Qatar possess the<br />
world’s second <strong>and</strong> third largest<br />
reserves, respectively; Saudi<br />
Arabia, the UAE <strong>and</strong> Iraq also<br />
possess large reserves. Despite<br />
promising prospects, <strong>Gulf</strong><br />
countries offer mixed insights<br />
concerning export potentials<br />
<strong>and</strong> geopolitical stability. Three<br />
variables can be highlighted:<br />
• Domestic consumption<br />
• Internal political stability<br />
• Foreign relations stability
<strong>Energy</strong> <strong>Security</strong>: Potential for EU-GCC Cooperation<br />
Only countries which respond positively to<br />
these three criteria may be considered potentially<br />
important future supply sources.<br />
Domestic consumption will be the primary<br />
factor that will determine the volumes of natural<br />
gas available for export by the <strong>Gulf</strong> countries <strong>and</strong><br />
will certainly constrain future exports. Countries<br />
with significant oil production – such as Saudi Arabia,<br />
the UAE <strong>and</strong> Iran – or wishing to develop domestic<br />
industries (petrochemicals) <strong>and</strong> infrastructure<br />
(power plants <strong>and</strong> desalination facilities) will use gas<br />
either to re-inject it in oil fields or as a substitute to<br />
oil for the domestic economy. Consequently, the<br />
share of gas available for export could be extremely<br />
low (close to 20 percent, if not less). Saudi Arabia,<br />
in particular, could be an important exporter of<br />
gas but has a policy to reserve gas for domestic<br />
consumption.<br />
Other producers from the <strong>Gulf</strong>, such as Kuwait<br />
<strong>and</strong> Oman, have produced limited quantities of gas<br />
so far <strong>and</strong> are not likely to become major exporters.<br />
Political instability is the greatest in Iraq <strong>and</strong> Iran.<br />
Iraq is just slowly coming out of a seven-year war <strong>and</strong><br />
is as far as a country can be from being a stable state<br />
presenting the attributes of a solid government <strong>and</strong><br />
a unified population. As noted by Stansfield: 22<br />
Iraq has fractured into regional power bases.<br />
Political, security <strong>and</strong> economic power has devolved<br />
to local sectarian, ethnic or tribal political groupings.<br />
The Iraqi government is only one of several ‘statelike’<br />
actors. The regionalization of Iraqi political<br />
Table 2. <strong>Gulf</strong> Countries’ Proven Reserves<br />
Natural gas:<br />
Proved reserves at end 2008<br />
Trillion<br />
cubic Share of<br />
metres world total<br />
Iran 29.61 16.0%<br />
Qatar 25.46 13.8%<br />
Saudi Arabia 7.57 4.1%<br />
United Arab Emirates 6.43 3.5%<br />
Iraq 3.17 1.7%<br />
Kuwait 1.78 1.0%<br />
Oman 0.98 0.5%<br />
Yemen 0.49 0.3%<br />
Bahrain 0.09<br />
(Source: BP 2009)<br />
4<br />
life needs to be recognized as a defining feature of<br />
Iraq’s political structure.<br />
Moreover, the recent departure of US troops<br />
from the Iraqi soil is in itself a supplementary cause<br />
for concern, as this event could lead to even more<br />
instability.<br />
Oil production in Iraq is unlikely to reach the levels<br />
prevalent under the Saddam Hussein regime any<br />
time soon. This applies to gas even more because of<br />
the higher complexity of the infrastructure required.<br />
Nevertheless, Iraq should not be dragged out of the<br />
natural gas geopolitical map, as the northern side<br />
of the country (Kurdistan) enjoys a certain degree<br />
of autonomy <strong>and</strong> could reach a higher level of oil<br />
<strong>and</strong> gas productivity than the rest of the country.<br />
Kurdistan could be seen as one of the major suppliers<br />
of the Nabucco <strong>project</strong>.<br />
Moreover, from a <strong>Gulf</strong> perspective, Iraq is the<br />
shortest l<strong>and</strong> route towards Turkey <strong>and</strong> Europe.<br />
Relying on a pipeline linking Qatar to Turkey<br />
through Iraq seems an unwise prospect over the<br />
short term because of the insecure environment in<br />
Iraq; but this solution must not be discarded though<br />
its potential implementation will depend on the<br />
political evolution of the region.<br />
It is difficult to foresee the evolution of Iran,<br />
but although the country experienced episodes<br />
of violence <strong>and</strong> social unrest recently, after the<br />
contested re-election of President Mahmoud<br />
Ahmadinejad, the regime holds the reins of power<br />
firmly <strong>and</strong> it is difficult, although not impossible, to<br />
foresee a drastic alteration of its policy.<br />
What is more important than the protests in the<br />
streets of Tehran are the power games played behind<br />
the scenes between the clerical leaders, opposition<br />
parties <strong>and</strong> the leader of the Expediency Discernment<br />
Council (Akbar Rafsanjani). These actors have<br />
often supported diverging views <strong>and</strong> policies which<br />
have prevented major advances from taking place.<br />
Instead, in most cases, these differences have led to<br />
stalemates <strong>and</strong> prevented the development of major<br />
infrastructure, with the paradoxical consequence that<br />
Iran has failed several times to honor its commitments<br />
in gas-exporting <strong>project</strong>s.<br />
Gas exports from Iran remain controversial<br />
<strong>and</strong> a strong current exists in the Iranian Majlis
(Parliament) which favors the use of gas exclusively<br />
for domestic consumption. While the government<br />
authorities officially favor export <strong>project</strong>s <strong>and</strong><br />
ostensibly promote them, in fact the only operational<br />
export <strong>project</strong> is the pipeline to Turkey, which has<br />
witnessed throughput shortfalls in winter, when gas<br />
is required by the domestic Iranian market.<br />
On the foreign relations side, Iran is in a difficult<br />
situation because of the nuclear issue. The enrichment<br />
of uranium <strong>and</strong> its potential military use are posing a<br />
great obstacle for Iran in the international arena. The<br />
hardline leadership of the country shows little signs<br />
that its position concerning the dossier will change<br />
in the near future, <strong>and</strong> a hypothetical invasion by<br />
foreign troops would be the worst case scenario<br />
concerning gas infrastructure. Consequently, Iran is<br />
not officially considered by the EU as a c<strong>and</strong>idate for<br />
filling up Nabucco.<br />
To sum up, both Iran <strong>and</strong> Iraq are places<br />
where investments in the energy sector, <strong>and</strong> gas<br />
in particular, seem currently difficult; but the<br />
geographical positions of those two countries,<br />
which share a border with Turkey, <strong>and</strong> their very<br />
large resources, place them in a “hardly avoidable<br />
category” as future suppliers of gas to the EU. There<br />
is no easy solution to this dilemma, but if <strong>European</strong><br />
needs increase, <strong>and</strong> if a certain diversification is to<br />
happen, these two countries are likely to become<br />
necessary partners in a medium- to long-term<br />
perspective.<br />
Today, the only country in the region presenting<br />
stable political characteristics with low oil production<br />
<strong>and</strong> a small population is Qatar. Qatari production<br />
<strong>and</strong> exports keep increasing, <strong>and</strong> the OME predicts<br />
a marketed production as high as 200 bcm by 2020<br />
<strong>and</strong> 300 bcm by 2030. Qatar uses LNG as its export<br />
vehicle; this means that potential supplies to Europe<br />
would be in relatively high competition with Asian<br />
<strong>and</strong> North American dem<strong>and</strong>s due to the flexibility<br />
of LNG exports.<br />
Nevertheless, Europe is likely to remain the<br />
major importing market for natural gas in the world,<br />
which should attract the attention of producing<br />
countries. Moreover, Europe imports very limited<br />
amounts of Qatari gas for the time being (7.9 bcm<br />
in 2009, according to BP), which goes to Spain,<br />
Geopolitical Issues of Europe’s Future Gas <strong>Supply</strong><br />
Belgium, the UK <strong>and</strong> Italy. Qatar represents a<br />
very important opportunity for diversification of<br />
<strong>European</strong> gas supplies, <strong>and</strong> it presents very limited<br />
geopolitical risks. Even if competition is fierce, in<br />
absolute figures an important quantity of gas could<br />
be allocated to Europe <strong>and</strong> specifically to countries<br />
which still lack diversification possibilities (such as<br />
Pol<strong>and</strong>, which is expected to start importing from<br />
Qatar very soon, <strong>and</strong> Greece). Qatar is, therefore,<br />
considered a strategic future supplier of gas to the<br />
EU.<br />
4.the Increase of LnG trade<br />
Currently, LNG represents about 30 percent<br />
of total gas trade, but the proportion is likely to<br />
increase as LNG transportation costs decrease. The<br />
higher flexibility of gas shipments would have several<br />
impacts. It would, for example, allow the emergence<br />
of a more important spot market for gas. At present,<br />
only a few places play this role (mainly the Henry<br />
Hub in the US, the National Balancing Point in the<br />
UK, <strong>and</strong> Zeebrugge on continental Europe), but if<br />
the roles of the <strong>European</strong> hubs increase, they would<br />
acquire acceptance as price discovery tools. A gas<br />
spot market would probably augment the volatility<br />
of prices <strong>and</strong> could both reduce security of supply<br />
<strong>and</strong> play the role of an emergency tool.<br />
Gas prices are for the moment pegged to<br />
oil prices because gas contracts are bilateral<br />
<strong>and</strong> infrastructure is fixed, which makes gas an<br />
illiquid asset. However, Jonathan Stern (2007)<br />
has argued that the link between oil <strong>and</strong> gas is<br />
becoming less relevant because switching capacity<br />
in power generation facilities is increasingly being<br />
ab<strong>and</strong>oned. 23 Therefore, using oil to price gas is<br />
going to be more a matter of strategy <strong>and</strong> politics<br />
rather than a physical necessity.<br />
Facilitated competition for gas between various<br />
actors may be brought about by an increase of<br />
LNG trade involving Europe, North America <strong>and</strong><br />
East Asia. For example, Qatar will serve both the<br />
Atlantic basin <strong>and</strong> the Pacific basin, while Trinidad<br />
<strong>and</strong> Tobago will play the arbitrage between North<br />
America <strong>and</strong> Europe. Algeria <strong>and</strong> African exporters,<br />
primarily Nigeria, could also divert some of their<br />
exports to the US.
<strong>Energy</strong> <strong>Security</strong>: Potential for EU-GCC Cooperation<br />
Although the long-term trend points to LNG<br />
taking a growing share of gas trade, future global<br />
gas requirements are very difficult to predict. The<br />
development of Alberta tar s<strong>and</strong>s would require<br />
extensive use of Canadian gas, which would<br />
subsequently not be available for export to the US.<br />
On the other h<strong>and</strong>, the US possesses very large<br />
unconventional gas reserves. As the IEA notes: “In<br />
the reference scenario, unconventional gas output<br />
worldwide rises from 367 bcm in 2007 to 629<br />
bcm in 2030, with much of the increase coming<br />
from the United States <strong>and</strong> Canada. The share of<br />
unconventional gas in total US gas production rises<br />
from over 50% in 2008 to nearly 60% in 2030.” 24<br />
If the US starts producing such large volumes<br />
of unconventional gas, its need for imported LNG<br />
would be much lower. China’s <strong>and</strong> India’s needs<br />
also are difficult to predict. It is therefore not<br />
certain that the gas market will favor sellers in the<br />
future, <strong>and</strong> it is also not certain that the increase<br />
of LNG trade will bring competition detrimental to<br />
<strong>European</strong> energy security. LNG transportation costs<br />
will never be as low as for oil, <strong>and</strong> regasification<br />
plants are still relatively few (although this is about<br />
to change).<br />
The gas market will most probably continue to<br />
primarily use long-term contracts in order to share<br />
the heavy upstream investment costs between the<br />
producer <strong>and</strong> the customer. Nevertheless, shortterm<br />
contracts <strong>and</strong> spot sales will have growing<br />
importance in satisfying marginal changes in the<br />
dem<strong>and</strong>/supply relationship. LNG will also allow<br />
for a greater fluidity of the market <strong>and</strong> allow the<br />
EU to partially diversify its sources by tapping<br />
exporters inaccessible by pipelines. Concerning<br />
geopolitical issues, LNG is not fully risk-free. The<br />
entire transportation chain could be threatened by<br />
terrorist acts <strong>and</strong> the explosion of a regasification<br />
plant could have a very negative influence on the<br />
public perception of this energy source. Maritime<br />
routes also present certain risks. However, the<br />
probabilities of such events remain small, <strong>and</strong> even<br />
if one occurred, its consequences would be minor<br />
for global trade.<br />
The role of LNG is growing in Europe <strong>and</strong><br />
regasification capacities are exp<strong>and</strong>ing, with new<br />
plants currently being built in Spain, Italy, the<br />
Netherl<strong>and</strong>s <strong>and</strong> Sweden <strong>and</strong> more proposed<br />
in almost all <strong>European</strong> countries possessing a<br />
coastline (Germany, the Balkans, France, UK,<br />
Irel<strong>and</strong>, Lithuania, Romania, <strong>and</strong> Ukraine). 25 This<br />
means that the willingness to import more LNG is<br />
present in Europe; among other factors, the need<br />
for increased flexibility is a major determinant of<br />
this trend. Also, LNG must be seen by the EU as<br />
a way to increase security of supply in countries<br />
poorly linked to the main <strong>net</strong>work (Baltic States<br />
<strong>and</strong> Balkans). In particular, Greece has recently<br />
shown interest in increasing the capacity of the<br />
Revithoussa regasification plant, in order to<br />
become a hub for supplying gas to the rest of the<br />
region (notably, Bulgaria <strong>and</strong> Serbia). Producing<br />
countries such as Qatar should view this as a<br />
positive sign that LNG is an energy source that<br />
will grow in the coming years <strong>and</strong> that, despite the<br />
buyer’s market experienced currently, is certainly<br />
worth being developed.<br />
To sum up, LNG will hardly become a major<br />
geopolitical risk <strong>and</strong>, while it is not a panacea, will<br />
provide additional security of supply for EU countries<br />
by offering some diversification possibilities. It could<br />
also offer leverage for those countries to counter the<br />
dominant attitude of producer <strong>and</strong> transit countries,<br />
in case the latter fail to honor their engagements or<br />
try to take advantage of their position.<br />
5.Unconventional Gas<br />
Unconventional has been one of the hottest<br />
topics in the gas industry in recent years. Unlike<br />
conventional gas, which is gas that has been trapped<br />
in large pools by impermeable rock, unconventional<br />
gas can be divided into four different types:<br />
• Tight S<strong>and</strong>s Gas – formed in s<strong>and</strong>stone or<br />
carbonate.<br />
• Coalbed Methane (CBM) – formed in coal<br />
deposits.<br />
• Shale Gas – formed in fine-grained shale rock<br />
(called gas shales)<br />
•<br />
Methane Hydrates – a crystalline combination of<br />
natural gas <strong>and</strong> water<br />
The breakthrough of new technology in the US,<br />
which has led to massive increases in the production
of unconventional gas, has already had significant<br />
impact on the EU gas market via world LNG trade<br />
flows <strong>and</strong> spot market prices for gas.<br />
The increase in US indigenous production has<br />
led to a change in worldwide LNG trade flows in<br />
the few last years. <strong>European</strong> gas spot market prices<br />
have decoupled from oil <strong>and</strong> pipeline gas prices.<br />
Lower spot market prices in the EU led to a<br />
temporary change of Russian long-term contracts:<br />
a 15 percent gas-to-gas price component in the<br />
long-term contracts was introduced <strong>and</strong> will be<br />
valid for three years. The decoupling of gas prices<br />
is due to the economic <strong>and</strong> financial crisis <strong>and</strong> the<br />
decline in gas dem<strong>and</strong>, not just to changes in LNG<br />
flows.<br />
With the decline in LNG dem<strong>and</strong> in the US, more<br />
LNG has found its way to the EU. The decrease in US<br />
dem<strong>and</strong>, in combination with the fact that additional<br />
liquefaction capacity has come online from Qatar<br />
<strong>and</strong> elsewhere in the same period, has encouraged<br />
EU gas importers to increase LNG purchases. This<br />
results in increased diversification of EU imports <strong>and</strong><br />
increases flexibility, facilitating the replenishment<br />
of gas storage after the very cold winter of 2009.<br />
LNG imports into the EU increased by 26 percent,<br />
from around 50 bcm in 2008 to 63 bcm in 2009. This<br />
happened despite an overall decrease of 6 percent<br />
in EU natural gas dem<strong>and</strong>.<br />
In short, unconventional gas has increased<br />
world gas reserves <strong>and</strong> production, <strong>and</strong> LNG has<br />
allowed regional developments to impact the<br />
world gas market. Regardless of whether the EU<br />
will be able to replicate the production revolution<br />
witnessed in the US, the increasing supply of<br />
unconventional gas has already had significant<br />
influence on the world gas market <strong>and</strong> thus on<br />
the EU, where it has put a downward pressure on<br />
gas prices. However, if unconventional gas turns<br />
into a waiting game for global gas investments,<br />
then this could lead to a serious security of supply<br />
threat because of the long lead-times for gas<br />
infrastructure <strong>project</strong>s.<br />
5.1 Unconventional Gas Reserves in Europe 26<br />
Currently, Europe has an estimated 5.4 tcm<br />
(trillion cubic meters) of proven reserves enough to<br />
Geopolitical Issues of Europe’s Future Gas <strong>Supply</strong><br />
meet approximately 10 years of EU consumption.<br />
When it comes to unconventional gas resources,<br />
these reserves become significantly higher as total<br />
resources are estimated at approximately 35 tcm for<br />
Europe. Gas recovery rates vary from around 8 to 30<br />
percent, but this could increase to approximately<br />
40 percent with a production cost of around $100<br />
to $300 per 1000 m3 in the long run, according to<br />
IEA estimates. At recovery rates of 40 percent, this<br />
would mean an increase in <strong>European</strong> gas reserves<br />
from 5.4 TCM to 19.4 tcm.<br />
Assuming an annual indigenous <strong>European</strong><br />
production (EU <strong>and</strong> Norway) of 300bcm per<br />
year, we can assume that indigenous <strong>European</strong><br />
production, at 300bcm per year, could be<br />
extended from 18 years to 65 years. Assuming a<br />
less optimistic recovery rate of 25 percent would<br />
increase <strong>European</strong> reserves by 8.75bcm, increasing<br />
the current R/P ratio from 18 years to 47 years. This<br />
would have a considerable effect on security of<br />
supply in the EU, but whether the US experience<br />
can be replicated in the EU is subject to a number<br />
of uncertainties.<br />
Very little is known about potential costs,<br />
environmental impact <strong>and</strong> the legislative framework<br />
of unconventional gas production. Environmental<br />
<strong>and</strong> legal issues may significantly hinder the<br />
production of shale gas in Europe. Europe has a<br />
more stringent legislation, a different geography<br />
<strong>and</strong> a much higher population density.<br />
Unconventional gas production, know-how<br />
<strong>and</strong> technology have so far been limited to the<br />
US. Although major consolidation has taken place<br />
in recent years, whereby international oil <strong>and</strong> gas<br />
companies have acquired unconventional gas firms,<br />
the transfer of this know-how to the EU <strong>and</strong> the rest<br />
of Europe has not yet begun. Critical technology<br />
know-how includes horizontal drilling <strong>and</strong> hydraulic<br />
fracturing, which are key techniques to be mastered<br />
in order to make unconventional gas economically<br />
viable <strong>and</strong> to ensure that underground aquifers are<br />
not contaminated.<br />
Finally, the connection of unconventional gas<br />
production to the EU gas grid is also an issue of<br />
uncertainty.
<strong>Energy</strong> <strong>Security</strong>: Potential for EU-GCC Cooperation<br />
Table 3: Aggregate Measure of Risk by Rating Source <strong>and</strong> Transit Risks<br />
of the Producer Countries<br />
Source: SECURE <strong>project</strong> calculations<br />
Summary <strong>and</strong> Conclusion<br />
This chapter has detailed the different<br />
geopolitical risks that could threaten future gas<br />
supplies to EU countries. It has first dealt with<br />
theoretical risks <strong>and</strong> then detailed risks on a<br />
country by country basis.<br />
There are two major types of risks, which need<br />
to be taken into account: source risks <strong>and</strong> transit<br />
risks. Source risks comprise armed conflicts, coups<br />
d’etat, social disorder <strong>and</strong> so-called resource<br />
nationalism. In general, it appears that those risks<br />
remain rather low in countries which already supply<br />
the EU, except in a few cases such as Nigeria. In<br />
endnotes<br />
1.<br />
2.<br />
3.<br />
broad terms, EU’s principal<br />
suppliers can be considered safe<br />
partners. Transit risks, on the<br />
other h<strong>and</strong>, are much trickier<br />
to h<strong>and</strong>le. They have been the<br />
cause of the most important<br />
concerns in the past years <strong>and</strong><br />
are a direct consequence of the<br />
physical nature of gas trade.<br />
The SECURE <strong>project</strong> has<br />
proposed an aggregate measure<br />
of risk by rating source <strong>and</strong> transit<br />
risks of the producer countries. A 5point<br />
scale – ranging from very low,<br />
low, medium, high to very high<br />
– has been used to measure risk,<br />
<strong>and</strong> the outcome is summarized<br />
in Table 3.<br />
As can be seen, Qatar offers<br />
all the advantages one could hope<br />
for, <strong>and</strong> increasing imports from<br />
there, if possible on the basis of<br />
long-term contracts, could bring<br />
both diversification <strong>and</strong> security.<br />
It is thus important to stress that Qatar should<br />
play a more important role as a supplier of gas to the<br />
EU in the future as it would increase diversification<br />
<strong>and</strong> increase the overall security of supply due to the<br />
low risk linked with this country. The rest of the <strong>Gulf</strong><br />
region presents diverging prospects as the majority<br />
of countries are not gas exporters <strong>and</strong> do not<br />
intend to become so. Despite political <strong>and</strong> security<br />
difficulties, Iran <strong>and</strong> Iraq have huge gas reserves,<br />
<strong>and</strong> it will be increasingly difficult to neglect these<br />
countries if the gas consumption in the world, <strong>and</strong> in<br />
Europe in particular, keeps growing as forecast.<br />
<strong>European</strong> Commission, Green Paper, “A <strong>European</strong> Strategy for Sustainable, Competitive <strong>and</strong><br />
Secure <strong>Energy</strong>,” 2006.<br />
Victor et al, 2006.<br />
D. Jordan, J. Kiras, D. Lonsdale, I. Speller, C. Tuck, <strong>and</strong> C.D. Walton, Underst<strong>and</strong>ing Modern
Geopolitical Issues of Europe’s Future Gas <strong>Supply</strong><br />
Warfare (Cambridge University Press, 2008).<br />
4. A. Aissaoui, Algeria: the Political Economy of Oil <strong>and</strong> Gas (Oxford: Oxford University Press,<br />
2001).<br />
5. R. Vernon, Sovereignty at Bay: The Multinational Spread of US Enterprises (New York: Basic<br />
Books, 1971).<br />
6. Victor D., M. Hayes, “Natural Gas <strong>and</strong> Geopolitics: From 1970 to 2040,” Stanford University<br />
Program on <strong>Energy</strong> <strong>and</strong> Sustainable Development Working Paper 8, 2003.<br />
7. The Baker Institute, “The Changing Role of National Oil Companies in International <strong>Energy</strong><br />
Markets Series,” Available online at http://www.bakerinstitute.org/programs/energy-forum/<br />
publications/policyreports.html. Accessed February 9, 2010.<br />
8. Eurostat Database, 2009, available at http://epp.eurostat.ec.europa.eu/portal/page/portal/<br />
eurostat/home<br />
9. Nabucco is a pipeline <strong>project</strong> promoted by the <strong>European</strong> Union <strong>and</strong> linking Turkey to the Balkan<br />
peninsula <strong>and</strong> then continuing to Central Europe <strong>and</strong> Austria.<br />
10. MEES, various issues.<br />
11. P. Dasseleer, “Gazprom: L’idéalisme Européen à l’épreuve du réalisme russe,”Paris: L’Hartman<br />
Laserre, 2008.<br />
12. J. Stern, “Future Gas Production in Russia: Is the Concern about Lack of Investment Justified?”<br />
Oxford Institute of <strong>Energy</strong> Studies NG 35, 2009.<br />
13. C. Spencer, “North Africa: The Hidden Risk to Regional Stability”The Chatham House Briefing<br />
Paper, April 2009.<br />
14. BP, Statistical Review of World <strong>Energy</strong>, 2009.<br />
15. Observatoire Méditerranéen de l’Energie (2009): “Natural Gas <strong>Supply</strong>, Reserves, Production,<br />
Transportation <strong>and</strong> Transit”. Deliverable 5.2.3 SECURE <strong>project</strong><br />
16. C. Spencer, “North Africa: The Hidden Risk to Regional Stability,” The Chatham House Briefing<br />
Paper, April 2009.<br />
17. MEES 52 (no. 42), October 19, 2009.<br />
18. MEES 45 (no. 9), November 2009.<br />
19. Observatoire Méditerranéen de l’Energie, “Natural Gas <strong>Supply</strong>, Reserves, Production,<br />
Transportation <strong>and</strong> Transit,” Deliverable 5.2.3 SECURE <strong>project</strong>, 2009.<br />
20. G. Bahgat, “Prospects for <strong>Energy</strong> Cooperation in the Caspian Sea,” Communist <strong>and</strong> Post-<br />
Communist Studies 40: (2007): 157-168.<br />
21. T. Kellner, “L’Occident de la Chine: Pékin et la nouvelle Asie Centrale (1991-2001),” Paris : Presse<br />
Universitaire de France, 2009.<br />
22. G. Stansfield, “Accepting Realities in Iraq,” The Chatham House, Middle East Programme<br />
Briefing 07/02, 2007.<br />
23. J. Stern, “Is there a Rationale for the Continuing Link to Oil Product Prices in Continental<br />
<strong>European</strong> Long-Term Gas Contracts,” Oxford Institute for <strong>Energy</strong> Studies, April 2007.<br />
24. International <strong>Energy</strong> Agency, World <strong>Energy</strong> Outlook 2009, OECD, IEA: Paris, 2009.<br />
25. Gas Infrastructure Europe database, 2010 Gas LNG Europe Dabase: http://www.gie.eu/maps_<br />
data/lng.html<br />
26.<br />
Taken from SECURE deliverable 5.2.7 written by Ramboll.
<strong>Energy</strong> <strong>Security</strong>: Potential for EU-GCC Cooperation<br />
0<br />
References<br />
•<br />
•<br />
•<br />
•<br />
•<br />
•<br />
•<br />
•<br />
•<br />
•<br />
•<br />
•<br />
•<br />
•<br />
•<br />
•<br />
•<br />
•<br />
•<br />
•<br />
•<br />
•<br />
Aissaoui, A. 2001. Algeria: the political economy of oil <strong>and</strong> gas. Oxford: Oxford University Press.<br />
Avioutskii, Viatcheslav. 2003. Confessional geopolitics in southern Russia <strong>and</strong> in the North Caucasus.<br />
In Central Asia <strong>and</strong> Caucasus Press. Available online: http://www.ca-c.org/journal/eng-05-2003/01.<br />
aviprimen.shtml. Accessed February 9, 2010.<br />
Bahgat, G. 2007. Prospects for energy cooperation in the Caspian Sea. In Communist <strong>and</strong> Post-<br />
Communist Studies 40: 157-168.<br />
BP. 2009. Statistical review of world energy. Available at http://www.bp.com/productl<strong>and</strong>ing.do?c<br />
ategoryId=120&contentId=7047744. Accessed February 9, 2010.<br />
Bruce, C. 2005. Friction or fiction? The gas factor in Russian-Belarusian relations. Russian <strong>and</strong><br />
Eurasia Programme Briefing Paper 05/01, Chatham House.<br />
Cedigaz website: http://www.cedigaz.com/<br />
Center for Systemic Peace. 2009. War list data set. Available http://www.systemicpeace.org/warlist.<br />
htm. Accessed February 9, 2010.<br />
Chegrouche L. 2009. L’échiquier transsaharien: Potentiel de réserves et projets de transport. In<br />
Medénergie vol. 30 (September).<br />
Commission of the <strong>European</strong> Communities. 2009. Proposal for a regulation of the <strong>European</strong><br />
Parliament <strong>and</strong> of the Council concerning measures to safeguard security of gas supply <strong>and</strong><br />
repealing Directive 2004/67/EC.<br />
Commission of the <strong>European</strong> Community. 2006. Green Paper. A <strong>European</strong> strategy for sustainable,<br />
competitive <strong>and</strong> secure energy. Brussels, March 8.<br />
Dasseleer P. 2009. Gazprom: L’idéalisme Européen à l’épreuve du réalisme russe. Paris:<br />
L’Hartman.<br />
Egging R., S. Gabriel, F. Holz, J. Zhuang. 2008. A complementarity model for the <strong>European</strong> natural<br />
gas market. In <strong>Energy</strong> Policy 36: 2385–2414.<br />
<strong>Energy</strong> Information Administration, http://www.eia.doe.gov/<br />
Euronews. 2009. Russia, Turkey sign South Stream pipeline deal. August 7, 2009. Available<br />
http://www.euronews.<strong>net</strong>/2009/08/07/russia-turkey-sign-south-stream-pipeline-deal/. Accessed<br />
February 9, 2010.<br />
<strong>European</strong> Commission Staff Working Document. 2009. The January 2009 gas supply disruption to<br />
the EU: An assessment. COM 2009 (363).<br />
Eurostat Database. 2009. http://epp.eurostat.ec.europa.eu/portal/page/portal/eurostat/home<br />
Geopolitis. 2009. Al-Qaida au Maghreb Islamic. (12.06.2008). Available at http://www.tsr.ch/tsr/<br />
index.html?siteSect=327200. Accessed February 9, 2010.<br />
Hashimoto K., J. Elass, S. Eller 2004. Liquefied natural gas from Qatar: The Qatargas <strong>project</strong>. Baker<br />
Institute Geopolitics of Gas Working Paper Series.<br />
Hotelling H. 1931. The economics of exhaustible resources. In Journal of Political Economy 39: 137-<br />
175.<br />
International <strong>Energy</strong> Agency. 2009. World energy outlook 2009. OECD, IEA: Paris<br />
Jordan, D., J. D. Kiras, D. J. Lonsdale, I. Speller, C. Tuck, C.D. Walton. 2008. Underst<strong>and</strong>ing modern<br />
warfare. Cambridge University Press.<br />
Katz, M. 2007. Russia <strong>and</strong> Algeria: Partners or competitors? In Middle East Policy XIV, no. 4<br />
(Winter).
•<br />
•<br />
•<br />
•<br />
•<br />
•<br />
•<br />
•<br />
•<br />
•<br />
•<br />
•<br />
•<br />
•<br />
•<br />
•<br />
•<br />
•<br />
•<br />
•<br />
•<br />
•<br />
•<br />
•<br />
•<br />
•<br />
Geopolitical Issues of Europe’s Future Gas <strong>Supply</strong><br />
Kaufmann D., A. Kraav, M. Mastruzzi. 2009. Governance matters VIII: Governance indicators for<br />
1996-2008.<br />
Kellner, T. 2009. “L’Occident de la Chine: Pékin et la nouvelle Asie Centrale (1991-2001). Paris :<br />
Presse Universitaire de France.<br />
Konoplyanik, A. 2005. Russia-EU Summit: WTO, the <strong>Energy</strong> Charter Treaty <strong>and</strong> the issue of energy<br />
transit. In International <strong>Energy</strong> Law <strong>and</strong> Taxation Review 2: 30-35.<br />
Konoplyanik A., Wälde T. 2006. <strong>Energy</strong> Charter Treaty <strong>and</strong> its role in international energy. In Journal<br />
of <strong>Energy</strong> <strong>and</strong> Natural Resource Law 24, no. 4.<br />
Le Courrier International. 2009. “Le gazoduc South Stream devient prioritaire’’ 23.10.2009.<br />
Available at http://www.courrierinternational.com/breve/2009/10/23/le-gazoduc-south-streamdevient-prioritaire.<br />
Accessed February 9, 2010.<br />
Le Monde Diplomatique maps. Available at http://www.monde-diplomatique.fr/cartes/<br />
MEES 52, no. 33 August 17, 2009.<br />
MEES 52, no. 34, 24 August 2009.<br />
MEES 52, no. 42, October 19, 2009.<br />
MEES 52, no. 45, November 9, 2009.<br />
Nord Stream AG, http://www.nord-stream.com/en/<br />
Observatoire Méditerranéen de l’Energie. Natural gas supply, reserves, production, transportation<br />
<strong>and</strong> transit. Chapter 5.2.3 SECURE <strong>project</strong>.<br />
Petrosyan, K. 2003. What are the constraints on associated gas utilization? University of Dundee<br />
Working Paper. Available online. Accessed February 9, 2010.<br />
http://www.dundee.ac.uk/cepmlp/car/html/car8_article19.pdf<br />
PFC website, http://www.pfcenergy.com/default.aspx<br />
Pifer, S. 2009. Ukraine’s geopolitical choice, 2009. In Eurasian Geography <strong>and</strong> Economics 50, no. 4:<br />
387–401.<br />
Pirani S., J. Stern, K. Yafimava 2009. The Russo-Ukrainian gas dispute of January 2009: a<br />
comprehensive assessment. Oxford Institute for <strong>Energy</strong> Study.<br />
Protasov, P. 2009. Long-term modeling of resilience <strong>and</strong> flexibility of <strong>European</strong> Gas Transportation<br />
System: Integrated factors. ENERDAY proceedings, April 3, Dresden.<br />
Spencer, C. 2009. North Africa: The hidden risk to regional stability. The Chatham House Briefing<br />
Paper, April.<br />
Stern, J. 2007. Is there a rationale for the continuing link to oil product prices in Continental <strong>European</strong><br />
long-term gas contracts. Oxford Institute for <strong>Energy</strong> Studies, April.<br />
Stern, J. 2009. Future gas production in Russia: is the concern about lack of investment justified?<br />
Oxford Institute of <strong>Energy</strong> Studies NG 35.<br />
Stansfield, G. 2007 Accepting realities in Iraq. The Chatham House, Middle East Programme<br />
Briefing 07/02.<br />
Tekin, A. <strong>and</strong> P. Williams. 2009. Europe’s external energy policy <strong>and</strong> Turkey’s accession process. In<br />
Center for <strong>European</strong> Studies Working Paper Series no. 170.<br />
The Baker Institute. 2007. The Changing Role of National Oil Companies in International <strong>Energy</strong><br />
Markets Series. Various articles. Available online: http://www.bakerinstitute.org/programs/energyforum/publications/policyreports.html<br />
Accessed February 9, 2010.<br />
The Financial Times. 2006-2007. Various articles.<br />
The International <strong>Energy</strong> Agency. 2009. World energy outlook 2009. Available at http://www.<br />
1
<strong>Energy</strong> <strong>Security</strong>: Potential for EU-GCC Cooperation<br />
•<br />
•<br />
•<br />
•<br />
•<br />
•<br />
•<br />
•<br />
•<br />
•<br />
•<br />
•<br />
•<br />
•<br />
•<br />
•<br />
2<br />
worldenergyoutlook.org/docs/weo2009/WEO2009_es_english.pdf . Accessed February 9, 2010.<br />
The Petroleum Economist. 2007. <strong>Security</strong> trends in high-risk countries: Nigeria. London,<br />
September.<br />
The World Bank. 2009. Worldwide governance indicators 1996-2008. Available at http://info.<br />
worldbank.org/governance/wgi/worldmap_start.asp?allcountries=1. Accessed February 9, 2010.<br />
UN Comtrade, http://comtrade.un.org/<br />
Uppsala Conflict Data Program. 2008. Map of the world's conflicts in 2008. Available at http://www.<br />
pcr.uu.se/research/UCDP/graphs/charts_<strong>and</strong>_graphs.htm. Accessed February 9, 2010.<br />
Uppsala Conflict Data Program. 2009. Dyadic data set 2009.<br />
Uppsala Conflict Data Program. 2009. Non-state conflict data set 2009.<br />
Uppsala Conflict Data Program. 2009. One-sided violence conflict data set 2009.<br />
University of Texas. Perry-Castañeda library map collection. http://lib.utexas.edu/maps/<br />
commonwealth/ethnocaucasus.jpg<br />
Urs, Gerber. 2004. Wither South Caucasus: to prosperity or to conflict. In The Caspian: politics,<br />
energy <strong>and</strong> security, eds. Shirin Akiner, 323-342. Abingdon: Routledge.<br />
Vernon, R. 1971. Sovereignty at bay: The multinational spread of US enterprises. New York: Basic<br />
Books.<br />
Victor D., A. Jaffe, M. Hayes. 2006. Natural gas <strong>and</strong> geopolitics: from 1970 to 2040, eds. David G.<br />
Victor. Cambridge: Cambridge Univ. Press.<br />
Victor D., M. Hayes. 2003. Natural gas <strong>and</strong> geopolitics: From 1970 to 2040. Stanford University<br />
Program on <strong>Energy</strong> <strong>and</strong> Sustainable Development Working Paper 8.<br />
Victor D., N. Makarova. 2004. The Belarus connection: Exporting Russian gas to Germany <strong>and</strong><br />
Pol<strong>and</strong>. The Baker Institute Geopolitics of Natural Gas Studies Working Paper 26 (May).<br />
Vzgliad. 2009. Yuzhni Potek (Южный потек). October 22, 2009. Available at http://www.vz.ru/<br />
economy/2009/10/22/340726.html. Accessed February 9, 2010.<br />
Whist, S. 2008. Nord Stream: Not just a pipeline: An analysis of the political debates in the Baltic<br />
Sea region regarding the planned gas pipeline from Russia to Germany. Fridtjof Nansen Institute.<br />
Available at http://www.isn.ethz.ch/isn/Digital-Library/Publications/Detail?id=94432%26lng=en<br />
Accessed February 9, 2010.<br />
Winrow, M. 2009. Problems <strong>and</strong> prospects for the fourth corridor: The positions <strong>and</strong> role of Turkey<br />
in the gas transit to Europe. Oxford Institute for <strong>Energy</strong> Studies, June.
SESSION V: Renewable Sources in EU-GCC Cooperation<br />
overview of Res Characteristics<br />
<strong>and</strong> Future scenarios*<br />
Introduction<br />
In addition to its environmental benefits, the use<br />
of renewable energy sources (RES) may contribute<br />
to increasing energy security. Among others, this<br />
fact is attributed to the indigenous availability of<br />
RES. At the same time, however, an increased use<br />
of RES involves certain risks to energy security. To<br />
give an example, an increased use of wind energy<br />
<strong>and</strong> its fluctuating electricity output could pose<br />
problems for system management <strong>and</strong> the existing<br />
electricity grid. Due to the heterogeneity of RES,<br />
with regard to their availability, energy conversion<br />
costs or other techno-economic characteristics,<br />
a detailed knowledge about these facts <strong>and</strong> the<br />
existing framework conditions is required for the<br />
evaluation of the role of RES for energy security.<br />
This background paper first introduces a general<br />
overview of RES characteristics in the context of<br />
energy security. Specific characteristics of different<br />
existing RES <strong>and</strong> the corresponding conversion<br />
technologies are described with a focus on the<br />
technological <strong>and</strong> the economic dimensions. In<br />
addition, special attention is drawn to the dynamics<br />
of RES’ economic characteristics. Based on this<br />
information, insights into the main opportunities<br />
<strong>and</strong> risks of RES for energy security are provided.<br />
Taking into account the benefits of RES in terms<br />
of environmental factors <strong>and</strong> increase in security of<br />
supply, the EC pursues the objective to supply 20<br />
percent of the gross final energy consumption in 2020<br />
from RES (The <strong>European</strong> Parliament <strong>and</strong> the Council<br />
of the <strong>European</strong> Union 2009). Nevertheless, the<br />
use of RES usually involves higher generation costs<br />
compared to the use of most conventional energy<br />
conversion technologies. To compensate for the<br />
* This paper was written by Christian Panzer (EEG TU-WIEN) <strong>and</strong> Anne Held (Frauenhofer Institut)<br />
economic disadvantages of some RES technologies,<br />
national governments have implemented different<br />
policy schemes that provide financial support<br />
for such technologies in order to make <strong>project</strong>s<br />
economically feasible. The major policy schemes in<br />
the electricity sector represent feed-in tariffs <strong>and</strong><br />
quota obligations with an integrated trade of green<br />
certificates. In the first case, a fixed tariff is paid for<br />
one unit of renewable electricity or a premium is paid<br />
for one unit of renewable electricity on top of the<br />
market price. The quantity of renewable electricity<br />
is then a result of the predetermined tariff level.<br />
In contrast, in the case of quota obligations, the<br />
government sets targets for renewable electricity<br />
generation; <strong>and</strong> the price of the green certificate<br />
is a consequence of the predetermined target.<br />
With respect to the heat sector, the most applied<br />
support schemes are investment <strong>and</strong> fuel incentives.<br />
Regarding the transport sector, the <strong>European</strong><br />
Commission in a Directive in 2003 proposed a certain<br />
annual quota of biofuel use.<br />
Against this background, this chapter estimates<br />
the potential quantitative contribution of RES to<br />
increase security of supply according to different<br />
scenarios. Based on the existing simulation model<br />
Green-X <strong>and</strong> its detailed RES database, three future<br />
scenarios are presented referring to the overall<br />
SECURE policy storylines. Subsequently, results of<br />
the scenario calculations are presented, involving<br />
the analysis of the costs arising from an increased<br />
use of RES, which is again caused by the application<br />
of renewables support schemes in the respective<br />
scenario. In addition, some policy options of how to<br />
promote renewable energy sources effectively <strong>and</strong><br />
efficiently are evaluated.
<strong>Energy</strong> <strong>Security</strong>: Potential for EU-GCC Cooperation<br />
1. Characteristics of Renewable energy<br />
Conversion technologies<br />
A broad set of different energy conversion<br />
technologies options using RES exist today.<br />
However, these technologies differ considerably<br />
with regard to the stage of technological <strong>and</strong><br />
market development as some are at an advanced<br />
stage of development while others are still at the<br />
initial stage.<br />
Additionally, the economic dimension of RES<br />
technologies influences their market development.<br />
The second section discusses the present range<br />
of energy conversion costs of RES technologies,<br />
consisting mainly in capital costs of RES within all<br />
three energy sectors, as well as possible future cost<br />
developments.<br />
Due to the domestic nature of most RES<br />
conversion technologies, they contribute significantly<br />
to increasing Europe’s import independence from<br />
fossil fuels. On the other h<strong>and</strong>, RES may involve<br />
higher risks due to the usage of novel technologies,<br />
output volatility <strong>and</strong> political circumstances.<br />
4<br />
Wind offshore<br />
Wind onshore<br />
Tide & Wave<br />
Solar thermal electricity<br />
Photovoltaics<br />
Hydro small-scale<br />
Hydro large-scale<br />
Geothermal electricity<br />
Biowaste<br />
(Solid) Biomass<br />
Biogas<br />
Solar collectors<br />
Heat pumps<br />
Biomass heat (decentral)<br />
Geothermal heat (CHP & DH)<br />
Biomass heat (CHP & DH)<br />
1.1 The Technological Dimension of Renewable<br />
<strong>Energy</strong> Conversion Technologies<br />
From a theoretical viewpoint, a broad range of<br />
RES is eligible for various conversion technologies.<br />
But due to existing constraints regarding the<br />
available resource potential, in the final count, the<br />
number of RES that are convertible is limited. The<br />
following part addresses the different RES potential<br />
categories. It also gives some figures of currently<br />
installed <strong>and</strong> identified RES potentials that are<br />
realizable up to the year 2030.<br />
• Theoretical potential: For deriving the theoretical<br />
potential general physical parameters have<br />
to be taken into account (e.g. based on the<br />
determination of the energy flow resulting from<br />
a certain energy resource within the investigated<br />
region). It represents the upper limit of what can<br />
be produced from a certain energy resource from<br />
a theoretical point-of-view – of course, based on<br />
current scientific knowledge;<br />
• Technical potential: If technical boundary<br />
conditions (i.e. efficiencies of conversion<br />
Achieved potential 2005<br />
Additional long term (2030) potential<br />
0 50 100 150 200 250 300 350 400 450 500<br />
RES-E - Electricity generation potential [TWh]<br />
0 10 20 30 40 50 60 70<br />
RES-H - Heat generation potential [Mtoe]<br />
Achieved potential 2005<br />
Additional long term (2030)<br />
potential
•<br />
technologies, overall technical limitations as e.g.<br />
the available l<strong>and</strong> area to install wind turbines<br />
as well as the availability of raw materials) are<br />
considered the technical potential can be derived.<br />
For most resources the technical potential must<br />
be considered in a dynamic context – e.g. with<br />
increased R&D, conversion technologies might<br />
be improved <strong>and</strong>, hence, the technical potential<br />
would increase;<br />
Realizable potential: The realizable potential<br />
represents the achievable potential assuming<br />
that all existing barriers can be overcome <strong>and</strong> all<br />
driving forces are active. The realizable potential<br />
is limited by assumed maximum market growth<br />
rates <strong>and</strong> planning constraints. Therefore, the<br />
realizable potential has to refer to a certain year<br />
– it becomes substantially higher the further one<br />
looks into the future.<br />
1.2 The Economic Dimension of Renewable<br />
<strong>Energy</strong> Technologies<br />
The economic dimension is an important aspect<br />
that will determine the future growth rates of RES<br />
technologies. On the one h<strong>and</strong>, up-front investment<br />
costs are of relevance for potential investors, since<br />
these will determine the resulting generation costs<br />
<strong>and</strong> the achievable profit. On the other h<strong>and</strong>, future<br />
cost reductions will change the overall specific<br />
investment expenditures.<br />
1.2.1 Current economic Characteristics of<br />
Renewable energy Conversion technologies<br />
The broad range of costs for several RES<br />
technology options is caused by site specific<br />
conditions, for example, Photovoltaics or wind<br />
energy locations. Then, costs strongly depend on<br />
the available technological options – compare, for<br />
example, co-firing <strong>and</strong> small-scale CHP plants for<br />
biomass. Dem<strong>and</strong>-specific conditions leading to<br />
various degrees of utilization (e.g. full load hours<br />
in case of heating systems) also affect economics<br />
of RES technologies. All factors together lead to a<br />
broad range of conversion costs.<br />
Nevertheless, in order to give a better<br />
illustration of the current economic conditions of<br />
Overview of RES Characteristics <strong>and</strong> Future Scenarios<br />
the various RES options in the electricity sector<br />
some examples are pointed out here. According<br />
to the above mentioned impact parameters, wind<br />
onshore generation costs vary between 60 €2006/<br />
MWh <strong>and</strong> 105 €2006/MWh whereas offshore wind<br />
generation cost reach up to 150 €2006/MWh. The<br />
biggest range of generation costs is noted in<br />
the Biomass sector from 50 €2006/MWh to 210<br />
€2006/MWh. At the end of the scale solar energy<br />
converters, especially Photovoltaics amount to<br />
380 €2006/MWh up to 1200 €/MWh.<br />
In contrast, the heat sector distinguishes<br />
between grid connected heat supply <strong>and</strong> nongrid<br />
connected heat supply, wherein the latter<br />
faces higher market prices. Among the RES-H<br />
technologies, solid biomass is in most cases<br />
within the non-grid connected sector, already<br />
competitive with conventional options (50 €2006/<br />
MWh to 75 €2006/MWh). Again solar thermal<br />
power generation is on the upper end at 75€ 2006/<br />
MWh up to 200 €2006/MWh. Grid connected heat<br />
supply systems vary between 30 €2006/MWh <strong>and</strong><br />
120 €2006/MWh.<br />
Finally, in the transport sector the costs of all<br />
technologies are still above the current market price<br />
<strong>and</strong> therefore depend on financial support measures<br />
(bioethanol 60 €2006/MWh to 100 €2006/MWh <strong>and</strong><br />
biodiesel 55 €2006/MWh to 65 €2006/MWh).<br />
1.2.2 Future Development of economics of<br />
Renewable energy Conversion technologies<br />
With respect to the future cost development,<br />
technological learning is a crucial parameter,<br />
especially in the mid- to long term. Technological<br />
learning considers a certain cost reduction with<br />
each doubling of produced output. As learning<br />
takes place on the international level, the<br />
deployment of a technology on the global level<br />
must be considered. In order to illustrate the<br />
development of initial investment costs, influenced<br />
by learning effects but also by other parameters<br />
such as raw material prices <strong>and</strong> oil prices, Figure 1<br />
depicts the cost development exemplarily for the<br />
electricity generation technologies up to the year<br />
2030. Remarkable is the negative development<br />
in the period 2007 to 2009 for most energy
<strong>Energy</strong> <strong>Security</strong>: Potential for EU-GCC Cooperation<br />
Figure 1 Cost Reduction of RES-E Investments as Share of Initial Investment Costs (2006) in<br />
a Pessimistic Scenario with regard to Technological Progress according to the “Policy Case”<br />
l<br />
a<br />
i<br />
t<br />
i<br />
n<br />
i<br />
f<br />
o<br />
e<br />
r<br />
a<br />
h<br />
s<br />
-<br />
n<br />
o<br />
i<br />
t<br />
c<br />
u<br />
d<br />
e<br />
r<br />
t<br />
s<br />
o<br />
C<br />
t<br />
n<br />
e<br />
m<br />
t<br />
s<br />
e<br />
v<br />
n<br />
i<br />
)<br />
6<br />
0<br />
0<br />
2<br />
r<br />
a<br />
e<br />
y<br />
e<br />
h<br />
t<br />
n<br />
i<br />
s<br />
a<br />
(<br />
120%<br />
115%<br />
110%<br />
105%<br />
100%<br />
95%<br />
90%<br />
85%<br />
80%<br />
75%<br />
70%<br />
65%<br />
60%<br />
55%<br />
50%<br />
45%<br />
40%<br />
35%<br />
30%<br />
6<br />
0<br />
0<br />
2<br />
8<br />
0<br />
0<br />
2<br />
technologies, but obviously mostly affecting the<br />
cost of wind energy converters, is remarkable.<br />
This increase in investment cost is largely driven<br />
by the tremendous rise of energy <strong>and</strong> raw<br />
material prices as observed in recent years <strong>and</strong><br />
was expected to prolong in the near to mid future.<br />
In this context, the impact of rising energy <strong>and</strong><br />
raw material prices even compensates the cost<br />
reductions achieved due to technological learning.<br />
So, although technology learning is achieved, the<br />
overall investment costs are increasing in this<br />
period. However, still substantial cost reductions<br />
are expected for novel technology options such<br />
as photovoltaics, solar thermal electricity or tidal<br />
stream <strong>and</strong> wave power.<br />
1.3 Opportunity of Renewable <strong>Energy</strong> Sources<br />
to <strong>Security</strong> of <strong>Supply</strong><br />
0<br />
1<br />
0<br />
2<br />
Source: Green-X calculations<br />
2<br />
1<br />
0<br />
2<br />
4<br />
1<br />
0<br />
2<br />
6<br />
1<br />
0<br />
2<br />
8<br />
1<br />
0<br />
2<br />
0<br />
2<br />
0<br />
2<br />
As stated by Ölz et al. 2007, 1 the use of RES<br />
may contribute to increasing energy security due to<br />
several characteristics.<br />
First, since RES mainly represent indigenous<br />
resources, the replacement of imported fossil<br />
primary energy carriers, such as gas or coal, leads to<br />
a reduction of import dependency.<br />
Second, the decentralized availability of RES<br />
<strong>and</strong> predominantly small plant sizes often leads<br />
to decentralized generation resulting in the<br />
2<br />
2<br />
0<br />
2<br />
4<br />
2<br />
0<br />
2<br />
6<br />
2<br />
0<br />
2<br />
8<br />
2<br />
0<br />
2<br />
0<br />
3<br />
0<br />
2<br />
Hydropower<br />
Geothermal electricity<br />
Solid biomass - cofiring &<br />
large-scale plant<br />
Solid biomass - small-scale<br />
CHP<br />
Gaseous biomass<br />
Gaseous biomass CHP<br />
Wind energy<br />
Tidal & wave<br />
Solar thermal electricity<br />
Photovoltaics<br />
following advantages: firstly, less infrastructural<br />
risks as the plants may be located closer to the<br />
dem<strong>and</strong> involving a reduced risk for the grid<br />
infrastructure; secondly, the impacts of potential<br />
shutdowns or blackouts on the electricity system<br />
are reduced.<br />
Third, RES technologies with the exception of<br />
biomass-based applications are not dependent on<br />
any fuel costs. Hence, in contrast to conventional<br />
energy conversion technologies based on the use of<br />
fossil fuels, there are neither fuel price fluctuations<br />
nor risks. Furthermore, the use of RES technologies<br />
in the electricity market under certain support<br />
conditions may have an impact on electricity<br />
prices. In this way, Sensfuß et al. 2008 calculate the<br />
impact of wind power feed-in on electricity prices<br />
using the example of Germany. 2 Following the<br />
basic mechanism of electricity markets, where the<br />
operation of electricity generation plants is selected<br />
according to the merit order of the marginal costs,<br />
wind electricity may replace generation options<br />
with high marginal costs, as for example, gas<br />
turbines, in periods of peak load. Thus, electricity<br />
prices are affected by the wind power feed-in.<br />
Finally, a diversification of the existing power<br />
plant portfolio through an increased use of RES may<br />
lead to the portfolio effect <strong>and</strong> therewith reduce risks.<br />
Figure 2 summarizes the opportunities identified for<br />
RES to contribute to security of supply.
Figure 2: Overview of Opportunities for <strong>Security</strong> of <strong>Supply</strong> regarding RES<br />
Decentralised<br />
character<br />
• Location closed to<br />
dem<strong>and</strong><br />
Less infrastructure<br />
risk<br />
• Reduced impact on<br />
electricity system in<br />
case of shutdowns<br />
Mainly indigenous<br />
resources<br />
• Reduction of import<br />
dependency<br />
1.4 The Risk of Renewable <strong>Energy</strong> Conversion<br />
Technologies to <strong>Security</strong> of <strong>Supply</strong> in the<br />
Electricity Sector<br />
Assessing the risk of RES technologies to security<br />
of supply implies investigation of many parameters<br />
on the technology level. Generally, a RES conversion<br />
plant shows different risk with respect to security of<br />
supply, depending on the plant size. If, for instance,<br />
a large-scale hydro power plant suddenly ceases to<br />
produce electricity, the impact on security of supply<br />
is much higher than if one wind turbine does not<br />
generate its forecast electricity amount.<br />
Furthermore, the risk of volatile fuel costs does<br />
not affect every RES technology to the same extent.<br />
Thus, some technologies in the electricity sector<br />
show a very volatile energy output in the shortterm<br />
<strong>and</strong> others more in the long-term, while some<br />
others do not show any volatile energy output at all.<br />
Generally, it should be mentioned that the volatile<br />
energy output represents one of the most relevant<br />
risks of RES, since they require a certain amount of<br />
back-up capacity in the energy system <strong>and</strong> therefore<br />
do not contribute largely to the overall security of<br />
energy supply.<br />
Economic risk parameters are very sensitive<br />
to the overall risk assessment of a renewable<br />
technology. On the one h<strong>and</strong>, the current economic<br />
crunch will decrease the overall energy dem<strong>and</strong> <strong>and</strong>,<br />
therefore, contribute positively to energy supply<br />
security, while on the other h<strong>and</strong> the financial crises<br />
could hamper a strong growth of RES. In this context,<br />
an adequate <strong>and</strong> long-term stable policy framework<br />
is required in order to attract potential investors.<br />
Overview of RES Characteristics <strong>and</strong> Future Scenarios<br />
No fuel cost<br />
(except BM)<br />
• Reduction of price risks<br />
induced by fossil fuel<br />
prices<br />
• Price effect of wind power<br />
feed-in<br />
Portfolio effect<br />
• Diversification of<br />
power plant<br />
portfolio<br />
According to Figure 3 the assessment of risk can<br />
be made in terms of long-term impacts, operational<br />
impacts <strong>and</strong> others. Generally, the risk assessment<br />
depends on the type <strong>and</strong> pe<strong>net</strong>ration of RES <strong>and</strong><br />
system characteristics:<br />
• The higher the pe<strong>net</strong>ration of RES, the higher is<br />
the risk of volatile power outputs.<br />
• The more diverse the portfolio of renewable<br />
technologies, the smaller is the impact of price<br />
volatilities.<br />
• The more stable the political framework<br />
•<br />
conditions, the lower is the risk for potential<br />
investors<br />
The higher the share of domestic energy<br />
production, the higher the security of supply – as<br />
a domestic energy resource, a large contribution<br />
of RES is required by exploiting all kinds of<br />
technologies in order to establish a reliable,<br />
constant renewable energy system.<br />
2. Future Pathways of Res <strong>and</strong> Associated<br />
Policy Costs<br />
Taking into account technical <strong>and</strong> economic<br />
constraints of RES technologies, discussed above,<br />
this section provides quantitative analysis of<br />
potential future RES pathways up to 2030, according<br />
to the three main policy lines within the SECURE<br />
<strong>project</strong>. Three different dem<strong>and</strong> <strong>project</strong>ions<br />
accompanied by the associated energy prices form<br />
the basis of the policy themes on the one h<strong>and</strong>; on<br />
the other h<strong>and</strong>, the differently implemented RES<br />
support measures are of high relevance for the<br />
results. Moreover, all scenarios refer to realizable<br />
RES potentials of renewable energies (see Panzer
<strong>Energy</strong> <strong>Security</strong>: Potential for EU-GCC Cooperation<br />
Figure 3: Overview of Threat Identification for <strong>Security</strong> of <strong>Supply</strong> regarding RES<br />
Economic<br />
• Development of cost<br />
reduction<br />
• Raw material prices<br />
(e.g. steel, silicon)<br />
• Electricity generation<br />
costs<br />
Import dependency<br />
• CSP from North Africa<br />
• Biomass imports<br />
(transport distance,<br />
state of aggregation)<br />
et al, 2009) determined for this chapter, taking<br />
into account dynamic aspects. The assessment<br />
of future renewable energy pathways in terms of<br />
development is based on scenario calculations<br />
seeking to meet the overall 20 percent RES by 2020<br />
target in the EU.<br />
The first sub-section focuses on the possible<br />
future development of renewable energies in<br />
all three energy sectors in terms of quantitative<br />
capacity installations as well as generation in the<br />
<strong>European</strong> Union. Additionally, potential surpluses<br />
<strong>and</strong> shortfalls with respect to the 20 percent RES<br />
by 2020 target are discussed here. These analyses<br />
depict the impact of national policy schemes on<br />
future development in all three policy themes.<br />
Consequently, the second sub-section provides a<br />
comparison of additional generation costs due to<br />
enhanced RES development <strong>and</strong> highlights the<br />
difference in society costs.<br />
2.1 Pathways of RES Deployment<br />
2.1.1 Muddling through – Business as<br />
Usual:<br />
Long-term impacts Operational impacts<br />
Climate change<br />
impacts<br />
• Hydro: Changing<br />
utilisation<br />
• Wind: Impact of storms<br />
• Biomass: Change in<br />
BM-Potential<br />
Feedstock<br />
competition<br />
• Biomass availability<br />
<strong>and</strong> prices<br />
• Harvesting season<br />
This scenario is characterized by high gross<br />
final energy dem<strong>and</strong> growth rates in all sectors<br />
on global scale accompanied by relatively low raw<br />
Variability of RESoutput<br />
• Wind in particular on<br />
short-term<br />
(Remedies: Back-up<br />
capacity; Grid<br />
reinforcement; DSM)<br />
• Solar<br />
(comparatively good<br />
correlation of peak load<br />
<strong>and</strong> dem<strong>and</strong>)<br />
• Hydro<br />
(Inter-annual variability)<br />
Others<br />
Technological<br />
risks<br />
• Geothermal<br />
(Hot-Dry-Rock <strong>and</strong><br />
Earthquakes<br />
Basel)<br />
Political risks<br />
• Political factors<br />
hampering RESdevelopment<br />
(Non-economic<br />
barriers, policy<br />
uncertainty)<br />
energy prices. However, the <strong>project</strong>ed sectoral<br />
contribution can be analyzed best by depicting<br />
deployment on sectoral level in relative terms – i.e.<br />
by indicating the deployment of RES-E, RES-H <strong>and</strong><br />
RES-T as shares of corresponding gross dem<strong>and</strong>s. In<br />
this context, Table 1 gives an overview on results for<br />
2006 – forming the starting year of the simulation<br />
– 2010, 2020 <strong>and</strong> 2030. Although a constant increase<br />
of the share of renewables can be observed in all<br />
sectors, the overall development of renewables<br />
fails to meet the 20 percent RES by 2020 target by<br />
far. In this respect, renewables only contribute to 13<br />
percent to the overall gross final energy dem<strong>and</strong> in<br />
2020. Nevertheless, the strongest increase is seen<br />
in the electricity sector where almost a quarter of<br />
the electricity dem<strong>and</strong> is met by renewables. The<br />
share of biofuels in transport fuel dem<strong>and</strong> remains<br />
comparatively low throughout the decades up<br />
to 2030. Generally, the relatively slow increase of<br />
renewables even slows down beyond 2020 <strong>and</strong><br />
results at 15 percent RES on gross final energy<br />
dem<strong>and</strong> in 2030.<br />
Next, the RES development is discussed on<br />
technology level for each energy sector. The bulk of<br />
RES-E in 2030, illustrated in Figure 4, will be mostly<br />
produced by technologies that are already at present<br />
well established or close to the market. Hence, wind
onshore (378 TWh/yr), large-scale hydro (320 TWh/<br />
yr), solid biomass (128 TWh/yr), biogas (78 TWh/yr),<br />
small hydro (55 TWh/yr) will contribute about 83.7<br />
percent to RES-E production. In contrast, novel RES-<br />
E options with huge future potentials such as PV (60<br />
TWh/yr), solar thermal electricity (113 TWh/yr) or<br />
tidal & wave energy (35 TWh/yr) <strong>and</strong> wind offshore<br />
(33 TWh/yr) enter the market <strong>and</strong> achieve a steadily<br />
growing share. However, remarkable contributions<br />
can, under a Business as Usual scenario, only be<br />
expected in the period beyond 2020. Generally,<br />
current support measures lead to an increased share<br />
of RES-E generation, but mainly driven by already<br />
experienced technologies, whereas the development<br />
of novel technologies is strongly limited, also caused<br />
by existing non-economic barriers.<br />
In contrast to the electricity sector, the renewable<br />
heat sector is under Business as Usual circumstances<br />
also strongly dominated by already well established<br />
energy technologies, where, as already mentioned,<br />
Overview of RES Characteristics <strong>and</strong> Future Scenarios<br />
the biggest RES share is achieved in the individual,<br />
non-grid heat sector. Here solid biomass generated<br />
about 50 Mtoe in 2006 but only grows to 54 Mtoe in<br />
2030, whereas novel technologies like heat pumps<br />
(2.3 Mtoe) <strong>and</strong> solar thermal heat <strong>and</strong> water (3.4<br />
Mtoe) show bigger growth rates. Nevertheless,<br />
biomass plays a crucial role in the heat sector <strong>and</strong>,<br />
besides in the individual heating plants, is also often<br />
used in co-firing plants. With respect to the overall<br />
Table 1: Share of Renewable Energies in Electricity, Heat <strong>and</strong> Transport Fuel Dem<strong>and</strong><br />
t<br />
u<br />
p<br />
t<br />
u<br />
o<br />
y<br />
g<br />
r<br />
e<br />
n<br />
e<br />
-<br />
E<br />
-<br />
S<br />
E<br />
R<br />
]<br />
r<br />
a<br />
e<br />
y<br />
/<br />
h<br />
W<br />
T<br />
[<br />
% deployment 2006 2010<br />
<strong>European</strong> Union 27<br />
2020 2030<br />
Share of RES-E on electricity dem<strong>and</strong> 16% 20% 35% 50%<br />
Share of RES-H on heat dem<strong>and</strong> 10% 12% 20% 31%<br />
Share of RES-T on transport fuel dem<strong>and</strong> 1% 2% 8% 10%<br />
Share of RES on final dem<strong>and</strong> 9% 11% 20% 30%<br />
Share of RES on primary dem<strong>and</strong> 7% 9% 18% 26% (Eurostat convention)<br />
10% 13% 23% 35% (Substitution principle)<br />
1.400<br />
1.200<br />
1.000<br />
800<br />
600<br />
400<br />
200<br />
0<br />
2006 2010 2015 2020 2025 2030<br />
target achievement of 20 percent RES by 2020,<br />
which has failed under Business as Usual, it must<br />
be concluded that strong efforts have to be made<br />
in the heat sector to achieve a much higher growth<br />
rate than the 8.5 percent increase seen in Figure 5.<br />
Finally, the development of the renewable<br />
transport sector according to the Business as Usual<br />
scenario is given in Figure 6. Traditional biofuel<br />
generation triples beyond 2010 from 3 Mtoe as of<br />
2006 to 9 Mtoe by 2030. Additional contribution is<br />
expected from advanced biofuel generation (second<br />
Figure 4: Future Renewable <strong>Energy</strong> Generation within the Electricity Sector in the <strong>European</strong><br />
Union up to 2030 on Technology Level according to the Muddling Through Scenario<br />
Wind offshore<br />
Wind onshore<br />
Tide & wave<br />
Solar thermal electricity<br />
Photovoltaics<br />
Hydro large-scale<br />
Hydro small-scale<br />
Geothermal electricity<br />
Biowaste<br />
Solid biomass<br />
Biogas
<strong>Energy</strong> <strong>Security</strong>: Potential for EU-GCC Cooperation<br />
Figure 5: Future Renewable <strong>Energy</strong> Generation within the Heat Sector in the <strong>European</strong> Union<br />
up to 2030 on Technology Level according to the Muddling Through Scenario<br />
t<br />
u<br />
p<br />
t<br />
u<br />
o<br />
y<br />
g<br />
r<br />
e<br />
n<br />
e<br />
-<br />
H<br />
-<br />
S<br />
E<br />
R<br />
generation – Fischer Tropsch, etc.) beyond 2015 up<br />
to 3 Mtoe in 2030. However, substantial increases<br />
are still considered in the biofuel import from abroad<br />
which amounts to 14 Mtoe in 2030. Generally, as<br />
shown in Table 1 the Business as Usual scenario does<br />
not meet either the 20 percent RES by 2020 target<br />
or the 10 percent biofuel by 2020 target.<br />
In conclusion of this scenario, under Business<br />
as Usual conditions the largest renewable energy<br />
contribution is achieved in the electricity sector<br />
throughout Europe whereas the heat sector<br />
t<br />
u<br />
p<br />
t<br />
u<br />
o<br />
y<br />
g<br />
r<br />
e<br />
n<br />
e<br />
-<br />
T<br />
-<br />
S<br />
E<br />
R<br />
]<br />
r<br />
a<br />
e<br />
y<br />
/<br />
e<br />
o<br />
t<br />
M<br />
[<br />
]<br />
r<br />
a<br />
e<br />
y<br />
/<br />
e<br />
o<br />
t<br />
M<br />
[<br />
100<br />
90<br />
80<br />
70<br />
60<br />
50<br />
40<br />
30<br />
20<br />
10<br />
0<br />
30<br />
25<br />
20<br />
15<br />
10<br />
5<br />
0<br />
2006 2010 2015 2020 2025 2030<br />
almost levels off up to 2030 due to missing support<br />
incentives.<br />
2.1.2 europe Alone – strengthened national<br />
Policy:<br />
2006 2010 2015 2020 2025 2030<br />
Heat pumps<br />
Solar thermal heat. &<br />
water<br />
Solid biomass (non-grid)<br />
RES-H distr. heat<br />
RES-H CHP<br />
In contrast to the scenario above, the Europe<br />
Alone scenario is characterized by strong emphasis<br />
on climate change issues at the <strong>European</strong> level<br />
implying low energy dem<strong>and</strong> forecasts for the EU<br />
accompanied by relatively high raw energy <strong>and</strong> CO2<br />
prices but hardly any restrictions for the rest of the<br />
Figure 6: Future Renewable <strong>Energy</strong> Generation within the Transport Sector in the <strong>European</strong><br />
Union up to 2030 on Technology Level according to the Muddling Through Scenario<br />
Biofuel import<br />
Advanced biofuels<br />
Traditional biofuels
world. Hence, renewable energy support measures<br />
are strengthened with respect to effectiveness <strong>and</strong><br />
efficiency. The <strong>project</strong>ed sectoral contribution in<br />
relative terms – i.e. by indicating the deployment of<br />
RES-E, RES-H <strong>and</strong> RES-T as shares of corresponding<br />
gross dem<strong>and</strong>s is depicted in Table 2. A strong<br />
increase of the share of renewables can be observed<br />
throughout all sectors, where the electricity sector<br />
even takes off stronger beyond 2020. In total, the<br />
overall development of renewables meets the 20<br />
percent RES by 2020 target exactly; additionally,<br />
the biofuel target of 10 percent RES on diesel <strong>and</strong><br />
gasoline in 2020 will be met. The biggest share of RES<br />
is still <strong>project</strong>ed for the electricity sector where about<br />
half of the electricity dem<strong>and</strong> is met by renewables<br />
in 2030. Generally, the strong increase of about one<br />
percent each year of renewables between 2010 <strong>and</strong><br />
2020 even continues beyond 2020 <strong>and</strong> results at 30<br />
percent RES on gross final energy dem<strong>and</strong> in 2030.<br />
The RES development is separately discussed<br />
on the technology level for each energy sector.<br />
Overview of RES Characteristics <strong>and</strong> Future Scenarios<br />
Table 2: Share of Renewable Energies in Electricity, Heat <strong>and</strong> Transport Fuel Dem<strong>and</strong><br />
% deployment 2006 2010<br />
<strong>European</strong> Union 27<br />
2020 2030<br />
Share of RES-E on electricity dem<strong>and</strong> 16% 20% 35% 50%<br />
Share of RES-H on heat dem<strong>and</strong> 10% 12% 20% 31%<br />
Share of RES-T on transport fuel dem<strong>and</strong> 1% 2% 8% 10%<br />
Share of RES on final dem<strong>and</strong> 9% 11% 20% 30%<br />
Share of RES on primary dem<strong>and</strong> 7% 9% 18% 26% (Eurostat convention)<br />
10% 13% 23% 35% (Substitution principle)<br />
Caused by the high renewable energy share of about<br />
50 percent in the electricity sector, the total amount<br />
of RES-E in 2030, illustrated in Figure 7, cannot solely<br />
be produced by technologies that are already well<br />
established or close to the market. However, wind<br />
onshore (477 TWh/yr), large-scale hydro (325 TWh/<br />
yr), solid biomass (228 TWh/yr), biogas (134 TWh/yr),<br />
small hydro (65 TWh/yr) will still contribute about 61.3<br />
percent to RES-E production. Wind onshore already<br />
holds a higher share of RES-E than the currently<br />
dominant large-scale hydro power. In contrast,<br />
other RES-E options with huge future potentials<br />
such as PV (173 TWh/yr), solar thermal electricity<br />
(125 TWh/yr) or tidal & wave energy (72 TWh/yr),<br />
<strong>and</strong> especially wind offshore (360 TWh/yr), enter the<br />
market <strong>and</strong> achieve a strong <strong>and</strong> steadily growing<br />
share. Generally, improved support measures lead<br />
to a strong increase of the RES-E share with a broad<br />
portfolio of different technologies which is also a<br />
result of the overcoming of existing non-economic<br />
barriers.<br />
Figure 7: Future Renewable <strong>Energy</strong> Generation within the Electricity Sector in the <strong>European</strong><br />
Union up to 2030 on Technology Level according to the Europe Alone Scenario<br />
t<br />
u<br />
p<br />
t<br />
u<br />
o<br />
y<br />
g<br />
r<br />
e<br />
n<br />
e<br />
-<br />
E<br />
-<br />
S<br />
E<br />
R<br />
]<br />
r<br />
a<br />
e<br />
y<br />
/<br />
h<br />
W<br />
T<br />
[<br />
2.500<br />
2.000<br />
1.500<br />
1.000<br />
500<br />
0<br />
2006 2010 2015 2020 2025 2030<br />
Wind offshore<br />
Wind onshore<br />
Tide & wave<br />
Solar thermal electricity<br />
Photovoltaics<br />
Hydro large-scale<br />
Hydro small-scale<br />
Geothermal electricity<br />
Biowaste<br />
Solid biomass<br />
Biogas<br />
101
<strong>Energy</strong> <strong>Security</strong>: Potential for EU-GCC Cooperation<br />
Figure 8: Future Renewable <strong>Energy</strong> Generation within the Heat Sector in the <strong>European</strong><br />
Union up to 2030 on Technology Level according to the Europe Alone Scenario<br />
t<br />
u<br />
p<br />
t<br />
u<br />
o<br />
y<br />
g<br />
r<br />
e<br />
n<br />
e<br />
-<br />
H<br />
-<br />
S<br />
E<br />
R<br />
Like the electricity sector, the renewable heat<br />
sector provides a big portfolio of different technologies<br />
in case of strengthened national policy measures.<br />
However, the biggest share is still achieved in the<br />
individual, non-grid heat sector which is supplied by<br />
solid biomass, solar thermal heat <strong>and</strong> water as well<br />
as heat pumps. Nevertheless, as already mentioned,<br />
about 27 percent is supplied by more efficient<br />
Combined Heat <strong>and</strong> Power plants. Solid biomass<br />
generated about 50 Mtoe in 2006 <strong>and</strong> grows to 69<br />
Mtoe in 2030, whereas novel technologies, holding<br />
t<br />
u<br />
p<br />
t<br />
u<br />
o<br />
y<br />
g<br />
r<br />
e<br />
n<br />
e<br />
-<br />
T<br />
-<br />
S<br />
E<br />
R<br />
]<br />
r<br />
a<br />
e<br />
y<br />
/<br />
e<br />
o<br />
t<br />
M<br />
[<br />
]<br />
r<br />
a<br />
e<br />
y<br />
/<br />
e<br />
o<br />
t<br />
M<br />
[<br />
102<br />
180<br />
160<br />
140<br />
120<br />
100<br />
40<br />
35<br />
30<br />
25<br />
20<br />
15<br />
10<br />
80<br />
60<br />
40<br />
20<br />
5<br />
0<br />
0<br />
2006 2010 2015 2020 2025 2030<br />
2006 2010 2015 2020 2025 2030<br />
Heat pumps<br />
Solar thermal heat. &<br />
water<br />
Solid biomass (non-grid)<br />
RES-H distr. heat<br />
RES-H CHP<br />
hardly any share in 2006, like heat pumps (28 Mtoe)<br />
<strong>and</strong> solar thermal heat & water (19 Mtoe) show much<br />
bigger growth rates. Nevertheless, biomass plays<br />
a crucial role in the heat sector <strong>and</strong> besides in the<br />
individual heating plants also often used in cofiring<br />
plants. With respect to the overall target achievement<br />
of 20 percent RES by 2020, which is met under<br />
strengthened national policies, it must be concluded<br />
that strong efforts have to be put on the heat sector in<br />
order to achieve a much this doubling of renewables<br />
in the heat sector compared to the Business as Usual<br />
Figure 9: Future Renewable <strong>Energy</strong> Generation within the Transport Sector in the <strong>European</strong> Union<br />
up to 2030 on Technology Level according to the Europe Alone Scenario<br />
Biofuel import<br />
Advanced biofuels<br />
Traditional biofuels
case. Figure 8 shows the development of RES-H on<br />
technology level.<br />
Figure 9, shows the development of the<br />
renewable transport sector according to the<br />
strengthened national policy scenario. Traditional<br />
biofuel generation triples beyond 2010 from 3 Mtoe as<br />
of 2006 to 9 Mtoe by 2030. Additional contribution is<br />
expected from advanced biofuel generation (second<br />
generation – Fischer Tropsch, etc.) beyond 2015 going<br />
up to 10 Mtoe in 2030. Generally, traditional biofuel<br />
generation equals the amount under the Business<br />
as Usual scenario whereas still high exploitable<br />
potentials are considered in the advanced biofuel<br />
technologies. However, substantial increases are<br />
still considered in the biofuel import from abroad<br />
which amounts to 15 Mtoe in 2030. Consequently, as<br />
shown in Table 2, the strengthened national policy<br />
scenario does meet both the 20 percent RES by 2020<br />
target <strong>and</strong> the 10 percent biofuel by 2020 target; the<br />
latter refers to 10 percent biofuel on solely diesel <strong>and</strong><br />
gasoline dem<strong>and</strong>.<br />
Given the uneven distribution of RES potentials<br />
within the <strong>European</strong> Union, member states are<br />
entitled to install flexibility mechanisms in order to<br />
exploit their RES potentials in a least-cost approach.<br />
Generally, also in this scenario, the electricity sector<br />
is still the strongest contributor of renewable energy,<br />
but the heat sector takes up strongly.<br />
2.1.3 Global Regime (Full trade) –<br />
strengthened national Policy:<br />
Principally, the Global Regime (Full Trade)<br />
scenario implies a strong emphasis on climate<br />
change issues on not only the <strong>European</strong> level but<br />
on global scale. Hence, energy dem<strong>and</strong> growth<br />
forecasts are relatively low, but for Europe higher<br />
than the Europe Alone scenario, since it is not<br />
expected that the industry will strongly shift abroad.<br />
Overview of RES Characteristics <strong>and</strong> Future Scenarios<br />
Caused by the low energy dem<strong>and</strong> on global scale,<br />
raw energy prices are low <strong>and</strong> CO2 prices are not<br />
as high as in the Europe Alone scenario, due to<br />
the global trade opportunity. However, renewable<br />
energy support measures are strengthened with<br />
respect to effectiveness <strong>and</strong> efficiency in order<br />
to pursue the 20 percent RES by 2020 target. The<br />
<strong>project</strong>ed sectoral contribution in relative terms – i.e.<br />
by indicating the deployment of RES-E, RES-H <strong>and</strong><br />
RES-T as shares of corresponding gross dem<strong>and</strong>s is<br />
depicted in Table 3. Generally, a strong increase of<br />
the share of renewables can be observed throughout<br />
all sectors, although the electricity sector slightly<br />
slows down close to 2030 <strong>and</strong> more development<br />
is then <strong>project</strong>ed in the heat sector driven by a<br />
stronger dem<strong>and</strong> increase in the electricity sector<br />
beyond 2020. In total, the overall development<br />
of renewables meets the 20 percent RES by 2020<br />
target exactly; additionally the biofuel target of 10<br />
percent RES on diesel <strong>and</strong> gasoline in 2020 will be<br />
met. The biggest share of RES is still <strong>project</strong>ed for<br />
the electricity sector where slightly less than half<br />
of the electricity dem<strong>and</strong> is met by renewables in<br />
2030. Generally, the strong increase of about one<br />
percent each year of renewables between 2010 <strong>and</strong><br />
2020 even continues beyond 2020 <strong>and</strong> results at 29<br />
percent RES on gross final energy dem<strong>and</strong> in 2030.<br />
In the following, RES development is discussed<br />
in depth on technology level for each energy sector.<br />
In order to achieve the high renewables share of<br />
about 48 percent in the electricity sector, the total<br />
amount of RES-E in 2030, illustrated in Figure 10,<br />
a broad portfolio of different energy conversion<br />
technologies is required. However, wind onshore<br />
(442 TWh/yr), large-scale hydro (323 TWh/yr), solid<br />
biomass (233 TWh/yr), biogas (129 TWh/yr), small<br />
hydro (65 TWh/yr) will still contribute to about 60.6<br />
percent to RES-E production. Wind onshore already<br />
Table 3: Share of Renewable Energies in Electricity, Heat <strong>and</strong> Transport Fuel Dem<strong>and</strong><br />
% deployment 2006 2010<br />
<strong>European</strong> Union 27<br />
2020 2030<br />
Share of RES-E on electricity dem<strong>and</strong> 16% 20% 36% 48%<br />
Share of RES-H on heat dem<strong>and</strong> 10% 12% 19% 30%<br />
Share of RES-T on transport fuel dem<strong>and</strong> 1% 2% 8% 10%<br />
Share of RES on final dem<strong>and</strong> 9% 11% 20% 29%<br />
Share of RES on primary dem<strong>and</strong> 7% 9% 18% 25% (Eurostat convention)<br />
10% 13% 23% 33% (Substitution principle)<br />
10
<strong>Energy</strong> <strong>Security</strong>: Potential for EU-GCC Cooperation<br />
holds a higher share of RES-E than the currently<br />
dominant large-scale hydro power. Additionally,<br />
wind offshore shows the strongest overall increase<br />
<strong>and</strong> amounts to 343 TWh/yr in 2030 so that wind<br />
energy in total already provides 40 percent of the<br />
overall RES-E generation. In contrast, novel RES-E<br />
options with huge future potentials such as PV (180<br />
TWh/yr), solar thermal electricity (126 TWh/yr) or<br />
tidal <strong>and</strong> wave energy (71 TWh/yr) enter the market<br />
<strong>and</strong> achieve a strong <strong>and</strong> steadily growing share. It<br />
is necessary to emphasize that this broad portfolio<br />
of different technologies, required in order to meet<br />
the 20 percent target in 2020, is only achieved when<br />
the existing non-economic barriers are overcome.<br />
As discussed in the electricity sector, the<br />
renewable heat sector also holds a big portfolio<br />
of different technologies in case of strengthened<br />
national policy measures. Although the biggest<br />
share of RES-H is still achieved in the individual,<br />
non-grid sector which is supplied by solid biomass,<br />
solar thermal heat <strong>and</strong> water as well as heat pumps<br />
about one quarter of the overall renewable heat is<br />
generated centrally <strong>and</strong> connected to distribution<br />
<strong>net</strong>works. In contrast, within the non-grid connected<br />
heat supply solid biomass generated about 50 Mtoe<br />
in 2006 <strong>and</strong> grows to 70 Mtoe in 2030, whereas<br />
novel technologies, holding hardly any share in<br />
2006, like heat pumps (29 Mtoe) <strong>and</strong> solar thermal<br />
104<br />
heat <strong>and</strong> water (26 Mtoe) show much bigger growth<br />
rates. Hence, the scenario predicts a decrease of<br />
the share of solid biomass within the non-grid heat<br />
sector from almost 100 percent now to below<br />
45 percent up to 2030. Nevertheless, biomass<br />
Figure 10: Future Renewable <strong>Energy</strong> Generation within the Electricity Sector in the <strong>European</strong><br />
Union up to 2030 on Technology Level according to the Global Regime Scenario<br />
t<br />
u<br />
p<br />
t<br />
u<br />
o<br />
y<br />
g<br />
r<br />
e<br />
n<br />
e<br />
-<br />
E<br />
-<br />
S<br />
E<br />
R<br />
]<br />
r<br />
a<br />
e<br />
y<br />
/<br />
h<br />
W<br />
T<br />
[<br />
2.500<br />
2.000<br />
1.500<br />
1.000<br />
500<br />
0<br />
2006 2010 2015 2020 2025 2030<br />
Wind offshore<br />
Wind onshore<br />
Tide & wave<br />
Solar thermal electricity<br />
Photovoltaics<br />
Hydro large-scale<br />
Hydro small-scale<br />
Geothermal electricity<br />
Biowaste<br />
Solid biomass<br />
Biogas<br />
plays a crucial role in the heat sector <strong>and</strong>, besides<br />
the individual heating plants, is also often used in<br />
co-firing plants. With respect to the overall target<br />
achievement of 20 percent RES by 2020, which is<br />
met under strengthened national policies, it must<br />
be concluded that strong efforts have to be put<br />
on the heat sector in order to achieve a doubling<br />
of renewables in the heat sector compared to<br />
the Business as Usual case. Figure 11 shows the<br />
development of RES-H on technology level.<br />
Figure 12 illustrates, according to the strengthened<br />
national policy scenario, the development of the<br />
renewables in the transport sector. Generally, the<br />
global CO2 constraints scenario results in a slightly<br />
higher transport fuel dem<strong>and</strong>. Hence, the overall<br />
RES-T generation contributes to 37.4 Mtoe, but the<br />
allocation of the three major contributors equals<br />
the Europe Alone scenario. Traditional biofuel<br />
generation triples beyond 2010 from 3.4 Mtoe as of<br />
2006 to 11.2 Mtoe by 2030. Additional contribution is<br />
expected from advanced biofuel generation (second<br />
generation – Fischer Tropsch, etc.) beyond 2020 up<br />
to 10 Mtoe in 2030. Generally, traditional biofuel
Overview of RES Characteristics <strong>and</strong> Future Scenarios<br />
Figure 11: Future RES Generation within the Heat Sector in the EU on Technology Level<br />
according to the Global Regime Scenario<br />
t<br />
u<br />
p<br />
t<br />
u<br />
o<br />
y<br />
g<br />
r<br />
e<br />
n<br />
e<br />
-<br />
H<br />
-<br />
S<br />
E<br />
R<br />
]<br />
r<br />
a<br />
e<br />
y<br />
/<br />
e<br />
o<br />
t<br />
M<br />
[<br />
180<br />
160<br />
140<br />
120<br />
100<br />
80<br />
60<br />
40<br />
20<br />
0<br />
2006 2010 2015 2020 2025 2030<br />
generation equals the amount under the Business<br />
as Usual scenario whereas still high exploitable<br />
potentials are considered in the advanced biofuel<br />
technologies. However, substantial increases are still<br />
considered in the biofuel import from abroad which<br />
amounts to 17 Mtoe in 2030. Consequently, as shown<br />
in Table 3, the strengthened national policy scenario<br />
does meet both, the 20 percent RES by 2020 target<br />
<strong>and</strong> the 10 percent biofuel by 2020 target whereas<br />
the latter refers to 10 percent biofuel on solely diesel<br />
<strong>and</strong> gasoline dem<strong>and</strong>.<br />
2.2 Costs of Enhanced Renewable <strong>Energy</strong><br />
Generation<br />
Heat pumps<br />
Solar thermal heat. &<br />
water<br />
Solid biomass (non-grid)<br />
RES-H distr. heat<br />
RES-H CHP<br />
Based on the future <strong>project</strong>ions of renewable<br />
energies presented above, this section discusses the<br />
associated costs of the development in detail. The<br />
assessment of future renewable energy pathways<br />
<strong>and</strong> corresponding costs is based on the same<br />
scenario calculations seeking to meet the overall<br />
20 percent RES by 2020 target in the EU. Consumer<br />
expenditures caused by the different policy<br />
Figure 12: Future Renewable <strong>Energy</strong> Generation within the Transport Sector in the <strong>European</strong><br />
Union up to 2030 on Technology Level<br />
t<br />
u<br />
p<br />
t<br />
u<br />
o<br />
y<br />
g<br />
r<br />
e<br />
n<br />
e<br />
-<br />
T<br />
-<br />
S<br />
E<br />
R<br />
]<br />
r<br />
a<br />
e<br />
y<br />
/<br />
e<br />
o<br />
t<br />
M<br />
[<br />
40<br />
35<br />
30<br />
25<br />
20<br />
15<br />
10<br />
5<br />
0<br />
2006 2010 2015 2020 2025 2030<br />
Biofuel import<br />
Advanced biofuels<br />
Traditional biofuels<br />
10
<strong>Energy</strong> <strong>Security</strong>: Potential for EU-GCC Cooperation<br />
Figure 13: Annual Required Capital Expenditures in order to Achieve the Corresponding RES<br />
Generation for the Year 2006, 2010, 2020 <strong>and</strong> 2030 in Million Euro<br />
]<br />
€<br />
M<br />
[<br />
s<br />
d<br />
e<br />
e<br />
n<br />
t<br />
n<br />
e<br />
m<br />
t<br />
s<br />
e<br />
v<br />
n<br />
i<br />
l<br />
a<br />
u<br />
n<br />
n<br />
A<br />
themes on future energy pathways are depicted<br />
In more detail <strong>and</strong> discussed along with additional<br />
generation costs of the corresponding RES<br />
development.<br />
This paper focuses on the costs of the future<br />
development of renewable energies in all three<br />
energy sectors in line with the scenarios presented<br />
in the section above. Additionally, comparison of<br />
the deployment of renewable energies with the<br />
corresponding costs for the society will highlight the<br />
need for necessary design criteria for policy options.<br />
]<br />
€<br />
M<br />
[<br />
s<br />
t<br />
n<br />
a<br />
l<br />
p<br />
d<br />
e<br />
l<br />
l<br />
a<br />
t<br />
s<br />
n<br />
i<br />
w<br />
e<br />
n<br />
r<br />
o<br />
f<br />
s<br />
t<br />
s<br />
o<br />
c<br />
r<br />
e<br />
f<br />
s<br />
n<br />
a<br />
r<br />
T<br />
10<br />
120.000<br />
100.000<br />
80.000<br />
60.000<br />
40.000<br />
20.000<br />
0<br />
200.000<br />
160.000<br />
120.000<br />
80.000<br />
40.000<br />
0<br />
Muddling Through -<br />
Business as Usual<br />
RES-T total<br />
RES-H total<br />
RES-E total<br />
2006 2010 2020 2030<br />
RES-T total<br />
RES-H total<br />
RES-E total<br />
2006 2010 2020 2030<br />
120.000<br />
100.000<br />
80.000<br />
60.000<br />
40.000<br />
20.000<br />
0<br />
200.000<br />
160.000<br />
120.000<br />
80.000<br />
40.000<br />
0<br />
Europe Alone -<br />
Strengthened national policy<br />
2006 2010 2020 2030<br />
2006 2010 2020 2030<br />
120.000<br />
100.000<br />
80.000<br />
60.000<br />
40.000<br />
20.000<br />
2.2.1 Pathways of Res Deployment with<br />
Respect to its Costs<br />
0<br />
Global Regime - Full Trade -<br />
Strengthened national policy<br />
2006 2010 2020 2030<br />
First, the capital expenditures needed in all<br />
three sectors are analyzed with respect to the three<br />
different policy themes, the Mudding Through, the<br />
Europe Alone <strong>and</strong> the Global Regime presented<br />
above. In order to achieve an ambitious share of<br />
renewables by 2020, huge investments have to<br />
be undertaken. Thus, it is necessary to implement<br />
efficient <strong>and</strong> effective policy measures in order to<br />
Figure 14: Cumulated Transfer Costs to the Society due to RES Policy Measures according to Three Policy<br />
Themes in Million Euro on Sectoral Level<br />
Muddling Through -<br />
Business as Usual<br />
Europe Alone -<br />
Strengthened national policy<br />
200.000<br />
160.000<br />
120.000<br />
80.000<br />
40.000<br />
0<br />
Global Regime - Full Trade -<br />
Strengthened national policy<br />
2006 2010 2020 2030
keep the RES surcharges for the energy consumers<br />
at a low level. Consequently, this section discusses<br />
the resulting costs for the society caused by the<br />
support of RES for all three policy themes.<br />
Figure 13 demonstrates the annual needed capital<br />
expenditures within the Muddling Through - Business<br />
as Usual, Europe Alone - Strengthened National<br />
Policy <strong>and</strong> Global Regime (Full Trade) - Strengthened<br />
National Policy. Meeting the 20 percent RES by 2020,<br />
which only the two strengthened national policy<br />
schemes do, requires investments of about three<br />
times the investment needed in 2020 under current<br />
support options. Furthermore, comparing the three<br />
scenarios, it appears necessary that strong efforts<br />
have to be taken in the heat sector, where under BAU<br />
conditions only minor action is expected; meeting<br />
the 2020 target requires much higher contribution<br />
from the heat sector as well. Again, the capital<br />
expenditures reflect the higher energy dem<strong>and</strong> in<br />
the Global Regime (Full Trade) scenario, resulting in<br />
more needed capital expenditures. When it comes to<br />
the period 2020 to 2030, partly due to the huge cost<br />
reductions of certain technologies less investment<br />
is needed in order to achieve approximately the<br />
same growth rate of 1 percent RES annually. These<br />
costs reductions are mainly driven by the assumed<br />
technological learning effects as well as efficiency<br />
improvements especially of novel technologies<br />
such as wind offshore, photovoltaic or solar thermal<br />
energy.<br />
Transfer costs paid by the society are discussed<br />
in the following part. Depending on the support<br />
mechanism of RES plants, the investors receive<br />
a fixed or varying extra charge per energy unit<br />
generated on top of the energy market prices. Thus,<br />
transfer costs are determined by the difference of<br />
the cumulated costs of guaranteed support of RES<br />
plants to the energy wholesale market prices. These<br />
costs are then usually shared among all energy<br />
consumers. Thus, the design of financial support<br />
measures is very important to find the most efficient<br />
balance between the higher cost to the consumer<br />
<strong>and</strong> contribution from RES.<br />
With respect to the Muddling Through – Business<br />
as Usual case, the annual transfer costs paid by the<br />
society are shown in Figure 14 (left figure) on sectoral<br />
Overview of RES Characteristics <strong>and</strong> Future Scenarios<br />
level. In the Business as Usual case, although the<br />
stimulation of the RES markets is almost equal among<br />
the electricity <strong>and</strong> heat sector, the transfer costs are<br />
mainly relevant in the electricity sector. Since most<br />
of the realized renewable heat installations are<br />
within the individual sector they are already market<br />
competitive without additional support. However,<br />
keeping in mind that this scenario fails to meet the<br />
target in 2020 by far, strong emphasis has to be<br />
put in the renewable heat sector in this respect. In<br />
contrast, the transport sector lags behind in terms<br />
of RES generation but, nevertheless, is strongly<br />
dependent on financial support. In total, the policy<br />
costs amount to 42 billion Euro in 2020 <strong>and</strong> 63 billion<br />
Euro in 2030. With respect to the decrease of transfer<br />
costs in the year 2026 , it has to be taken into account<br />
that most RES technologies under Business as Usual<br />
conditions are eligible for financial support for 15 to<br />
20 years, hence new installations from 2006 to 2010<br />
are then on the market <strong>and</strong>, therefore, the overall<br />
policy costs are reduced.<br />
In contrast, in the Europe Alone – strengthened<br />
national policy case it is remarkable that on the<br />
one h<strong>and</strong>, obviously strong efforts are taken in the<br />
electricity sector, but on the other h<strong>and</strong>, transfer<br />
costs in the heat sector are expected to grow in the<br />
same magnitude. An ambitious RES deployment<br />
consequently asks for a strong contribution of all<br />
sectors. It is noticed that the transfer costs on sectoral<br />
as well as in total are increasing even more strongly<br />
beyond 2020. This fact is caused on the one h<strong>and</strong><br />
by residual transfer costs from installations before<br />
2020 as well as by the entry into the market of novel<br />
technologies, like solar <strong>and</strong> wind offshore energy.<br />
In total, the policy costs amount to 79.5 billion Euro<br />
in 2020 <strong>and</strong> 134 billion Euro in 2030. Special focus<br />
has to be put on the 2020 time horizon, when only<br />
less then a doubling of the overall transfer costs is<br />
sufficient to comply with the target but, as indicated<br />
above, covering three times more of the investment<br />
costs than in the Muddling Through case.<br />
Finally, expected transfer costs within the<br />
Global Regime (Full Trade) based on strengthened<br />
national RES policies are depicted in Figure 14. As<br />
in the Europe Alone scenario, the Global Regime<br />
case also seeks to meet the 20 percent RES target.<br />
10
<strong>Energy</strong> <strong>Security</strong>: Potential for EU-GCC Cooperation<br />
Hence, obviously strong efforts are taken in the<br />
electricity sector <strong>and</strong> the heat sector. With respect<br />
to total RES development, the Global Regime (Full<br />
Trade) only results in slightly higher numbers than<br />
the Europe Alone case due to the higher gross final<br />
energy dem<strong>and</strong> in the Global Regime (Full Trade).<br />
However, the resulting transfer costs are about 40<br />
percent more in the Global Regime (Full Trade), since<br />
the preconditioned global CO2 constraints lead to<br />
overall lower raw energy prices, which consequently<br />
increase the need for policy support for RES. Again,<br />
notable is that the transfer costs, both sectoral as<br />
well as overall, will increase more strongly beyond<br />
2020 due to residual transfer costs from installations<br />
before 2020 as well as when novel technologies, like<br />
solar <strong>and</strong> wind offshore energy, are entering into<br />
the market. In total, the policy costs amount to 112.5<br />
billion Euro in 2020 <strong>and</strong> 191.7 billion Euro in 2030.<br />
An in-depth analysis with respect to the achieved<br />
RES deployment <strong>and</strong> the corresponding costs<br />
according to the three policy themes is provided in<br />
Figure 15 on the 2020 time horizon. The Muddling<br />
Through scenario, representing a continuation of<br />
the currently implemented policy options, would<br />
lead to only 13.3 percent RES in 2020 at high transfer<br />
costs, covered by the energy consumer. Noneconomic<br />
barriers hamper a stronger development<br />
of renewables in general; additionally hardly any<br />
10<br />
support is available for the important sector of<br />
renewable heat. Furthermore, implemented policy<br />
options need to be strengthened with respect to<br />
their effectiveness, resulting in more RES installation<br />
due to improved usage of the transfer costs, <strong>and</strong><br />
their efficiency, meaning the difference of real RES<br />
generation costs <strong>and</strong> their (guaranteed) support<br />
Figure 15: Comparing Average Additional Generation Costs (Square) as well as Transfer Costs (Circle) for<br />
Consumer due to RES Support to the Achieved RES Share in 2020 for Different Dem<strong>and</strong> Projections<br />
level, in order to comply with the target. These<br />
improvements are necessary for the Europe Alone<br />
<strong>and</strong> Global Regime scenarios. Both scenarios meet<br />
the target but at different costs, due to the different<br />
dem<strong>and</strong> <strong>and</strong> energy price assumptions. Dem<strong>and</strong><br />
<strong>project</strong>ions influence the average generation costs<br />
while the energy price influences the transfer costs.<br />
Conclusion<br />
The use of renewable energy sources (RES)<br />
for electricity, heat or transport fuel production<br />
involves positive implications for the mitigation of<br />
climate change <strong>and</strong> for security of energy supply.<br />
In particular the domestic character of most RES<br />
facilitates the reduction of import dependency on<br />
fossil fuels. As most technology options using RES<br />
are not yet competitive with established technology<br />
options, the <strong>European</strong> Union encourages member<br />
states to promote the use of RES economically. As<br />
a consequence of political support measures, the<br />
strongest dynamic development could be observed
in the electricity sector, particularly with regard to<br />
the ‘new’ RES-technologies in Western <strong>European</strong><br />
countries. A broad portfolio of technologies is being<br />
developed, though technologies such as hydropower,<br />
wind energy <strong>and</strong> solid biomass energy still dominate<br />
the overall composition.<br />
Though there are positive impacts, an increased<br />
use of RES may constitute some risks for security<br />
of energy supply. In general, most RES-conversion<br />
technologies depend on the use of natural energy<br />
flows, resulting in a volatile character of the final<br />
energy output. These fluctuations may occur on<br />
varying time scales. Wind energy technologies or<br />
solar energy technologies show fluctuations on a<br />
short- to medium-term horizon, whereas hydro<br />
power output fluctuates rather on a seasonal level<br />
or even annually. The volatile character of some RES<br />
poses important challenges for the management of<br />
the electricity system <strong>and</strong> represents a risk for energy<br />
security. In addition, in both cases output volatilities<br />
are very sensitive to the electricity generation costs<br />
<strong>and</strong> may therefore have negative impacts on the<br />
economics of these plants.<br />
In terms of the potential of RES in the time<br />
horizon of 2030, about 35 percent of the total<br />
gross final energy dem<strong>and</strong> could be met by RES if<br />
all driving forces were active <strong>and</strong> all non-economic<br />
barriers were overcome. In a sectoral breakdown,<br />
this 35 percent is divided into 64 percent renewable<br />
electricity on gross final electricity dem<strong>and</strong>, 30<br />
percent renewable heat on gross final heat dem<strong>and</strong><br />
<strong>and</strong> about 11 percent of renewables in the transport<br />
sector. On the technology level, hydropower has<br />
historically dominated in the electricity sector <strong>and</strong><br />
solid biomass in the heat sector, but in the long term<br />
several options such as wind, solar <strong>and</strong> geothermal<br />
energy will play an important role. Of course, these<br />
potentials are distributed very differently among<br />
the 27 EU member states necessitating a flexible<br />
exploitation of these RES potentials in order to meet<br />
the agreed EU targets.<br />
Concerning the dem<strong>and</strong> <strong>project</strong>ions as well as<br />
raw energy prices, huge deviations appear regarding<br />
the three different, investigated policy themes<br />
(Muddling Through, Europe Alone <strong>and</strong> Global<br />
Regime [Full Trade]). Since ‘Muddling Through’<br />
Overview of RES Characteristics <strong>and</strong> Future Scenarios<br />
implies a continuation of currently set legislation<br />
with respect to energy dem<strong>and</strong> development as<br />
well as CO2 constraints it reflects a Business as<br />
Usual case. In contrast, two themes are developed<br />
within the SECURE <strong>project</strong>, which consider stronger<br />
CO2 constraints policies. The Europe Alone scenario<br />
expects that only Europe will care about CO2<br />
constraints, <strong>and</strong> hence shows less energy dem<strong>and</strong><br />
in the EU member states accompanied by high CO2<br />
costs, resulting in high wholesale energy prices.<br />
On the other h<strong>and</strong>, the Global Regime (Full Trade)<br />
considers similar CO2 constraints on a global scale,<br />
leading to a little higher energy dem<strong>and</strong> in Europe<br />
than in the Europe Alone scenario <strong>and</strong> shows lower<br />
raw energy prices.<br />
Principally, renewable energy sources offer a<br />
big potential to improve the security of supply due<br />
to domestic energy production on the one h<strong>and</strong><br />
<strong>and</strong> their decentralized character on the other. The<br />
increased RES deployment due to new installations<br />
in the case of strengthened RES support could lead<br />
to a reduction in fossil fuel dem<strong>and</strong> of yearly 539<br />
Mtoe by 2030. Oil imports can be reduced by 18<br />
percent, gas imports by 51 percent <strong>and</strong> coal imports<br />
by 68 percent. This will significantly increase the<br />
EU’s security of supply. In 2030, 150 billion Euro of<br />
fossil fuels can be saved, which corresponds to 0.88<br />
percent of GDP. This quantitative assessment is<br />
based on the Global Regime (Full Trade) scenario<br />
conducted by POLES energy modelling <strong>and</strong> the<br />
mo<strong>net</strong>ary figures refer to POLES energy prices. Given<br />
the energy prices as recently observed in all markets,<br />
saved expenses would still increase compared to the<br />
applied price developments. The results show that<br />
the 20 percent RES could be achieved at moderate<br />
cost, which illustrates the ability of RES to protect<br />
the EU economy against rising fossil fuel prices. The<br />
financial support provided to increase the support<br />
of RES in the coming years should reflect these<br />
benefits to EU’s supply security.<br />
The Muddling Through scenario only avoids about<br />
267 Mtoe fossil fuels consumption which corresponds<br />
to about 78 billion Euro, equalling 0.46 percent of the<br />
GDP in 2030. In contrast, the Europe Alone scenario<br />
based on strengthened national RES policies,<br />
implying improvements of currently implemented<br />
10
<strong>Energy</strong> <strong>Security</strong>: Potential for EU-GCC Cooperation<br />
policies with respect to efficiency <strong>and</strong> effectiveness,<br />
expects to meet the 20 percent RES target in 2020<br />
<strong>and</strong> shows the same level of ambition beyond 2020.<br />
The Europe Alone scenario only avoids about 540<br />
Mtoe fossil fuels consumption which corresponds<br />
to about 146 billion Euro, equalling 0.88 percent of<br />
the GDP in 2030. Finally, the Global Regime scenario<br />
based on strengthened national policy options<br />
foresees to meet the 20 percent RES target by 2020<br />
as well, wherein a continuation of the strong RES<br />
deployment is expected to grow until 2030.<br />
Taking into account the lessons learned from the<br />
assessment of future renewable energy pathways<br />
<strong>and</strong> the corresponding cost developments, some<br />
general conclusions can be drawn here:<br />
strong growth is needed in all three sectors<br />
A high share of renewable energies in the mid-<br />
to long term cannot be reached without strong<br />
increases in all three sectors: renewable electricity,<br />
heat <strong>and</strong> biofuels. The future policy framework<br />
should address this need for growth in all sectors.<br />
A wide range of technologies has to be supported<br />
Even a policy approach based on pure cost<br />
minimization would still need to support a wide<br />
110<br />
endnotes<br />
1.<br />
2.<br />
range of technologies: large-scale hydropower, solid<br />
biomass (for generation of both heat <strong>and</strong> power)<br />
<strong>and</strong> onshore wind power will be complemented by<br />
large amounts of offshore wind power, biogas <strong>and</strong><br />
small hydropower. Associated costs vary largely<br />
between technologies <strong>and</strong> over time. Consequently,<br />
any future policy framework has to address this<br />
sufficiently by providing technology specific support<br />
to the various RES options.<br />
Res policies should be supported by a strong<br />
energy efficiency policy<br />
As also indicated in the comparison of the Europe<br />
Alone <strong>and</strong> the Global Regime (Full Trade) scenario to<br />
the Muddling Through scenario, it can be concluded<br />
that in the absence of strong energy efficiency<br />
policies, energy dem<strong>and</strong> is higher <strong>and</strong> more RES is<br />
required in order to achieve the targeted share of 20<br />
percent by 2020. In that case, more expensive RES<br />
technologies have to be utilized <strong>and</strong> the average<br />
yearly transfer costs are expected to largely increase.<br />
This underpins the importance of energy efficiency<br />
policy <strong>and</strong> RES policy being used as complementary<br />
tools for creating a more sustainable energy system<br />
in an economically efficient way.<br />
S. Ölz, R. Sims, N. Kirchner. Contribution of Renewables to <strong>Energy</strong> <strong>Security</strong>, 2007.<br />
F. Sensfuß, M. Ragwitz, <strong>and</strong> M. Genoese. “The Merit-order Effect: A Detailed Analysis of the Price<br />
Effect of Renewable Electricity Generation on Spot Market Prices in Germany,” <strong>Energy</strong> Policy 36 no.<br />
8 (2008): 3086-3094.
References<br />
•<br />
•<br />
•<br />
•<br />
•<br />
•<br />
•<br />
•<br />
•<br />
•<br />
•<br />
•<br />
•<br />
Overview of RES Characteristics <strong>and</strong> Future Scenarios<br />
<strong>European</strong> Commission. 1997. <strong>Energy</strong> for the future: renewable sources of energy - White Paper for a<br />
community strategy <strong>and</strong> action plan . COM (1997) 599 final.<br />
<strong>European</strong> Commission. 2000. Towards a <strong>European</strong> strategy for the security of energy supply - Green<br />
Paper . COM (2000) 769 final.<br />
<strong>European</strong> Commission. 2007. Renewable energy road map - Renewable energies in the 21st century:<br />
building a more sustainable future. Communication from the Commission to the Council <strong>and</strong> the<br />
<strong>European</strong> Parliament . COM(2008) 19 final.<br />
Haas, R.; W. Eichhammer, C. Huber, O. Langniss, A. Lorenzoni, R. Madlener, P. Menanteau, P.E.<br />
Morthorst, A. Martins, A. Oniszk, J. Schleich, A. Smith, Z. Vass, A. Verbruggen, A. 2004. How to<br />
promote renewable energy systems successfully <strong>and</strong> effectively. In <strong>Energy</strong> Policy, 32 (6): 833-839.<br />
International <strong>Energy</strong> Agency. 2000. Experience curves for energy technology policy, Paris: OECD/IEA.<br />
International <strong>Energy</strong> Agency. 2008. World energy outlook 2008: OECD/IEA.<br />
Ölz, S.; R. Sims, <strong>and</strong> N. Kirchner. 2007. Contribution of renewables to energy security.<br />
Panzer, C., A. Held, G. Resch, <strong>and</strong> M. Ragwitz. 2009. Assessment of the potential impact of renewable<br />
energy sources on the security of supply, costs of energy security measures <strong>and</strong> policy support;<br />
SECURE deliverable D.5.5.2; http://www.secure-ec.eu/, 2009<br />
Ragwitz, M.; A. Held, G. Resch, T. Faber, R. Haas, <strong>and</strong> C. Huber. 2007. OPTRES. Assessment <strong>and</strong><br />
optimisation of renewable energy support schemes in the <strong>European</strong> electricity market: Fraunhofer<br />
IRB Verl., Stuttgart.<br />
Sensfuß, F.; M. Ragwitz, <strong>and</strong> M. Genoese. 2008. The merit-order effect: A detailed analysis of the<br />
price effect of renewable electricity generation on spot market prices in Germany. In <strong>Energy</strong> Policy<br />
36 (8): 3086-3094.<br />
The <strong>European</strong> Parliament <strong>and</strong> the Council of the <strong>European</strong> Union. 2001. Directive 2001/77/EC of the<br />
<strong>European</strong> Parliament <strong>and</strong> of the Council of 27 September 2001 on the promotion of electricity produced<br />
from renewable energy sources in the internal electricity market.<br />
The <strong>European</strong> Parliament <strong>and</strong> the Council of the <strong>European</strong> Union. 2003. Directive 2003/30/EC of the<br />
<strong>European</strong> Parliament <strong>and</strong> of the Council on the promotion of the use of biofuels or other renewable fuels<br />
for transport.<br />
The <strong>European</strong> Parliament <strong>and</strong> Council. 2009. Directive of the <strong>European</strong> Parliament <strong>and</strong> the Council<br />
on the promotion of the use of energy from renewable sources. Directive 2009/28/EC. Brussels, April<br />
23, 2009.<br />
111
Appendix<br />
seCURe Project: Draft Policy Recommendations<br />
There is no easy fix for ensuring long-term as<br />
well as short-term security of supply in the EU.<br />
Ensuring <strong>and</strong> improving security of supply requires<br />
the implementation of a number of policies <strong>and</strong><br />
recommendations. This section summarizes the<br />
main recommendations put forward by SECURE<br />
<strong>project</strong> partners at the end of three years of joint<br />
research activities on these challenging issues.<br />
1. seCURe’s energy Development<br />
scenarios<br />
Between now <strong>and</strong> 2050, humanity must face<br />
two intertwined problems: the growing scarcity of<br />
oil (<strong>and</strong> gas, but not coal) <strong>and</strong> the accumulation of<br />
greenhouse gases (GHG) in the atmosphere.<br />
These “bathtub problems” cannot be considered<br />
independently, as hydrocarbon scarcity paves the<br />
way to coal (<strong>and</strong>, hence, higher GHG emissions), while<br />
climate policies open the path to low carbon societies.<br />
“Smart” energy policies <strong>and</strong> associated international<br />
relations should combine the security, sustainability<br />
as well as competitiveness dimensions.<br />
A family of scenarios have been developed in<br />
the SECURE <strong>project</strong> using the POLES model. They<br />
illustrate the complex interactions of climate policies<br />
<strong>and</strong> energy security issues:<br />
1. The Muddling Through (MT) scenario describes<br />
the consequences of non-coordinated, low<br />
profile climate policies;<br />
2. The Muddling Through & Europe plus scenario<br />
(MT E+) describes the consequences of noncoordinated,<br />
low profile climate policies but with<br />
some leadership from Europe;<br />
3. The Europe Alone case (EA) represents the<br />
outcome of a scenario in which every country is<br />
free-riding … except the EU;<br />
4. The Global Regime (GR) explores a new world<br />
energy system, under strong emission constraint<br />
(EU-type).<br />
Scenarios with limited <strong>and</strong> uncoordinated action<br />
for reducing GHGs emissions, such as ‘Muddling<br />
Through,’ imply only weak signals in terms of carbon<br />
price, but as they mobilize the cheap part of the<br />
Marginal Abatement Cost curves, they already<br />
change significantly the level of emissions through<br />
reduced dem<strong>and</strong>, accelerated development of<br />
non-fossil energy <strong>and</strong> Carbon Capture <strong>and</strong> Storage.<br />
However, these scenarios do not succeed in meeting<br />
the emission targets deemed desirable in the latest<br />
IPCC Assessment Report (2007) in order to limit<br />
average temperature increase to 2°C above preindustrial<br />
levels.<br />
Scenarios with strong climate policies, such as<br />
Global Regime, clearly allow reducing both emissions<br />
<strong>and</strong> the level of tension on international hydrocarbon<br />
markets, through lower oil <strong>and</strong> gas production. This<br />
is a double dividend situation, probably the most<br />
important one to be derived from ambitious climate<br />
policies.<br />
Finally, scenarios with unilateral actions from<br />
Europe involving a change of paradigm for the<br />
<strong>European</strong> energy system (‘Europe Alone’) do not<br />
meet the climate target as the impacts of important<br />
efforts in Europe are not sufficient to induce massive<br />
emission reductions at world level, nor do they limit<br />
the risk of energy shocks. However, these scenarios<br />
have highly beneficial implications for Europe:<br />
• imposing strong emission reduction domestically<br />
results in a thorough restructuring of the <strong>European</strong><br />
energy system;<br />
11
<strong>Energy</strong> <strong>Security</strong>: Potential for EU-GCC Cooperation<br />
• in case of energy shocks, this restructuring will the uncertainties created. This case would provide<br />
allow Europe to be largely protected by lower a very challenging setting for the development<br />
energy dem<strong>and</strong>, higher contribution of domestic of cooperative relations between importer<br />
non-fossil fuels (renewable <strong>and</strong> nuclear) <strong>and</strong> a countries <strong>and</strong> their suppliers. New orientations<br />
much lower level of fossil fuel imports.<br />
may encompass economic collaboration on new<br />
Scenarios that involve no drastic change in low carbon technologies or reinforced economic<br />
Europe’s energy system imply the development cooperation in areas other than energy.<br />
of the energy security strategy in a conventional Scenarios with a new energy paradigm display<br />
setting: the main concern is to ensure that sufficient a lower dem<strong>and</strong> <strong>and</strong> higher share of non-fossil<br />
supply is available, particularly of oil <strong>and</strong> gas. The domestic sources, whether renewable or nuclear.<br />
<strong>Energy</strong> Charter that currently provides the basis for Primary energy dem<strong>and</strong> for oil <strong>and</strong> coal drops, while<br />
this policy is just one of the possible options. The gas dem<strong>and</strong> is much less affected.<br />
key issue is the possibility of a timely investment for Total electricity production is almost unchanged<br />
the development of huge production <strong>and</strong> transport in the new paradigm scenarios because electricity is<br />
capacities. In that case, the <strong>Energy</strong> Charter should the main carrier of decarbonisation. Moreover, the<br />
at least be completed by other policies.<br />
role of renewable, nuclear <strong>and</strong> CCS increases with<br />
One of the permanent requests of exporting the strengthening of the carbon constraint. Wind<br />
countries is for the importers to ensure the dem<strong>and</strong> <strong>and</strong> biomass play the major role in the increase of<br />
security that will guarantee the cost-effectiveness<br />
of the supply <strong>and</strong> transport investments. They also<br />
the renewable power plant capacity in Europe.<br />
call for the possibility of downstream investment. 2. oil<br />
This type of policy framework would result in There is no easy <strong>and</strong> immediate connection<br />
some upstream-downstream reintegration of between resource nationalism or political instability<br />
the industries with cross investments in common <strong>and</strong> global supply of oil <strong>and</strong> gas. This is emphatically<br />
<strong>project</strong>s or joint ventures. Based more on bilateral not because political developments are irrelevant<br />
relationships, this type of policy may, however, for influencing oil <strong>and</strong> gas supplies, but because<br />
enter into contradiction with the liberalization <strong>and</strong> this influence is highly variable <strong>and</strong> unpredictable.<br />
<strong>Energy</strong> Charter perspectives.<br />
Therefore, political considerations should not be<br />
Scenarios that imply a deep restructuring of the counted as the primary determinants of the oil <strong>and</strong><br />
<strong>European</strong> energy sector <strong>and</strong> energy dem<strong>and</strong> change gas markets but should be one of the factors that<br />
the market perspectives for the exporters. Dem<strong>and</strong>, political leaders take into account when they look at<br />
when impacted by strong environmental constraints those industries.<br />
in Europe, will display very different dynamics, in The existence of conditions of financial stability<br />
particular after 2030.<br />
<strong>and</strong> growth is crucially important in determining<br />
If Europe is alone in its efforts to develop a new the attitude of producing countries towards the<br />
energy paradigm, then it is highly probable that desirable level of production <strong>and</strong> exports. Financial<br />
energy exporters will follow investment profiles instability, negative returns on financial assets <strong>and</strong><br />
that will respond more to the dem<strong>and</strong> dynamics of protectionism against the oil-producing countries’<br />
the other regions. In that case, Europe may be less industrial exports all contribute to support the<br />
vulnerable to energy imports if its policy is successful, exporters’ view that it is best to keep resources in<br />
but more vulnerable in case of failure to implement the ground.<br />
the new paradigm.<br />
Similarly, expectations about future price<br />
If some kind of global climate regime is levels also influence political attitudes towards<br />
implemented, then energy will be more sustainable production <strong>and</strong> exports. Aggressive policies aimed<br />
in the long term, but in the short term there is a risk at decarbonisation <strong>and</strong> energy efficiency may have<br />
of producing countries under-investing because of an ambivalent effect: there may be a negative<br />
114
announcement effect, because producers will fear<br />
dem<strong>and</strong> destruction <strong>and</strong> invest less in exp<strong>and</strong>ing or<br />
maintaining capacity; <strong>and</strong> a positive market effect,<br />
when dem<strong>and</strong> is effectively reduced. Hence, the<br />
policy indication is not to entertain policy objectives<br />
which cannot realistically be reached, but to<br />
emphasize cooperation <strong>and</strong> pragmatism.<br />
Restrictions of Passage<br />
The most dramatic situation for world oil supply<br />
would be the closure of the Strait of Hormuz. The<br />
SECURE <strong>project</strong>’s analysis has shown that closing the<br />
Strait is not easily accomplished; a good part of the<br />
<strong>Gulf</strong> production could be sent from other ports of the<br />
region <strong>and</strong> the shortage of crude oil could be made<br />
up thanks to strategic stocks under the IEA frame.<br />
The recommendation is to maintain readiness to<br />
reorient oil flows as required. The burden of this task<br />
falls primarily on the oil-producing countries. At the<br />
same time, it is necessary to maintain the capability<br />
to reopen the Strait of Hormuz, in the unlikely event<br />
that it might effectively be closed.<br />
The <strong>European</strong> Union should aim at mitigating<br />
the danger of closure of other critical sea lanes which<br />
might be caused by navigation accidents through<br />
congested passages, the most critical situation<br />
being that of the Turkish Straits. An option would<br />
be to seek a revision of the Montreux Convention of<br />
1936, to allow for the imposition of size limitations<br />
<strong>and</strong> passage charges on tankers, to discourage free<br />
riding <strong>and</strong> create conditions for the commercial<br />
development of pipeline bypasses. The EU should<br />
aim at facilitating investment in infrastructure<br />
adapted to reduce the danger of accidents <strong>and</strong><br />
vulnerability, by offering financial incentives <strong>and</strong><br />
promoting even more stringent regulations for oil<br />
<strong>and</strong> chemical tankers.<br />
Functioning of the International Oil Markets<br />
The unsatisfactory functioning of the<br />
international oil markets <strong>and</strong> the resulting<br />
uncertainty <strong>and</strong> volatility in oil prices is the main<br />
security threat for future oil supplies. Price volatility<br />
<strong>and</strong> unpredictability is at the heart of the insecurity<br />
that is felt by <strong>European</strong> citizens <strong>and</strong> governments,<br />
while in fact physical availability, especially for<br />
SECURE Project: Draft Policy Recommendations<br />
oil, has never been in question. Price volatility <strong>and</strong><br />
unpredictability discourages investment at all<br />
stages of the industry <strong>and</strong> increases the danger of<br />
supply interruptions.<br />
The root cause of price volatility is the rigidity<br />
of dem<strong>and</strong> <strong>and</strong> supply in the short term. These are<br />
impossible to change <strong>and</strong> can only be alleviated<br />
through encouraging the accumulation of larger<br />
stocks. Increasing the relative weight of trading<br />
in real (“wet”) oil barrels rather than future paper<br />
contracts <strong>and</strong> their multiple derivatives would<br />
improve the situation. This hinges on the will <strong>and</strong><br />
initiative of major oil-producing countries, but the<br />
EU should engage in a dialogue to encourage the<br />
adoption of better price discovery methods.<br />
The EU can also move in the direction of shifting<br />
the emphasis of price discovery from spot to<br />
forward pricing (normally less volatile) by imposing<br />
a time lag between the announcement <strong>and</strong> the<br />
implementation of price changes at the retail oil<br />
products level. The possibility of a flexible <strong>and</strong><br />
adjustable price b<strong>and</strong> should also be studied, to<br />
avoid price bubbles <strong>and</strong>/or spikes.<br />
The EU should establish a public agency to invest<br />
in larger storage facilities to be offered for use to<br />
oil producers (be they national or international<br />
oil companies) at low cost. The agency should<br />
be empowered to issue certificates convertible<br />
in physical barrels: oil deposited into the storage<br />
would be exchanged for such certificates, <strong>and</strong><br />
certificates could be used to withdraw oil from<br />
storage. Stored oil certificates should be designed<br />
<strong>and</strong> regulated in such a way that they will be<br />
accepted as collateral by financial institutions.<br />
The availability of an “oil bank” of this kind would<br />
encourage investment in capacity additions in<br />
anticipation of dem<strong>and</strong>, thus contributing to more<br />
comfortable supply conditions. In this perspective,<br />
the role of strategic stocks (which are rarely used<br />
<strong>and</strong> have not prevented or helped in containing<br />
major price oscillations), should also be redesigned.<br />
Their importance should be revisited in favor of<br />
a more flexible policy of encouragement to the<br />
accumulation of industry stocks.<br />
Vertical reintegration <strong>and</strong> reciprocity could<br />
also help. Specifically, the national oil companies<br />
11
<strong>Energy</strong> <strong>Security</strong>: Potential for EU-GCC Cooperation<br />
of major producing countries should be allowed<br />
to invest downstream in the <strong>European</strong> markets<br />
establishing their own distribution <strong>net</strong>works, so as<br />
to acquire direct access to the final consumer; in<br />
the same way <strong>European</strong> firms should have the same<br />
possibility in producing countries.<br />
3. natural Gas<br />
Recent times have seen considerable dynamism<br />
in the gas market in Europe. Concurrently, there has<br />
been a major Ukraine-Russia gas crisis, a collapse in<br />
the spot price of natural gas, new <strong>European</strong> natural<br />
gas security of supply regulation, an unprecedented<br />
increase in global Liquefied Natural Gas (LNG)<br />
supply, <strong>and</strong> finally, the mass production of natural<br />
gas from unconventional sources in the US as a<br />
result of technological advancements which had a<br />
huge impact on world gas markets.<br />
<strong>Security</strong> of dem<strong>and</strong> <strong>and</strong> security of supply<br />
are complementary issues in ensuring an overall<br />
balance in the security of natural gas supply in<br />
the EU. <strong>Security</strong> of dem<strong>and</strong> requires the EU<br />
to provide clearer signals regarding future gas<br />
dem<strong>and</strong> in Europe to facilitate investment both<br />
internally <strong>and</strong> externally. A pertinent threat exists<br />
in underinvestment in bringing on new supplies by<br />
exporters or in the development of necessary new<br />
infrastructure due to contradictory estimates in gas<br />
dem<strong>and</strong>. The present lack of clarity within the EU<br />
<strong>and</strong> underinvestment would lead to serious security<br />
of supply issues in natural gas that could not be<br />
solved in the short or medium terms. Therefore, the<br />
EU should develop a gas dem<strong>and</strong> forecast which is<br />
based on the amalgamation of energy policies <strong>and</strong><br />
individual national plans.<br />
National <strong>and</strong> regional differences imply that<br />
security of supply levels <strong>and</strong> mitigation tools will<br />
necessarily differ between countries <strong>and</strong> regions.<br />
The Baltic countries <strong>and</strong> parts of the South East of<br />
the EU have significantly lower levels of security<br />
of supply <strong>and</strong> are subject to regional <strong>and</strong> countryspecific<br />
circumstances, which call for an overall<br />
EU security of supply policy that will allow for<br />
adjustment of measures <strong>and</strong> policies to specific<br />
regional circumstances. The model applied in the<br />
Baltic <strong>Energy</strong> Market Interconnection Plan (BEMIP)<br />
11<br />
could be applied for this regional focus, allowing<br />
for action with resolve in a certain region.<br />
The process of gas market development <strong>and</strong> the<br />
continued liberalization of the EU’s markets are not<br />
yet fully realized, <strong>and</strong> there is a pressing need to go<br />
ahead with these measures to ensure long-term<br />
security in gas supply. Market structures on the<br />
national scale in the EU remain highly concentrated,<br />
interconnection <strong>project</strong>s must be realized, <strong>and</strong><br />
regulation should be clear <strong>and</strong> facilitate the market<br />
in investments. Furthermore, gas prices in the EU<br />
should reflect supply <strong>and</strong> dem<strong>and</strong> of gas in the long<br />
run. Legislation should continuously be reviewed<br />
<strong>and</strong> the goal of creating a fully functioning gas<br />
market should be a focal point for legislators both<br />
national <strong>and</strong> in the EU.<br />
EU gas market operators have been shown to<br />
invest in markets <strong>and</strong> not necessarily in security of<br />
supply. This means that markets alone will not solve<br />
the current issues of low security of supply in some<br />
countries, especially where markets are poorly if<br />
at all developed, as in the case of Baltic countries.<br />
Increasing security of gas supply in these regions is<br />
likely to be dependent on government intervention<br />
<strong>and</strong>/or EU regulation.<br />
Further diversification for areas with a current<br />
low level of suppliers <strong>and</strong> routes can be ensured<br />
by reverse flow <strong>and</strong> interconnection as well as new<br />
supply routes, both pipelines <strong>and</strong> LNG. Dem<strong>and</strong><br />
flexibility should be studied further regarding its<br />
ability to mitigate security of supply issues in the EU.<br />
The development <strong>and</strong> strengthening of early<br />
warning <strong>and</strong> crisis prevention mechanisms at the<br />
EU level as well as the implementation of regional<br />
emergency plans should be encouraged.<br />
Regarding gas transits across Ukraine, the<br />
possibility of an independent transmissions operator<br />
in the Ukraine composed of Ukrainian, EU, <strong>and</strong><br />
Russian operators should be seriously evaluated.<br />
Such cooperation would significantly enhance<br />
security of supply reducing the chances of bilateral<br />
disputes affecting gas supply, <strong>and</strong> additionally<br />
ensuring much needed investment in the Ukraine<br />
transmission infrastructure.<br />
Although production of unconventional gas<br />
in the United States has already had the indirect
effect of increasing redirected LNG supply to<br />
Europe, the potential of unconventional gas in<br />
Europe to significantly impact security of supply is<br />
presently unclear, <strong>and</strong> such resources should only<br />
be considered to have a potential impact in the<br />
medium to long term. Nevertheless, legislation<br />
regarding unconventional gas production should be<br />
streamlined <strong>and</strong> reviewed in order to accompany<br />
any potential unconventional gas>s development<br />
<strong>and</strong> to make sure that any lacuna regarding the<br />
law of its production is addressed. Additionally, an<br />
accurate survey of its potential production in Europe<br />
should be generated in order to evaluate its potential<br />
impact <strong>and</strong> provide a degree of clarification about<br />
recoverable resources.<br />
With the relevance of traditional suppliers<br />
such as Norway <strong>and</strong> Algeria poised to decline in<br />
the midterm, there is a need for Europe to have a<br />
robust policy with Russia, but also with the Caspian<br />
<strong>and</strong> Middle East regions, that shows pragmatism,<br />
partnership <strong>and</strong> commitment to their development<br />
as gas export partners with Europe as they are<br />
expected to play a more important role in <strong>European</strong><br />
gas supply after 2030.<br />
4. Coal <strong>and</strong> Carbon Capture, transport <strong>and</strong><br />
storage (CCts)<br />
The real issue in <strong>European</strong> steam coal supply<br />
security is not resource availability, but rather<br />
the absence of an economically <strong>and</strong> politically<br />
sustainable use of coal due to obstacles in the<br />
implementation of CCTS. Given the availability of<br />
coal, the continuing public financial support to the<br />
sector becomes harder <strong>and</strong> harder to justify.<br />
On the resource side, virtually all major exporters<br />
can be considered as “safe” countries in geopolitical<br />
terms <strong>and</strong> no sudden supply disruption on political<br />
grounds can reasonably be expected. Short-term<br />
supply disruptions may occur due to natural disasters,<br />
or due to social tensions, which lead to strikes. Yet,<br />
efficient supply management with stockpiling <strong>and</strong><br />
supply diversification can reduce the short-term<br />
risk of disruption for <strong>European</strong> import countries.<br />
Therefore, we suggest that:<br />
• Market monitoring should continue, particularly<br />
for developments in specific regions (China)<br />
SECURE Project: Draft Policy Recommendations<br />
• Competition authorities should continue to<br />
monitor international coal markets, particularly<br />
mergers <strong>and</strong> acquisitions of large coal <strong>and</strong> mining<br />
companies<br />
On the utilization side, there is an implicit<br />
supply security threat, i.e. that coal will no longer<br />
be an essential element of <strong>European</strong> energy<br />
supply, because the CCTS rollout will be delayed<br />
or never carried out. There is justified concern<br />
that the ambitious development plans in CCTS<br />
demonstration as outlined in the IEA Technology<br />
Roadmap over the next decade will not be met.<br />
This is based on a lack of determination on the part<br />
of public authorities to overcome the significant<br />
obstacles inherent in the complexity of the CCTS<br />
chain, <strong>and</strong> the difficulties of the power sector<br />
in embracing a technology that challenges the<br />
business model of coal electrification. In Europe,<br />
the economic use of coal in the power sector <strong>and</strong><br />
in industry could be threatened. Coal substitution<br />
in industrial processes could pose even larger<br />
challenges than in electricity production.<br />
Recent estimations find a significant decline<br />
in <strong>European</strong> storage potential <strong>and</strong> transport<br />
infrastructure. Further, increased public opposition<br />
to onshore storage will most likely necessitate<br />
offshore solutions. This will raise the costs <strong>and</strong> the<br />
technical complexity of the CCTS chain, questioning<br />
the role of CCTS as a cornerstone of a strategy to<br />
decarbonise <strong>European</strong> energy systems. The SECURE<br />
<strong>project</strong> therefore recommends that:<br />
• The potential contribution of CCTS to a<br />
decarbonised <strong>European</strong> electricity sector should<br />
be reconsidered given new data available on CCTS<br />
costs, a better underst<strong>and</strong>ing of the complexity<br />
of the process chain <strong>and</strong> the lowered CO2 storage<br />
potential.<br />
• Europe has an important role to play in keeping<br />
the technology options open <strong>and</strong> avoiding<br />
premature intellectual property appropriation.<br />
The EU co-funded <strong>project</strong>s should make new<br />
knowledge widely available, <strong>and</strong> a competition<br />
between <strong>project</strong>s should be promoted that<br />
yields the highest chances of achieving technical<br />
progress.<br />
•<br />
The huge <strong>and</strong> readily available funds for CCTS<br />
11
<strong>Energy</strong> <strong>Security</strong>: Potential for EU-GCC Cooperation<br />
•<br />
•<br />
•<br />
•<br />
•<br />
11<br />
should be rapidly deployed. Where industry does<br />
not respond, the legal <strong>and</strong> regulatory framework<br />
should be readjusted <strong>and</strong> the level of incentives<br />
should be raised. In the absence of a credible CO2<br />
price path, forcing utilities into a capture ready<br />
option will raise the costs of the st<strong>and</strong>ard plants<br />
but will not incentivize CCTS investment.<br />
The strong focus on the implementation of<br />
CCTS in the power sector observed in the past<br />
should be extended to industry, which can be<br />
highly vulnerable to an ab<strong>and</strong>onment of coal.<br />
Due to a larger number of small emissions<br />
sources, this poses higher challenges to <strong>net</strong>work<br />
development.<br />
Early planning of transport routes is of paramount<br />
importance should large-scale CCTS deployment<br />
ever become reality. At least in this phase, the<br />
state will be needed as a major provider in the<br />
development of transportation infrastructure,<br />
including planning <strong>and</strong> siting.<br />
Construction <strong>and</strong> operation can be tendered<br />
to the private sector, or carried out by stateowned<br />
<strong>net</strong>work firms. Routing pipelines along<br />
existing <strong>net</strong>works can lower costs <strong>and</strong> public<br />
rejection. Thus, synergies with other energy<br />
<strong>net</strong>work infrastructure (gas, electricity) should be<br />
considered.<br />
Future regulation should specify the allocation<br />
<strong>and</strong> financing principles as well as access for<br />
third parties. Sufficient incentives for the private<br />
sector to manage the <strong>net</strong>work development are<br />
unlikely, given the political, regulatory, technical,<br />
<strong>and</strong> economic uncertainties.<br />
If Europe fails to fill its role as CCTS pioneer, new<br />
strategies for the global roll-out of CCTS are<br />
needed. The inclusion of CCTS under the Clean<br />
Development Mechanism could help to bring the<br />
technology to the markets. However, this would<br />
also imply the outsourcing of potential risks<br />
associated with the technology.<br />
5. nuclear<br />
In order to fulfill climate policy goals, nuclear<br />
energy may have to play a relevant role in worldwide<br />
<strong>and</strong> EU long-term energy balances. However,<br />
according to IEA <strong>and</strong> EC energy scenarios, the EU<br />
nuclear share is expected to halve between now <strong>and</strong><br />
2030. As nuclear is presently providing two thirds of<br />
all low carbon electricity in the EU, this will create an<br />
even larger strain on fulfilling CO2 targets.<br />
In fact, the so often announced nuclear<br />
renaissance is having a difficult birth: With 148 aging<br />
reactors in operation in 15 member states, there are<br />
presently just four reactors under construction in the<br />
EU (one in Finl<strong>and</strong>, one in France, two in Bulgaria ).<br />
Reasons for the stalling renaissance of nuclear energy<br />
are: i- social acceptability (political opposition) for a<br />
technology which is perceived as dangerous <strong>and</strong> for<br />
which the permanent waste disposal issue has still<br />
not been solved; ii- lack of human capacity (Europe’s<br />
industrial capacity of building nuclear power plants<br />
is said to be limited to maximum four per year;<br />
other regions seem to have the same problem<br />
of aging workforce) which is expected to worsen<br />
over the next years as specialists retire; iii- strongly<br />
increasing investment cost for nuclear power due to,<br />
among others, improved safety <strong>and</strong> environmental<br />
st<strong>and</strong>ards (contrary to the general energy capital<br />
cost index which has fallen by 20-30 percent since<br />
its peak in 2008, nuclear costs do not seem to have<br />
fallen over the last years); iv- technical problems<br />
with the new third generation designs of all major<br />
manufacturers resulting in huge cost-overruns<br />
for the first realizations of the new designs; v- the<br />
difficulty to finance hugely capital intensive plants<br />
in a market environment <strong>and</strong> in particular after the<br />
financial crises; vi- the increasing uncertainty on<br />
construction costs raise some doubts on the ability<br />
of nuclear power to foster a decrease in prices.<br />
In this context, government action is essential<br />
to:<br />
• promote public debates on nuclear safety, energy<br />
security of supply <strong>and</strong> climate change issues<br />
• guiding investor assurances in licensing<br />
procedures<br />
• promote human capital building<br />
• explore regional centers for high-level waste<br />
disposal<br />
• clear the position of decommissioning funds<br />
•<br />
create a level playing field for low carbon<br />
technologies via an effective EU-wide emission<br />
trading system <strong>and</strong>/or carbon tax.
As member states retain sovereignty over energy<br />
mixes, local political/public consent <strong>and</strong> support is<br />
vital.<br />
The same high safety st<strong>and</strong>ards as for<br />
nuclear reactors must be applied to all elements<br />
of the associated infrastructure: conversion,<br />
enrichment, fuel fabrication, spent fuel storage<br />
<strong>and</strong> reprocessing. Accumulated knowledge <strong>and</strong><br />
experience, both upstream <strong>and</strong> downstream, are<br />
reflected in existing safety rules. They must be<br />
strictly applied in any country using nuclear energy.<br />
The EU should put all its geopolitical weight to<br />
make sure these rules are respected everywhere<br />
<strong>and</strong> to promote non-proliferation. In fact, a major<br />
nuclear accident anywhere in the world will have<br />
dramatic consequences also on <strong>European</strong> nuclear<br />
development.<br />
6. Renewable energy sources (Res)<br />
In order to decrease import dependency<br />
<strong>and</strong> promote decarbonisation of the <strong>European</strong><br />
energy system, the increased use of RES should<br />
be supported in the electricity, heat <strong>and</strong> transport<br />
sector by means of renewable support policies.<br />
Therefore, general recommendations are:<br />
A high share of renewable energies in the mid-<br />
to long-term cannot be reached without strong<br />
increases in all three sectors: renewable electricity<br />
(RES-E), heat (RES-H) <strong>and</strong> biofuels. The current policy<br />
framework in the individual member states does<br />
include an extensive set of supporting mechanisms<br />
for RES-E <strong>and</strong>, to some extent, for biofuels, but<br />
the current limited <strong>and</strong> dispersed support for RES-<br />
H needs to be addressed in the future. Concerning<br />
biofuels, efforts should be directed to develop<br />
second generation biofuels.<br />
The general approach should be to keep a level<br />
playing field among different technologies, so that<br />
most efficient solutions can emerge from market<br />
forces, rather than being selected by policy makers.<br />
The present technological uncertainty suggests<br />
the need to maintain some public support to a wide<br />
range of technologies, at least until the relative<br />
merits of different solutions emerge on the basis of<br />
solid experience. Consequently, any future policy<br />
framework should consider providing technology-<br />
SECURE Project: Draft Policy Recommendations<br />
specific support to the various RES options. However,<br />
this policy should entail periodic reviews of the<br />
incentive schemes, in the light of a possible future<br />
phasing out.<br />
Efforts to support RES are needed in all member<br />
states. The uneven distribution of RES potentials<br />
<strong>and</strong> costs emphasizes the need for intensified<br />
cooperation between member states, where<br />
suitable accompanying flexibility mechanisms can<br />
assist the achievement of national RES targets in an<br />
efficient <strong>and</strong> effective manner.<br />
RES policies should be supported by a strong<br />
energy efficiency policy. Modelling results indicate<br />
that in the absence of strong energy efficiency<br />
policies, energy dem<strong>and</strong> is higher <strong>and</strong> more RES is<br />
required in order to achieve the targeted share of<br />
20 percent by 2020. Consequently, more expensive<br />
renewable energy technologies have to be utilized<br />
<strong>and</strong> the average yearly policy costs are expected to<br />
increase largely.<br />
To face the challenges resulting from an<br />
increased share of fluctuating wind electricity,<br />
several potential remedies may be applied:<br />
• Forecasting tools <strong>and</strong> imbalances management<br />
should be improved. Wind power prediction tools<br />
enable energy suppliers to forecast the variations<br />
of the power outputs which are typical for wind<br />
power plants. The implementation of forecasting<br />
tools may increase the maximum amount of<br />
wind power that can be accommodated in the<br />
<strong>net</strong>work.<br />
• Trading at the intra-day market platform would<br />
imply a correction of all the imbalances whereas<br />
the imbalance payments only apply for the <strong>net</strong><br />
system imbalances (that, in case of low wind<br />
pe<strong>net</strong>ration, could be only 50 percent of the total<br />
imbalances).<br />
• Storage systems such as pumped-storage<br />
•<br />
hydropower plants, hydro reservoirs, compressed<br />
air storage, flywheels or batteries may be used<br />
to contribute to managing the integration of<br />
fluctuating generation. However, some of the<br />
mentioned technological options are not yet<br />
competitive in economic terms.<br />
Smart grids providing intelligent services in<br />
addition to its initial purpose of delivering<br />
11
<strong>Energy</strong> <strong>Security</strong>: Potential for EU-GCC Cooperation<br />
electricity to the consumers, may contribute<br />
to the operation of the electricity system. By<br />
enabling intelligent monitoring <strong>and</strong> an improved<br />
control of supply <strong>and</strong> dem<strong>and</strong>, system reliability<br />
<strong>and</strong> the security of supply can be improved.<br />
• Finally, the reinforcement <strong>and</strong>, if necessary, the<br />
extension of the electricity grid represents one<br />
main option of how large amounts of fluctuating<br />
electricity can be integrated into the electricity<br />
system.<br />
Looking at the longer term, a beneficial political<br />
<strong>and</strong> regulatory framework promoting solar energy<br />
imports from North Africa should be created,<br />
including options for granting these <strong>project</strong>s priority<br />
status under EU infrastructure <strong>project</strong>s as well<br />
as promoting the development <strong>and</strong> operation of<br />
<strong>European</strong> <strong>and</strong> trans-Mediterranean super-grids.<br />
7. electricity<br />
One of the main barriers to long-term<br />
investments in the electricity sector (that usually are<br />
quite capital intensive) is regulatory uncertainty: it is<br />
fundamental to guarantee investors with some basic<br />
key conditions under which they will have to operate,<br />
in order to let them correctly assess their risks.<br />
Generation<br />
Electricity generation is a liberalized market,<br />
which has proven able to develop in a reasonable<br />
way without excessive state interference. However,<br />
a monitoring of the adequacy of capacity remains<br />
appropriate. To this end, Transmission System<br />
Operators (TSOs) should be given the task to<br />
determine how much new generation capacity of the<br />
different types (e.g. base load, mid-merit, peakers)<br />
may be needed to meet the security st<strong>and</strong>ards,<br />
when <strong>and</strong> where (the location in the <strong>net</strong>work is very<br />
important), having regard to the cost-effectiveness<br />
of the proposed solution.<br />
In case public authorities were to identify<br />
significant security problems, they could set up<br />
incentive/obligation schemes (through instruments<br />
such as tendering procedures, capacity payments,<br />
capacity markets, etc.) to induce investors to pursue<br />
the “optimal” development of the generation set<br />
outlined by TSOs. Of course, it is desirable that all<br />
120<br />
this process is coordinated <strong>and</strong> harmonized at the<br />
EU level (by ENTSO-E <strong>and</strong> ACER) to increase its<br />
effectiveness <strong>and</strong> to avoid market distortions.<br />
Transmission<br />
A significant increase of cross-border<br />
transmission capacity is highly desirable. To this end<br />
(but also in case of development of intra-national<br />
transmission lines), it is necessary:<br />
• to pursue a more stable <strong>and</strong> harmonized<br />
regulatory framework at the <strong>European</strong> level, under<br />
the control of the Agency for the Cooperation of<br />
<strong>Energy</strong> Regulators (ACER);<br />
• to pursue more harmonized, efficient <strong>and</strong> clear<br />
permitting procedures at all administrative levels,<br />
requiring the compliance with general framework<br />
guidelines; permitting procedures should have<br />
a reasonable <strong>and</strong> m<strong>and</strong>atory time limit for their<br />
duration (e.g. three years);<br />
•<br />
to gain social acceptance by clearly stating <strong>and</strong><br />
quantifying the public benefits of the <strong>project</strong>s<br />
especially from the security of supply, sustainability<br />
(in particular when renewable energy flows are<br />
involved) <strong>and</strong> economic points of view. This latter<br />
issue is very important to gain consensus: people<br />
must know that the realization of the <strong>project</strong>s<br />
will reduce their electricity bills (either by imports<br />
of cheaper energy) or by direct compensations;<br />
moreover, the strategic importance that<br />
characterizes cross-border transmission <strong>project</strong>s<br />
must be highlighted with the support of the<br />
highest political decision-making levels.<br />
Regulation should be designed to provide<br />
“locational signals”, i.e. the spatial (zonal/nodal)<br />
differentiation of electricity prices (due to maximum<br />
transfer capability constraints <strong>and</strong> losses on the<br />
lines) <strong>and</strong> of transmission charges (calculated on the<br />
basis of how much each agent uses the <strong>net</strong>work).<br />
The provision of such signals can lead to a more<br />
efficient system operation in the short-term <strong>and</strong> can<br />
promote a more optimized siting of new generators<br />
<strong>and</strong> loads in the long-term.<br />
Distribution<br />
As to the progressive transformation of<br />
distribution <strong>net</strong>works from “passive” to “active” <strong>and</strong>
“smart” <strong>net</strong>works, cooperation among international,<br />
<strong>European</strong> <strong>and</strong> national st<strong>and</strong>ardization bodies,<br />
regulatory authorities, grid operators <strong>and</strong><br />
manufacturers should be encouraged to further<br />
improve open communication protocols <strong>and</strong><br />
st<strong>and</strong>ards for information management <strong>and</strong> data<br />
exchange, to achieve interoperability of smart grid<br />
devices <strong>and</strong> systems <strong>and</strong> to get rid of technical<br />
barrier to their deployment.<br />
From a regulatory point of view, how to support<br />
distribution <strong>net</strong>work companies in their investments<br />
in such innovative technologies, to ensure that their<br />
deployment provides a cost-effective solution to<br />
the needs of <strong>net</strong>work users, is a key issue. From<br />
this perspective, both incentive <strong>and</strong> minimum<br />
requirements regulation should be based on the<br />
quantification, through appropriate indicators, of<br />
the effects <strong>and</strong> benefits of such investments in<br />
“smartness.”<br />
8. Impacts of severe Accidents <strong>and</strong><br />
terrorist threat on energy security<br />
The energy sector is both a key resource <strong>and</strong> a<br />
critical infrastructure for the economy that forms<br />
the backbone of today’s society, its goods <strong>and</strong><br />
services. Therefore, the comparative assessment of<br />
accident risks is a pivotal aspect in a comprehensive<br />
evaluation of energy security concerns.<br />
Effects of severe accidents <strong>and</strong> terrorist attacks<br />
are interrelated to a variety of other energy security<br />
facets including vulnerability to transient or longterm<br />
physical disruptions to import supplies,<br />
geopolitical dependencies due to imported resources,<br />
price fluctuations as a result of single events with<br />
extremely large consequences, increased likelihood<br />
for accidents due to infrastructure ageing <strong>and</strong><br />
underinvestment, <strong>and</strong> enhanced awareness of<br />
disasters because of global climate change.<br />
Among centralized large-scale technologies<br />
in industrialized countries, estimated expected<br />
accident risks are by far the lowest for hydro <strong>and</strong><br />
nuclear while fossil fuel chains exhibit the highest<br />
risks. On the other h<strong>and</strong>, the maximum credible<br />
consequences of low frequency hypothetical severe<br />
accidents, which can be viewed as a measure of risk<br />
aversion, are by far highest for nuclear <strong>and</strong> hydro<br />
SECURE Project: Draft Policy Recommendations<br />
(given high population density downstream from the<br />
dam), in the middle range for fossil chains, <strong>and</strong> very<br />
small for solar <strong>and</strong> wind. For nuclear, the maximum<br />
consequences are expected to be strongly reduced<br />
for the GEN IV plant compared with GEN III.<br />
Severe accidents affecting energy infrastructure<br />
can be costly <strong>and</strong> can affect other critical<br />
infrastructure due to dependencies on energy supply.<br />
In most cases, the effects of severe accidents on<br />
security of supply are of short-term character due to<br />
redundancies. Severe nuclear accidents could cause<br />
a long-term problem in electricity supply primarily<br />
due to potential secondary effects of such accidents,<br />
negatively affecting nuclear energy in general.<br />
There are also concerns for hydro, particularly in<br />
small countries with relatively few large dams <strong>and</strong><br />
high dependence on their output.<br />
Decentralized energy systems are less<br />
sensitive to severe accidents than the centralized<br />
ones.<br />
Allocating appropriate resources for maintaining<br />
high safety st<strong>and</strong>ards of nuclear power plants <strong>and</strong><br />
hydro dams is of central importance also for security<br />
of supply.<br />
The first-of-its-kind analyses of the terrorist<br />
threat by means of scenario quantification for<br />
selected energy infrastructure facilities (e.g. oil<br />
refinery, LNG terminal, hydro dam, <strong>and</strong> nuclear<br />
power plant) were carried out by the SECURE<br />
<strong>project</strong>. For this purpose, a tool was developed<br />
that allows for a quantification of risk, integrates<br />
uncertainty assessment, <strong>and</strong> provides estimates for<br />
several consequence categories using a Probabilistic<br />
Safety Assessment (PSA) approach. Analysis of<br />
uncertainties is of particular relevance because<br />
luckily there is no historical experience of extreme<br />
scenarios <strong>and</strong> access to terrorist databases is very<br />
limited.<br />
In spite of large uncertainties, the analysis<br />
indicates that the frequency of a successful terrorist<br />
attack with very large consequences is of the<br />
same order of magnitude as can be expected for a<br />
disastrous accident in the respective energy chain.<br />
This is primarily due to the fact that centralized large<br />
energy installations are hard targets <strong>and</strong> relatively<br />
easy to protect, requiring sophisticated attack<br />
121
<strong>Energy</strong> <strong>Security</strong>: Potential for EU-GCC Cooperation<br />
scenarios to cause significant damage <strong>and</strong> lasting<br />
impacts. Terrorists prefer to attack soft targets that<br />
are more vulnerable <strong>and</strong> may cause a larger number<br />
of fatalities.<br />
9. the Dem<strong>and</strong> Dimension of energy<br />
security<br />
In general, the promotion of a greater end-use<br />
energy efficiency should hold the first place in any<br />
energy policy, since most actions in this field have a<br />
“negative” cost, therefore they are more economically<br />
efficient than actions to support RES development<br />
<strong>and</strong> to reduce CO2 emissions (such as Carbon Capture<br />
<strong>and</strong> Storage technologies). Dem<strong>and</strong> Response<br />
should be encouraged, with a rapid <strong>and</strong> extensive<br />
deployment of enabling technologies, such as smart<br />
metering. Moreover, Dem<strong>and</strong> Response programs<br />
should be designed so as to provide strong (i.e. able<br />
to ensure a substantial economic convenience in<br />
case of response) signals, as well as be simple <strong>and</strong><br />
easily underst<strong>and</strong>able by consumers.<br />
SECURE’s analysis of the relationship between<br />
energy efficiency <strong>and</strong> energy security, has shown<br />
that energy efficiency policies in the EU do work, but<br />
there is no silver bullet able to successfully address<br />
different policy objectives such as energy security<br />
<strong>and</strong> energy efficiency, unless it is so general that it<br />
naturally encompass different sectors <strong>and</strong> energy<br />
uses.<br />
What seems to work is the policy mix: the good<br />
news is that currently in Western Europe a policy<br />
menu is in place that has produced significant<br />
improvements in energy efficiency, has reduced<br />
the amount of carbon emissions generated by the<br />
economic system, <strong>and</strong> has contributed to a more<br />
secure energy supply for Europe. On the other h<strong>and</strong>,<br />
more fine-tuning <strong>and</strong> coordination among member<br />
states is required in order to reap the potential<br />
benefits of enhanced energy efficiency also in<br />
terms of energy security. In this sense, the 20-20-20<br />
strategy <strong>and</strong>, in general, the proactive attitude of<br />
the EU in the field of climate change policy could be<br />
important opportunities.<br />
This suggests that it would be advisable to<br />
continue EU Action Plans <strong>and</strong> make them binding<br />
wherever effective. In this process, differences<br />
122<br />
in the responsiveness of energy consuming<br />
sectors to efficiency policies should be taken into<br />
account: SECURE’s analysis has highlighted, for<br />
instance, that m<strong>and</strong>atory st<strong>and</strong>ards for electrical<br />
appliances seem to work better for the residential<br />
sector, whereas measures supporting information,<br />
education <strong>and</strong> training are more effective in the<br />
industrial sector.<br />
Cross-cutting measures, in particular those<br />
related to market-based instruments, are those<br />
having the strongest influence both on energy<br />
security <strong>and</strong> energy efficiency. From this perspective,<br />
it is recommended to consider the development of<br />
white certificate market models at EU level. Due<br />
account should be taken of successful deployment<br />
in some member states.<br />
Dem<strong>and</strong> Response is profitable only if electricity<br />
markets are structurally subject to variations,<br />
which can be absorbed by the flexibility offered by<br />
customers. There are no pre-defined solutions as<br />
these hinge on structural conditions. Market design<br />
is crucial as it should exploit all the potential of DR;<br />
restrictions in flexibility should be clearly analyzed<br />
<strong>and</strong> not discarded for the sake of simplicity.<br />
Network regulation also has an important role,<br />
both at the transmission <strong>and</strong> the distribution level,<br />
<strong>and</strong>, in particular, where there is the interaction with<br />
the majority of customers <strong>and</strong> where a future large<br />
deployment of Distributed Generation is possible,<br />
which shares a very similar customer base with DR.<br />
Metering, that is, the ability to control <strong>and</strong> give<br />
detailed measures of electricity flows, is the key<br />
driver for the implementation of DR.<br />
The role of a public intervention aimed at curbing<br />
structural inefficiencies should be evaluated, not<br />
only in terms of financial support, but also in terms of<br />
creating a market with a clear <strong>and</strong> stable regulatory<br />
framework, in which Europe-wide st<strong>and</strong>ardization<br />
will reduce the costs of adaptation to national<br />
markets.<br />
10. Conclusions<br />
<strong>Security</strong> of supply should be addressed only<br />
within a wider, consistent approach that integrates<br />
the other two fundamental pillars of the EU<br />
energy policy: sustainability <strong>and</strong> competitiveness.
“Smart” energy policies must combine these three<br />
dimensions without neglecting the international<br />
relations context.<br />
<strong>European</strong> climate policies bring a significant<br />
double dividend in terms of reduced vulnerability<br />
to energy shocks, even in a non-cooperative<br />
framework. But energy scenarios opening the path<br />
to low carbon energy systems require an improved<br />
framework <strong>and</strong> incentives for electricity (including<br />
renewable) investment, a high degree of integration<br />
of the <strong>European</strong> electricity systems, a favorable<br />
institutional <strong>and</strong> regulatory framework for Carbon<br />
Capture Transport <strong>and</strong> Storage (CCTS), <strong>and</strong> an<br />
objective stance towards nuclear development. In<br />
addition to supply policies, dem<strong>and</strong> policies too<br />
must be strongly pursued.<br />
Since none of the requisites above are selfevident,<br />
<strong>and</strong> should low-carbon technologies fail to<br />
be available in time, the whole transition path to a<br />
low carbon economy would be at risk. Governments<br />
might thus be required to step in <strong>and</strong> provide<br />
adequate support. The most efficient way for the EU<br />
to develop cost-effective low carbon energy use is<br />
to have a generalized <strong>and</strong> viable EU-wide emission<br />
trading system capable of delivering st<strong>and</strong>ardized<br />
carbon prices or an effective EU-wide carbon tax.<br />
SECURE Project: Draft Policy Recommendations<br />
This is an important example of an area where<br />
energy security of supply <strong>and</strong> market development<br />
converge.<br />
Another area where the energy security of supply<br />
<strong>and</strong> the competitiveness dimensions converge is<br />
the internal market’s development. Integration of<br />
markets by developing regulatory policies, which<br />
enhance interconnections in gas <strong>and</strong> electricity<br />
infrastructure <strong>and</strong> thus foster competition, would<br />
be a big step in the right direction for <strong>European</strong><br />
security of supply.<br />
The unsatisfactory functioning of the<br />
international oil markets <strong>and</strong> the resulting<br />
uncertainty <strong>and</strong> volatility in oil prices is seen as the<br />
main security threat for future oil supplies because<br />
it hinders investment. Measures to reduce this<br />
artificially increasing volatility should be envisaged.<br />
Climate policies strongly influence the menu of<br />
policy solutions to energy security problems <strong>and</strong><br />
illustrate the type of uncertainties that the EU <strong>and</strong> its<br />
energy suppliers will have to face in the next decades.<br />
Efforts are thus needed to combine institutional<br />
solutions with a dialogue with EU’s partners on a<br />
medium-term programming of investments in the<br />
energy sector, in a balanced perspective of mutual<br />
underst<strong>and</strong>ing.<br />
12
<strong>Gulf</strong> Research Center Foundation