flow, cumecs - FreshwaterLife
flow, cumecs - FreshwaterLife
flow, cumecs - FreshwaterLife

Create successful ePaper yourself
Turn your PDF publications into a flip-book with our unique Google optimized e-Paper software.
Fish and Flows in the Suffolk<br />
Stour<br />
Graeme Peirson, Roy Sedgwick,<br />
Robin Burrough & RosWright
Relationships between coarse fish<br />
populations and <strong>flow</strong>s…..<br />
• Why do we need to know ?<br />
– More pressure on water resources, increasing<br />
demand<br />
– Catchment Abstraction Management Systems<br />
(CAMS)<br />
– Low <strong>flow</strong>s – Resource Assessment Methodology<br />
(RAM)<br />
– How much water can we take, when and where,<br />
to have minimal impact on aquatic ecosystems ?<br />
– Climate change – drier summers, warmer winters<br />
- how will it affect fisheries ?
Relationships between coarse fish<br />
populations and <strong>flow</strong>s…..<br />
• High <strong>flow</strong>s may also be important<br />
– Compensation releases, water transfer schemes<br />
– Climate change – some scenarios predict more<br />
summer flood events and most predict wetter<br />
winters.
Suffolk Stour<br />
• Long dataset with regular sampling<br />
• Consistent approach<br />
• Already intensively collated and<br />
analysed
Population Dynamics Model<br />
• Fish Population Dynamics Model<br />
– powerful statistical model - Bayesian inference<br />
– draws information from raw data and combines<br />
this to improve estimates of parameters about<br />
which we have little direct information<br />
• inaccurate ageing (older fish)<br />
• low catchability of younger age-groups<br />
– interpolation
PDM<br />
• Estimates of uncertainty<br />
• Better quality and quantity of raw data -<br />
more accurate and precise the output, hence<br />
PDM is no substitute for good data
0+ density (/100m2)<br />
0.4<br />
0.35<br />
0.3<br />
0.25<br />
0.2<br />
0.15<br />
0.1<br />
0.05<br />
0<br />
Chub recruitment, Lower Stour<br />
1973<br />
1974<br />
1975<br />
1976<br />
1977<br />
1978<br />
1979<br />
1980<br />
1981<br />
1982<br />
1983<br />
Long-term average<br />
1984<br />
1985<br />
1986<br />
1987<br />
1988<br />
1989<br />
Year<br />
1990<br />
1991<br />
1992<br />
1993<br />
Significantly better than average<br />
Significantly worse than average<br />
No significant difference<br />
1994<br />
1995<br />
1996<br />
1997<br />
1998<br />
1999<br />
2000<br />
2001<br />
2002<br />
2003<br />
2004
Fish recruitment and <strong>flow</strong>….<br />
• Can we detect any “signal” of <strong>flow</strong><br />
impacts on coarse fish population<br />
dynamics?
Ely Ouse transfer water in<br />
- Kirtling Green<br />
Upper Stour<br />
Abstraction<br />
- Wixoe<br />
Lower Stour<br />
Abstraction - Stratford<br />
Stratford-Flatford<br />
Abstraction - Cattawade
Stour investigations<br />
• Lower Stour: Sudbury-Stratford St. Mary<br />
– Flow Data from Lamarsh<br />
– Temperature data estimated for Wixoe<br />
– Good numbers of fish of three main spp -<br />
roach, chub,dace<br />
– Possible impacts of Ely Ouse transfer less<br />
marked than in Upper Stour
Flow, cumec<br />
Flow, cumec<br />
Flow, cumec<br />
5<br />
4<br />
3<br />
2<br />
1<br />
0<br />
1972<br />
1.0<br />
0.5<br />
0.0<br />
0.3<br />
0.2<br />
0.1<br />
0<br />
River Stour, Lamarsh mean daily <strong>flow</strong> Apr-Sept 1972-2004<br />
FLOWS…..<br />
River Glem, Glemsford, mean daily <strong>flow</strong> 1972-2000<br />
apr-sept<br />
1972<br />
1974<br />
1974<br />
1976<br />
1976<br />
1978<br />
1978<br />
1980<br />
1980<br />
1982<br />
1982<br />
1984<br />
1984<br />
1986<br />
1986<br />
year<br />
1988<br />
year<br />
River Box, Polstead, Mean Daily <strong>flow</strong>s, April-Sept,<br />
1972-2000<br />
1972<br />
1974<br />
1976<br />
1978<br />
1980<br />
1982<br />
1984<br />
1986<br />
Year<br />
1988<br />
1988<br />
1990<br />
1990<br />
1990<br />
1992<br />
1992<br />
1992<br />
1994<br />
1994<br />
1994<br />
1996<br />
1996<br />
1996<br />
1998<br />
1998<br />
1998<br />
2000<br />
2000<br />
2000<br />
2002<br />
2004
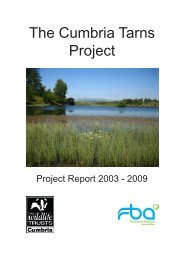
Priory Meadow
0+, no /100m2<br />
6<br />
4<br />
2<br />
0<br />
Recruitment and mean Daily<br />
Flow, April-September<br />
roach<br />
0.0 1.0 2.0 3.0 4.0 5.0<br />
<strong>flow</strong> , <strong>cumecs</strong><br />
0+, no<br />
/100m2<br />
0.4<br />
0.2<br />
0<br />
chub<br />
0+, no /100m2<br />
0.00 2.00 4.00 6.00<br />
6<br />
4<br />
2<br />
0<br />
<strong>flow</strong>, <strong>cumecs</strong><br />
dace<br />
0.00 1.00 2.00 3.00 4.00 5.00<br />
<strong>flow</strong> , <strong>cumecs</strong>
0+ length, mm<br />
60<br />
50<br />
40<br />
30<br />
20<br />
10<br />
0<br />
Autumn 0+ length and Mean<br />
Daily Flow April-September<br />
roach<br />
0.00 1.00 2.00 3.00 4.00 5.00<br />
<strong>flow</strong>, <strong>cumecs</strong><br />
0+ length,mm<br />
0+length, mm<br />
70<br />
60<br />
50<br />
40<br />
30<br />
20<br />
10<br />
0<br />
chub<br />
60<br />
50<br />
40<br />
30<br />
20<br />
10<br />
0<br />
0.00 1.00 2.00 3.00 4.00 5.00<br />
<strong>flow</strong>, <strong>cumecs</strong><br />
dace<br />
0.00 1.00 2.00 3.00 4.00 5.00<br />
<strong>flow</strong> , <strong>cumecs</strong>
0+ no/100m2<br />
0+ no/100m2<br />
6<br />
5<br />
4<br />
3<br />
2<br />
1<br />
0<br />
6<br />
5<br />
4<br />
3<br />
2<br />
1<br />
0<br />
Recruitment and <strong>flow</strong> during<br />
critical periods -dace<br />
April<br />
R 2 = 0.032<br />
0 1 2 3 4 5 6 7 8<br />
<strong>flow</strong>, cumec<br />
June<br />
R 2 = 0.0188<br />
0 1 2 3 4 5 6 7<br />
<strong>flow</strong>, cumec<br />
0+ no/100m2<br />
0+ length mm<br />
6<br />
5<br />
4<br />
3<br />
2<br />
1<br />
0<br />
May R 2 = 0.0902<br />
0 1 2 3 4 5 6 7<br />
70<br />
60<br />
50<br />
40<br />
30<br />
20<br />
10<br />
0<br />
<strong>flow</strong>, cumec<br />
July<br />
R 2 0.0957 =<br />
0 0.5 1 1.5 2 2.5 3<br />
<strong>flow</strong>, cumec
0+ no/100m2<br />
6<br />
4<br />
2<br />
0<br />
Intensity of <strong>flow</strong> events ? – low <strong>flow</strong>s<br />
roach recruitment<br />
0 10 20 30 40 50<br />
Flow-days
No./100m2<br />
Ely Ouse Transfer Scheme<br />
• Did it protect fish from very low <strong>flow</strong>s ?<br />
5<br />
4<br />
3<br />
2<br />
1<br />
0<br />
– River Box – doesn’t receive augmentation <strong>flow</strong>s<br />
Roach recruitment river Box<br />
0 0.1 0.2 0.3<br />
Mean daily <strong>flow</strong>, cumec<br />
No./100m2<br />
6<br />
4<br />
2<br />
0<br />
No./100m2<br />
Chub recruitment River Box<br />
0 0.1 0.2 0.3<br />
Mean daily <strong>flow</strong>, cumec<br />
8<br />
6<br />
4<br />
2<br />
0<br />
Dace recruitment River Box<br />
R 2 0.1561 =<br />
0 0.1 0.2 0.3<br />
Mean daily <strong>flow</strong>, cumec
0+ no/100m2<br />
River Brett<br />
• Perceived to “suffer from low <strong>flow</strong>s”<br />
• Perhaps some impact on dace<br />
• Possible interaction with water quality<br />
12<br />
10<br />
8<br />
6<br />
4<br />
2<br />
0<br />
Roach recruitment, R. Brett<br />
0.000 0.100 0.200 0.300 0.400 0.500 0.600 0.700<br />
summer mean daily <strong>flow</strong>, cumec<br />
0+ no/100m2<br />
6<br />
5<br />
4<br />
3<br />
2<br />
1<br />
0<br />
Dace recruitment, R. Brett,<br />
0.000 0.100 0.200 0.300 0.400 0.500 0.600 0.700<br />
summer mean daily <strong>flow</strong>, cumec
0+ no. per<br />
100m2<br />
0+ no/100m 2<br />
0+ no/100m 2<br />
6<br />
4<br />
2<br />
0<br />
6<br />
4<br />
2<br />
0<br />
Intensity of <strong>flow</strong> events - high <strong>flow</strong>s ?<br />
roach vs <strong>flow</strong> -days > 1 cumec<br />
6<br />
4<br />
2<br />
0<br />
0 200 400 600<br />
<strong>flow</strong> -days > 1cumec, 72-04<br />
roach vs <strong>flow</strong>-days> 2 cumec<br />
0 100 200 300 400 500<br />
Flow-days > 2 cumec<br />
roach vs <strong>flow</strong>-days> 5 cumec,<br />
0 50 100 150 200 250 300<br />
Flow-days > 5 cumec<br />
0+density no.<br />
per 100m2<br />
0+ no/100m2<br />
0+ no/100m 2<br />
6<br />
4<br />
2<br />
6<br />
4<br />
2<br />
0<br />
dace vs <strong>flow</strong> -days > 1 cumec<br />
0 100 200 300 400 500 600<br />
<strong>flow</strong>-days > 1cumec, 72-04<br />
dace vs <strong>flow</strong>-days> 2 cumec<br />
0<br />
0 100 200 300 400 500<br />
6<br />
4<br />
2<br />
0<br />
Flow-days > 2 cumec<br />
dace vs <strong>flow</strong>-days> 5cumec<br />
0 50 100 150 200 250 300<br />
Flow-days > 5 cumec<br />
0+ no/100m 2<br />
0+density no.<br />
per 100m2<br />
0.4<br />
0.3<br />
0.2<br />
0.1<br />
chub vs <strong>flow</strong> -days > 1 cumec<br />
0<br />
0 100 200 300 400 500 600<br />
<strong>flow</strong>-days > 1cumec, 72-04<br />
chub vs <strong>flow</strong>-days> 2 cumec<br />
0.4<br />
0.3<br />
0.2<br />
0.1<br />
0<br />
0 100 200 300 400 500<br />
0+ no/100m 2<br />
0.4<br />
0.3<br />
0.2<br />
0.1<br />
0<br />
Flow-days > 2 cumec<br />
chub vs <strong>flow</strong>-days> 5 cumec<br />
0 50 100 150 200 250 300<br />
Flow-days > 5 cumec
mdf, <strong>cumecs</strong><br />
5.000<br />
4.000<br />
3.000<br />
2.000<br />
1.000<br />
0.000<br />
Timing rather than volume ?<br />
Dace hatch<br />
01/04/1997<br />
01/05/1997<br />
Mean daily <strong>flow</strong>s April 97-Mar 98<br />
Roach<br />
01/06/1997<br />
01/07/1997<br />
01/08/1997<br />
01/09/1997<br />
01/10/1997<br />
date<br />
01/11/1997<br />
01/12/1997<br />
01/01/1998<br />
01/02/1998<br />
01/03/1998
Timing rather than volume ?<br />
Summary - dace<br />
Good recruitment years: <strong>flow</strong> event >1.36 cumec
19<br />
18<br />
17<br />
16<br />
15<br />
14<br />
1972<br />
Mean daily water temperatures Apr-Sept 1975-2004,<br />
Wixoe (estimated)<br />
1974<br />
What does cause recruitment<br />
1976<br />
1978<br />
1980<br />
1982<br />
variability ?<br />
1984<br />
1986<br />
1988<br />
1990<br />
1992<br />
1994<br />
1996<br />
1998<br />
2000<br />
2002<br />
2004
0+ density<br />
0+ density<br />
0+ density<br />
Temperature, recruitment & growth - Middle<br />
6<br />
4<br />
2<br />
0<br />
6<br />
4<br />
2<br />
0<br />
Roach recruitment<br />
15 15.5 16 16.5 17 17.5 18 18.5 19<br />
Mean daily temp apr-sept<br />
Dace recruitment<br />
y = 0.9602x - 14.416<br />
R 2 = 0.3262<br />
15 15.5 16 16.5 17 17.5 18 18.5 19<br />
0.4<br />
0.2<br />
0<br />
Mean daily temp apr-sept<br />
Chub recruitment<br />
y = 0.0556x - 0.8235<br />
R 2 = 0.172<br />
15 15.5 16 16.5 17 17.5 18 18.5 19<br />
Mean daily temp apr-sept<br />
Stour<br />
0+ length<br />
0+ length<br />
0+ length<br />
Roach 0+length<br />
60<br />
50<br />
40<br />
30<br />
20<br />
10<br />
0<br />
15 15.5 16 16.5 17 17.5 18 18.5 19<br />
70<br />
60<br />
50<br />
40<br />
30<br />
50<br />
40<br />
30<br />
20<br />
10<br />
0<br />
Mean daily temp apr-sept<br />
Dace 0+length<br />
y = 4.4201x - 27.906<br />
R 2 = 0.1966<br />
15 15.5 16 16.5 17 17.5 18 18.5 19<br />
Mean daily temp apr-sept<br />
Chub 0+length<br />
y = 9.3052x - 128.99<br />
R 2 = 0.2367<br />
15 15.5 16 16.5 17 17.5 18 18.5 19<br />
Mean daily temp apr-sept
Summary<br />
• No detectable impact of low <strong>flow</strong>s upon<br />
coarse fish populations in the Stour.<br />
• Some evidence that high <strong>flow</strong>s at critical<br />
times can affect recruitment.<br />
• THIS DOES NOT MEAN TO SAY THAT<br />
CHANGING FLOW REGIMES WILL<br />
NOT AFFECT THE FISH COMMUNITY.