laboratory “freak wave” generation for the study of extreme ... - FZK
laboratory “freak wave” generation for the study of extreme ... - FZK
laboratory “freak wave” generation for the study of extreme ... - FZK

You also want an ePaper? Increase the reach of your titles
YUMPU automatically turns print PDFs into web optimized ePapers that Google loves.
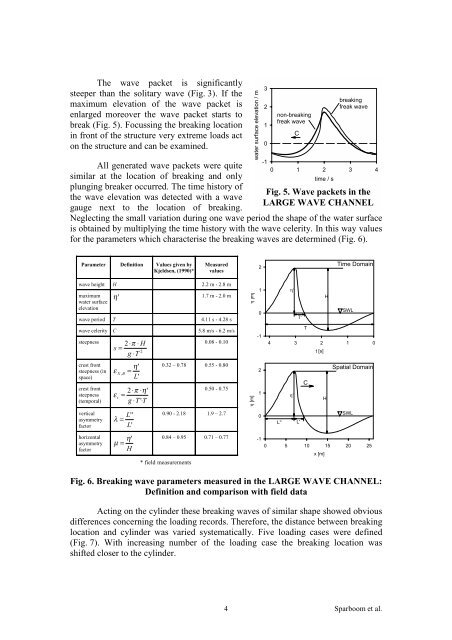
The wave packet is significantly<br />
steeper than <strong>the</strong> solitary wave (Fig. 3). If <strong>the</strong><br />
maximum elevation <strong>of</strong> <strong>the</strong> wave packet is<br />
enlarged moreover <strong>the</strong> wave packet starts to<br />
break (Fig. 5). Focussing <strong>the</strong> breaking location<br />
in front <strong>of</strong> <strong>the</strong> structure very <strong>extreme</strong> loads act<br />
on <strong>the</strong> structure and can be examined.<br />
All generated wave packets were quite<br />
similar at <strong>the</strong> location <strong>of</strong> breaking and only<br />
plunging breaker occurred. The time history <strong>of</strong><br />
<strong>the</strong> wave elevation was detected with a wave<br />
gauge next to <strong>the</strong> location <strong>of</strong> breaking.<br />
Neglecting <strong>the</strong> small variation during one wave period <strong>the</strong> shape <strong>of</strong> <strong>the</strong> water surface<br />
is obtained by multiplying <strong>the</strong> time history with <strong>the</strong> wave celerity. In this way values<br />
<strong>for</strong> <strong>the</strong> parameters which characterise <strong>the</strong> breaking waves are determined (Fig. 6).<br />
Parameter Definition Values given by<br />
Kjeldsen, (1990)*<br />
Measured<br />
values<br />
wave height H 2.2 m - 2.8 m<br />
maximum<br />
water surface<br />
elevation<br />
η'<br />
1.7 m - 2.0 m<br />
wave period T 4.11 s - 4.28 s<br />
wave celerity C 5.8 m/s - 6.2 m/s<br />
steepness<br />
2⋅π<br />
⋅ H<br />
s = 2<br />
g ⋅T<br />
η'<br />
crest front<br />
steepness (in ε X , B =<br />
space) L'<br />
crest front ⋅ ⋅<br />
steepness ε t =<br />
(temporal) g T T<br />
vertical<br />
asymmetry<br />
factor<br />
horizontal<br />
asymmetry<br />
factor<br />
λ =<br />
2 π η'<br />
⋅ '⋅<br />
L''<br />
L'<br />
η'<br />
µ =<br />
H<br />
0.08 - 0.10<br />
0.32 – 0.78 0.55 - 0.80<br />
0.50 - 0.75<br />
0.90 - 2.18 1.9 – 2.7<br />
0.84 – 0.95 0.71 – 0.77<br />
* field measurements<br />
Fig. 6. Breaking wave parameters measured in <strong>the</strong> LARGE WAVE CHANNEL:<br />
Definition and comparison with field data<br />
Acting on <strong>the</strong> cylinder <strong>the</strong>se breaking waves <strong>of</strong> similar shape showed obvious<br />
differences concerning <strong>the</strong> loading records. There<strong>for</strong>e, <strong>the</strong> distance between breaking<br />
location and cylinder was varied systematically. Five loading cases were defined<br />
(Fig. 7). With increasing number <strong>of</strong> <strong>the</strong> loading case <strong>the</strong> breaking location was<br />
shifted closer to <strong>the</strong> cylinder.<br />
4<br />
η [m]<br />
η [m]<br />
water surface elevation / m<br />
2<br />
1<br />
0<br />
-1<br />
2<br />
1<br />
0<br />
3<br />
2<br />
1<br />
0<br />
non-breaking<br />
freak wave<br />
C<br />
breaking<br />
freak wave<br />
-1<br />
0 1 2<br />
time / s<br />
3 4<br />
Fig. 5. Wave packets in <strong>the</strong><br />
LARGE WAVE CHANNEL<br />
4<br />
L''<br />
η'<br />
η'<br />
3<br />
T'<br />
L'<br />
T<br />
C<br />
2<br />
t [s]<br />
x [m]<br />
H<br />
Time Domain<br />
SWL<br />
-1<br />
0 5 10 15 20 25<br />
H<br />
1<br />
Spatial Domain<br />
SWL<br />
0<br />
Sparboom et al.