laboratory “freak wave” generation for the study of extreme ... - FZK
laboratory “freak wave” generation for the study of extreme ... - FZK
laboratory “freak wave” generation for the study of extreme ... - FZK

You also want an ePaper? Increase the reach of your titles
YUMPU automatically turns print PDFs into web optimized ePapers that Google loves.
LABORATORY “FREAK WAVE” GENERATION FOR THE STUDY<br />
OF EXTREME WAVE LOADS ON PILES<br />
Uwe Sparboom 1 , Jan Wienke 2 and Hocine Oumeraci 3<br />
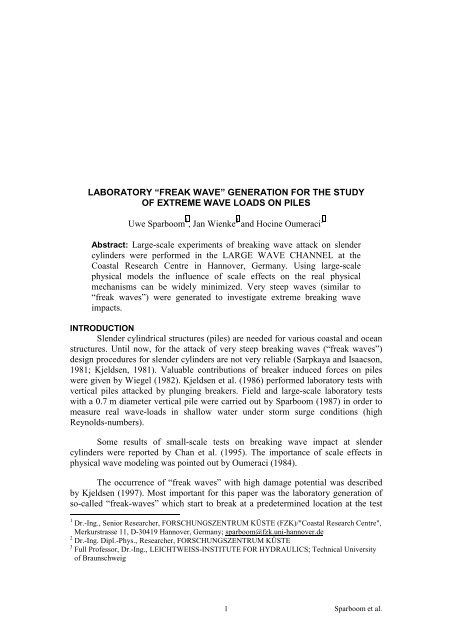
Abstract: Large-scale experiments <strong>of</strong> breaking wave attack on slender<br />
cylinders were per<strong>for</strong>med in <strong>the</strong> LARGE WAVE CHANNEL at <strong>the</strong><br />
Coastal Research Centre in Hannover, Germany. Using large-scale<br />
physical models <strong>the</strong> influence <strong>of</strong> scale effects on <strong>the</strong> real physical<br />
mechanisms can be widely minimized. Very steep waves (similar to<br />
<strong>“freak</strong> waves”) were generated to investigate <strong>extreme</strong> breaking wave<br />
impacts.<br />
INTRODUCTION<br />
Slender cylindrical structures (piles) are needed <strong>for</strong> various coastal and ocean<br />
structures. Until now, <strong>for</strong> <strong>the</strong> attack <strong>of</strong> very steep breaking waves (<strong>“freak</strong> waves”)<br />
design procedures <strong>for</strong> slender cylinders are not very reliable (Sarpkaya and Isaacson,<br />
1981; Kjeldsen, 1981). Valuable contributions <strong>of</strong> breaker induced <strong>for</strong>ces on piles<br />
were given by Wiegel (1982). Kjeldsen et al. (1986) per<strong>for</strong>med <strong>laboratory</strong> tests with<br />
vertical piles attacked by plunging breakers. Field and large-scale <strong>laboratory</strong> tests<br />
with a 0.7 m diameter vertical pile were carried out by Sparboom (1987) in order to<br />
measure real wave-loads in shallow water under storm surge conditions (high<br />
Reynolds-numbers).<br />
Some results <strong>of</strong> small-scale tests on breaking wave impact at slender<br />
cylinders were reported by Chan et al. (1995). The importance <strong>of</strong> scale effects in<br />
physical wave modeling was pointed out by Oumeraci (1984).<br />
The occurrence <strong>of</strong> <strong>“freak</strong> waves” with high damage potential was described<br />
by Kjeldsen (1997). Most important <strong>for</strong> this paper was <strong>the</strong> <strong>laboratory</strong> <strong>generation</strong> <strong>of</strong><br />
so-called <strong>“freak</strong>-waves” which start to break at a predetermined location at <strong>the</strong> test<br />
1<br />
Dr.-Ing., Senior Researcher, FORSCHUNGSZENTRUM KÜSTE (<strong>FZK</strong>)/"Coastal Research Centre",<br />
Merkurstrasse 11, D-30419 Hannover, Germany; sparboom@fzk.uni-hannover.de<br />
2<br />
Dr.-Ing. Dipl.-Phys., Researcher, FORSCHUNGSZENTRUM KÜSTE<br />
3<br />
Full Pr<strong>of</strong>essor, Dr.-Ing., LEICHTWEISS-INSTITUTE FOR HYDRAULICS; Technical University<br />
<strong>of</strong> Braunschweig<br />
1<br />
Sparboom et al.
cylinder in <strong>the</strong> wave flume (Clauss and Bergmann, 1986; Clauss and Kühnlein,<br />
1997).<br />
Concerning <strong>extreme</strong> wave loadings <strong>of</strong> a structure or <strong>of</strong> a structural component<br />
it is <strong>of</strong> particular interest to analyse single wave effects in a wave flume. Single wave<br />
tests have <strong>the</strong> advantage that very high sampling rates <strong>for</strong> <strong>the</strong> data acquisition can be<br />
used. In <strong>the</strong> present <strong>study</strong>, pressure impact time histories were resolved in <strong>the</strong> range<br />
<strong>of</strong> milliseconds and below. Local loads or pressures were determined exactly and<br />
total <strong>for</strong>ces as well as wave kinematics were measured simultaneously (Wienke et<br />
al., 2000).<br />
TEST SET-UP<br />
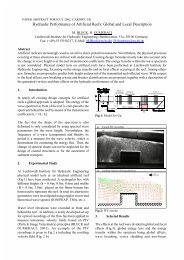
The experiments were carried out in <strong>the</strong> LARGE WAVE CHANNEL <strong>of</strong> <strong>the</strong><br />
Forschungszentrum Küste (Coastal Research Centre) in Hannover, Germany. This<br />
channel has an effective length <strong>of</strong> 309 m, a width <strong>of</strong> 5 m and a depth <strong>of</strong> 7 m. For <strong>the</strong><br />
tests, <strong>the</strong> still water level was around 4 m (Fig. 1).<br />
5 m<br />
PLAN VIEW<br />
7 m<br />
converging<br />
wave packet<br />
CROSS SECTION<br />
wave paddle<br />
C C 2 m<br />
C<br />
SWL<br />
4 m<br />
LARGE WAVE CHANNEL<br />
111 m<br />
vertical and inclined<br />
test cylinder<br />
wave packet<br />
next to point <strong>of</strong><br />
concentration<br />
Fig. 1. Test set-up in <strong>the</strong> LARGE WAVE CHANNEL<br />
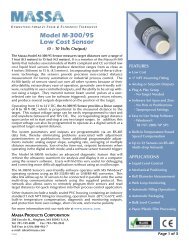
A steel cylinder with a diameter <strong>of</strong> 0.7 m was installed on <strong>the</strong> horizontal<br />
channel bottom in a distance <strong>of</strong> 111 m from <strong>the</strong> wave paddle. The top <strong>of</strong> <strong>the</strong> test<br />
cylinder was fixed at a traverse structure at <strong>the</strong> top edge <strong>of</strong> <strong>the</strong> channel. At <strong>the</strong><br />
bearings strain gauges were installed to measure <strong>the</strong> total <strong>for</strong>ce as <strong>the</strong> sum <strong>of</strong> <strong>the</strong><br />
<strong>for</strong>ces at both bearings. Fur<strong>the</strong>rmore, 55 pressure transducers were installed in <strong>the</strong><br />
cylinder. Some were installed in <strong>the</strong> front line and some o<strong>the</strong>rs around <strong>the</strong><br />
circumference <strong>of</strong> <strong>the</strong> cylinder (Fig. 2).<br />
2<br />
309 m<br />
0.7 m<br />
1 wave packet / test<br />
diverging<br />
wave packet<br />
slope 1:6<br />
(not true to scale)<br />
Sparboom et al.
pressure<br />
transducers<br />
(front line)<br />
strain gauge<br />
dynamometer<br />
Fig. 2. Test cylinder with installed measuring instruments<br />
WAVE GENERATION AND WAVE LOAD CLASSIFICATION<br />
There are two different opportunities<br />
<strong>for</strong> <strong>the</strong> <strong>generation</strong> <strong>of</strong> single waves in <strong>the</strong><br />
LARGE WAVE CHANNEL. On <strong>the</strong> one hand<br />
solitary waves can be generated by <strong>the</strong> pistontype<br />
wave maker. Using a typical still water<br />
level <strong>of</strong> 4.75 m <strong>the</strong> maximum elevation <strong>of</strong> a<br />
solitary wave is around 0.8 m (Fig. 3). On <strong>the</strong><br />
o<strong>the</strong>r hand wave packets can be simulated.<br />
Focussing <strong>the</strong> point <strong>of</strong> concentration <strong>of</strong> a wave<br />
packet at <strong>the</strong> structure <strong>the</strong> elevation <strong>of</strong> <strong>the</strong><br />
water surface corresponds to a single wave. In<br />
this way maximum wave elevations <strong>of</strong> about<br />
2 m above SWL can be generated at <strong>the</strong><br />
structure (Fig. 4).<br />
(0/7)<br />
η max<br />
SWL<br />
C<br />
+7.0 m<br />
α = -45° α = -25° α = 0° α = 24.5° α = 45°<br />
L = 9.670 m<br />
+0.0 m<br />
wave gauges<br />
(309/7)<br />
z (y/z)<br />
(309/4)<br />
(0/0)<br />
y<br />
(309/0)<br />
L = 7.670 m<br />
(0/7)<br />
D = 0.7m<br />
Fig. 4. Gaussian wave packet in <strong>the</strong> LARGE WAVE CHANNEL<br />
3<br />
L = 7.295 m<br />
water surface elevation / m<br />
2<br />
1<br />
0<br />
(309/7)<br />
(111/5,5)<br />
(309/4)<br />
(0/0) (309/0)<br />
L = 7.670 m<br />
pressure transducers<br />
(circle)<br />
freak<br />
wave<br />
C<br />
L = 9.670 m<br />
strain gauge<br />
dynamometer<br />
pressure transducers<br />
(half-circle)<br />
solitary<br />
wave<br />
-1<br />
0 2 4 6 8<br />
time / s<br />
Fig. 3. Single waves in <strong>the</strong><br />
LARGE WAVE CHANNEL<br />
(0/7)<br />
(0/4)<br />
(0/0) (309/0)<br />
t = t1 t = t1 + 14 s t = t1 + 36 s<br />
(309/7)<br />
Sparboom et al.
The wave packet is significantly<br />
steeper than <strong>the</strong> solitary wave (Fig. 3). If <strong>the</strong><br />
maximum elevation <strong>of</strong> <strong>the</strong> wave packet is<br />
enlarged moreover <strong>the</strong> wave packet starts to<br />
break (Fig. 5). Focussing <strong>the</strong> breaking location<br />
in front <strong>of</strong> <strong>the</strong> structure very <strong>extreme</strong> loads act<br />
on <strong>the</strong> structure and can be examined.<br />
All generated wave packets were quite<br />
similar at <strong>the</strong> location <strong>of</strong> breaking and only<br />
plunging breaker occurred. The time history <strong>of</strong><br />
<strong>the</strong> wave elevation was detected with a wave<br />
gauge next to <strong>the</strong> location <strong>of</strong> breaking.<br />
Neglecting <strong>the</strong> small variation during one wave period <strong>the</strong> shape <strong>of</strong> <strong>the</strong> water surface<br />
is obtained by multiplying <strong>the</strong> time history with <strong>the</strong> wave celerity. In this way values<br />
<strong>for</strong> <strong>the</strong> parameters which characterise <strong>the</strong> breaking waves are determined (Fig. 6).<br />
Parameter Definition Values given by<br />
Kjeldsen, (1990)*<br />
Measured<br />
values<br />
wave height H 2.2 m - 2.8 m<br />
maximum<br />
water surface<br />
elevation<br />
η'<br />
1.7 m - 2.0 m<br />
wave period T 4.11 s - 4.28 s<br />
wave celerity C 5.8 m/s - 6.2 m/s<br />
steepness<br />
2⋅π<br />
⋅ H<br />
s = 2<br />
g ⋅T<br />
η'<br />
crest front<br />
steepness (in ε X , B =<br />
space) L'<br />
crest front ⋅ ⋅<br />
steepness ε t =<br />
(temporal) g T T<br />
vertical<br />
asymmetry<br />
factor<br />
horizontal<br />
asymmetry<br />
factor<br />
λ =<br />
2 π η'<br />
⋅ '⋅<br />
L''<br />
L'<br />
η'<br />
µ =<br />
H<br />
0.08 - 0.10<br />
0.32 – 0.78 0.55 - 0.80<br />
0.50 - 0.75<br />
0.90 - 2.18 1.9 – 2.7<br />
0.84 – 0.95 0.71 – 0.77<br />
* field measurements<br />
Fig. 6. Breaking wave parameters measured in <strong>the</strong> LARGE WAVE CHANNEL:<br />
Definition and comparison with field data<br />
Acting on <strong>the</strong> cylinder <strong>the</strong>se breaking waves <strong>of</strong> similar shape showed obvious<br />
differences concerning <strong>the</strong> loading records. There<strong>for</strong>e, <strong>the</strong> distance between breaking<br />
location and cylinder was varied systematically. Five loading cases were defined<br />
(Fig. 7). With increasing number <strong>of</strong> <strong>the</strong> loading case <strong>the</strong> breaking location was<br />
shifted closer to <strong>the</strong> cylinder.<br />
4<br />
η [m]<br />
η [m]<br />
water surface elevation / m<br />
2<br />
1<br />
0<br />
-1<br />
2<br />
1<br />
0<br />
3<br />
2<br />
1<br />
0<br />
non-breaking<br />
freak wave<br />
C<br />
breaking<br />
freak wave<br />
-1<br />
0 1 2<br />
time / s<br />
3 4<br />
Fig. 5. Wave packets in <strong>the</strong><br />
LARGE WAVE CHANNEL<br />
4<br />
L''<br />
η'<br />
η'<br />
3<br />
T'<br />
L'<br />
T<br />
C<br />
2<br />
t [s]<br />
x [m]<br />
H<br />
Time Domain<br />
SWL<br />
-1<br />
0 5 10 15 20 25<br />
H<br />
1<br />
Spatial Domain<br />
SWL<br />
0<br />
Sparboom et al.
1<br />
2<br />
3<br />
4<br />
5<br />
• wave breaking far in front <strong>of</strong><br />
<strong>the</strong> cylinder<br />
• overcurling breaker tongue<br />
hits cylinder below wave<br />
crest level<br />
• broken wave<br />
• wave breaking in front <strong>of</strong> <strong>the</strong><br />
cylinder<br />
• breaker tongue hits cylinder<br />
just below wave crest level<br />
• splash going up and down<br />
• breaking wave<br />
• wave breaking immediately<br />
in front <strong>of</strong> <strong>the</strong> cylinder<br />
• breaker tongue hits cylinder<br />
at wave crest level<br />
• radial splash<br />
• breaking wave<br />
• wave breaking at <strong>the</strong> cylinder<br />
• damped impact due to<br />
cylinder wave run up<br />
• splash going up<br />
• partial breaking wave<br />
• no wave breaking in front <strong>of</strong><br />
<strong>the</strong> cylinder<br />
• quasi-static <strong>for</strong>ce<br />
Fig. 7. Classification <strong>of</strong> different loading cases<br />
5<br />
SWL<br />
SWL<br />
SWL<br />
SWL<br />
SWL<br />
Sparboom et al.
Waves <strong>of</strong> loading case 1 break far in front <strong>of</strong> <strong>the</strong> cylinder and <strong>the</strong> breaker<br />
tongue hits <strong>the</strong> cylinder in an angle <strong>of</strong> around 45° related to <strong>the</strong> horizontal plane.<br />
Loading case 2 means that <strong>the</strong> waves break evidently in front <strong>of</strong> <strong>the</strong> cylinder and <strong>the</strong><br />
hitting breaker tongue is inclined regarding <strong>the</strong> horizontal plane by an angle <strong>of</strong><br />
around 25°. Waves <strong>of</strong> loading case 3 break immediately in front <strong>of</strong> <strong>the</strong> cylinder and<br />
<strong>the</strong> breaker tongue is still moving along <strong>the</strong> horizontal plane when <strong>the</strong> cylinder is<br />
attacked. Loading case 4 describes waves breaking at <strong>the</strong> cylinder. Waves <strong>of</strong> loading<br />
case 5 do not break in front <strong>of</strong> <strong>the</strong> cylinder but at <strong>the</strong> rear. This definition <strong>of</strong> <strong>the</strong> five<br />
loading cases is applied <strong>for</strong> each <strong>of</strong> <strong>the</strong> five investigated yaw angles (Fig.8).<br />
-45°<br />
inclination against<br />
wave direction<br />
-25°<br />
inclination against<br />
wave direction<br />
0°<br />
vertical cylinder<br />
Fig. 8. Loading case 3 <strong>for</strong> <strong>the</strong> different investigated yaw angles<br />
IMPACT LOADING<br />
The total <strong>for</strong>ce acting on <strong>the</strong> cylinder has been determined by adding <strong>the</strong><br />
loads measured at <strong>the</strong> two bearings at <strong>the</strong> top and at <strong>the</strong> bottom. The maximum <strong>for</strong>ce<br />
caused by a typical solitary wave is below 1 kN. Attacked by a wave packet <strong>the</strong> total<br />
<strong>for</strong>ce acting on <strong>the</strong> cylinder is around 7 kN. Since <strong>the</strong> wave packet is steeper than <strong>the</strong><br />
solitary wave <strong>the</strong> increase <strong>of</strong> <strong>for</strong>ce takes place faster. Very much larger values <strong>of</strong> <strong>the</strong><br />
total <strong>for</strong>ce are measured <strong>for</strong> wave packets breaking in front <strong>of</strong> <strong>the</strong> cylinder (Fig. 9).<br />
Fig. 9. Measured <strong>for</strong>ces acting on <strong>the</strong> cylinder <strong>for</strong> different wave attack<br />
6<br />
+24.5°<br />
inclination towards<br />
wave direction<br />
SWL SWL SWL SWL SWL<br />
total <strong>for</strong>ce / kN<br />
8<br />
6<br />
4<br />
2<br />
0<br />
-2<br />
solitary wave<br />
attack<br />
freak wave<br />
attack<br />
-4<br />
0 2 4<br />
time / s<br />
6 8<br />
total <strong>for</strong>ce / kN<br />
50<br />
40<br />
30<br />
20<br />
10<br />
0<br />
non-breaking<br />
freak wave<br />
attack<br />
breaking<br />
freak wave<br />
attack<br />
-10<br />
0 1 2<br />
time / s<br />
3 4<br />
+45°<br />
inclination towards<br />
wave direction<br />
Sparboom et al.
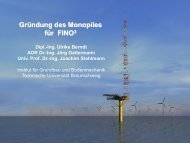
The large <strong>for</strong>ces due to breaking waves are restricted to a small extension at<br />
<strong>the</strong> cylinder and <strong>the</strong>se <strong>for</strong>ces act only during an <strong>extreme</strong>ly short time. There<strong>for</strong>e this<br />
<strong>for</strong>ce due to breaking waves is called slamming <strong>for</strong>ce. It can be detected by pressure<br />
measurement at <strong>the</strong> cylinder. Comparing <strong>the</strong> pressure time history with <strong>the</strong> time<br />
history <strong>of</strong> <strong>the</strong> water surface elevation <strong>the</strong> different values <strong>of</strong> <strong>the</strong> wave period and <strong>the</strong><br />
slamming duration are illustrated (Fig. 10). The small extension <strong>of</strong> <strong>the</strong> slamming<br />
<strong>for</strong>ce is confirmed by <strong>the</strong> pressure distribution along <strong>the</strong> height <strong>of</strong> <strong>the</strong> cylinder.<br />
Pressure [kPa]<br />
Height [m]<br />
Time [s]<br />
0 1 2 3<br />
7<br />
6<br />
5<br />
4<br />
3<br />
2<br />
1<br />
0<br />
1500<br />
1000<br />
500<br />
C<br />
Water level<br />
elevation<br />
Channel bottom<br />
0<br />
0 1 2 3<br />
Time [s]<br />
Velocity [m/s]<br />
0 2 4 6<br />
Fig. 10. Measured slamming pressures<br />
The total <strong>for</strong>ce measured at <strong>the</strong> bearings <strong>of</strong> <strong>the</strong> test cylinder was separated<br />
into a quasistatic part varying in time with <strong>the</strong> water surface elevation and a dynamic<br />
part due to <strong>the</strong> slamming <strong>for</strong>ce. The experimentally obtained values <strong>for</strong> <strong>the</strong> dynamic<br />
<strong>for</strong>ce are plotted in Fig. 11. For each angle <strong>of</strong> inclination <strong>the</strong> mean, <strong>the</strong> maximum<br />
7<br />
Maximum<br />
horizontal<br />
velocity<br />
Pressure [kPa]<br />
0 400 800 1200 1600<br />
SWL SWL SWL<br />
Maximum<br />
pressure<br />
impact<br />
Enlarged<br />
time<br />
resolution<br />
1.0495 1.0500 1.0505 1.0510<br />
Time [s]<br />
7<br />
6<br />
5<br />
4<br />
3<br />
2<br />
1<br />
0<br />
Height [m]<br />
1500<br />
1000<br />
500<br />
0<br />
Pressure [kPa]<br />
Sparboom et al.
and <strong>the</strong> minimum values are plotted. The highest maximum value <strong>of</strong> <strong>the</strong> dynamic<br />
<strong>for</strong>ce is obtained <strong>for</strong> <strong>the</strong> yaw angle <strong>of</strong> -25° (inclination against wave direction).<br />
F 1 [kN]<br />
80<br />
60<br />
40<br />
20<br />
0<br />
max<br />
mean<br />
min<br />
evaluated with<br />
geometric relations<br />
-45.0 -25.0 0.0 24.5 45.0 α [°]<br />
F<br />
F 1<br />
t<br />
Fig. 11. Dynamic <strong>for</strong>ce versus yaw angle<br />
The dynamic <strong>for</strong>ce is related to an area <strong>of</strong> impact at <strong>the</strong> cylinder. It is<br />
assumed, that <strong>the</strong> slamming <strong>for</strong>ce is only acting in this area and that <strong>the</strong> <strong>for</strong>ce is equal<br />
at <strong>the</strong> different levels <strong>of</strong> <strong>the</strong> area <strong>of</strong> impact. In this way a height <strong>of</strong> <strong>the</strong> impact area at<br />
<strong>the</strong> cylinder can be deduced. Dividing this length by <strong>the</strong> maximum elevation <strong>of</strong> <strong>the</strong><br />
breaking wave, <strong>the</strong> curling factor λ is obtained. In Fig. 12 this curling factor is<br />
plotted, namely <strong>the</strong> mean, <strong>the</strong> maximum and <strong>the</strong> minimum values <strong>for</strong> each angle <strong>of</strong><br />
inclination are shown. For <strong>the</strong> vertical cylinder a maximum value <strong>of</strong> 0.5 is obtained.<br />
This is in agreement to values given in literature (e.g. Wiegel, 1982). If <strong>the</strong> cylinder<br />
is inclined against wave direction, <strong>the</strong> height <strong>of</strong> <strong>the</strong> impact area increases. However,<br />
<strong>the</strong> height <strong>of</strong> <strong>the</strong> area <strong>of</strong> impact decreases, if <strong>the</strong> cylinder is inclined towards <strong>the</strong><br />
wave direction (Wienke et al., 2001).<br />
CONCLUDING REMARKS<br />
It is shown that wave packets are a suitable tool <strong>for</strong> <strong>the</strong> simulation <strong>of</strong> steep<br />
breaking waves in a wave flume. The location <strong>of</strong> wave breaking can accurately be<br />
varied by <strong>the</strong> predetermination <strong>of</strong> <strong>the</strong> concentration point <strong>of</strong> <strong>the</strong> wave packet. So<br />
waves breaking in front <strong>of</strong> a test structure can be generated. The shift <strong>of</strong> <strong>the</strong> test<br />
structure can be equalized by <strong>the</strong> variation <strong>of</strong> <strong>the</strong> point <strong>of</strong> concentration <strong>of</strong> <strong>the</strong> wave<br />
packet. In this way slamming <strong>for</strong>ces on a test cylinder with different yaw angles were<br />
investigated. For each yaw angle maximum values <strong>of</strong> <strong>the</strong> slamming <strong>for</strong>ce were<br />
obtained by varying <strong>the</strong> point <strong>of</strong> concentration over a range <strong>of</strong> nearly 10 m. The<br />
results show that <strong>the</strong> maximum <strong>for</strong>ce is acting on a cylinder which is slightly inclined<br />
against wave direction.<br />
8<br />
C<br />
α−β<br />
breaking wave<br />
area <strong>of</strong> impact<br />
β<br />
( α − β ) cosα<br />
F<br />
~ cos ⋅<br />
α<br />
Sparboom et al.
λ<br />
1.0 max<br />
0.8<br />
0.6<br />
0.4<br />
0.2<br />
0.0<br />
mean<br />
min<br />
evaluated with<br />
geometric relations<br />
-45.0 -25.0 0.0 24.5 45.0 α [°]<br />
C<br />
SWL<br />
η b<br />
R<br />
λ . η b<br />
Fig. 12. Curling factor versus yaw angle<br />
ACKNOWLEDGEMENTS<br />
The DEUTSCHE FORSCHUNGSGEMEINSCHAFT (DFG) is gratefully<br />
acknowledged supporting <strong>the</strong> research project on breaking wave impact <strong>of</strong> slender<br />
cylinders (Contract-No. Ou1/4-1).<br />
The authors thank <strong>the</strong> research team at <strong>the</strong> LARGE WAVE CHANNEL <strong>of</strong><br />
<strong>the</strong> FORSCHUNGSZENTRUM KÜSTE (<strong>FZK</strong>) <strong>for</strong> valuable help during <strong>the</strong> research<br />
program (Dipl.-Ing. Grüne, Dipl.-Ing Schmidt-Koppenhagen, Dipl.-Ing. Irschik,<br />
Dipl.-Ing. Bergmann, Mr. Junge and Mr. Malewski).<br />
REFERENCES<br />
Chan, E.-S.; Cheong, H.-F. and Tan, B.-C. (1995). “Laboratory <strong>study</strong> <strong>of</strong> plunging<br />
wave impacts on vertical cylinders.” Coastal Engineering, 25, 87-107.<br />
Clauss, G.F. and Bergmann, J. (1986). “Gaussian wave packet – A new approach to<br />
seakeeping tests <strong>of</strong> ocean structures.” Applied Ocean Research, 8, No. 4.<br />
Clauss, G.F. and Kühnlein, W.L. (1997). “Simulation <strong>of</strong> design storm wave<br />
conditions with tailored wave groups.” Proceedings <strong>of</strong> <strong>the</strong> Seventh International<br />
Offshore and Polar Engineering Conference, Honolulu, 3, 228-237.<br />
Kjeldsen, S.P. (1981). “Shock pressures from deep water breaking waves.”<br />
Proceedings <strong>of</strong> <strong>the</strong> International Symposium on Hydrodynamics, Trondheim,<br />
567-584.<br />
Kjeldsen, S.P.; Tørum, A. and Dean, R.G. (1986). “Wave <strong>for</strong>ces on vertical piles<br />
caused by 2- and 3-dimensional breaking waves.” Proceedings <strong>of</strong> <strong>the</strong> 20th<br />
International Conference on Coastal Engineering, Taipei, 1929-1943.<br />
9<br />
1<br />
λ ~<br />
cosα<br />
C<br />
breaking wave<br />
( α β )<br />
λ ~ cos −<br />
( α −<br />
β )<br />
cos<br />
λ ~<br />
cosα<br />
C<br />
λ . η b<br />
area <strong>of</strong> impact<br />
breaking wave<br />
area <strong>of</strong> impact<br />
λ . η b<br />
α α<br />
β<br />
λ . η b<br />
α<br />
Sparboom et al.
Kjeldsen, S.P. (1997). “Examples <strong>of</strong> heavy wea<strong>the</strong>r damages caused by giant<br />
waves.” Techno Marine, Bulletin <strong>of</strong> <strong>the</strong> Society <strong>of</strong> Naval Architects <strong>of</strong> Japan, 820,<br />
No. 10.<br />
Oumeraci, H. (1984). “Scale effects in coastal hydraulic models.” Kobus (ed.),<br />
Symposium on Scale Effects in Modelling Hydraulic Structures, Technische<br />
Akademie Eßlingen.<br />
Sarpkaya, T.and Isaacson, M. (1981). “Mechanics <strong>of</strong> wave <strong>for</strong>ces on <strong>of</strong>fshore<br />
structures.” Van Nostrand Reinhold, New York.<br />
Sparboom, U. (1987). “Real wave-loads on small cylindrical bodies.” Proceedings <strong>of</strong><br />
<strong>the</strong> 2nd International Conference on Coastal and Port Engineering in Developing<br />
Countries, Beijing.<br />
Wiegel, R.L. (1982). “Forces induced by breakers on piles.” Proceedings <strong>of</strong> <strong>the</strong> 18th<br />
International Conference on Coastal Engineering, Cape Town, 1699-1715.<br />
Wienke, J., Sparboom, U. and Oumeraci, H. (2000). “Breaking wave impact on a<br />
slender cylinder.” Proceedings <strong>of</strong> <strong>the</strong> 27th International Conference on Coastal<br />
Engineering, Sydney, 2, 1787-1798.<br />
Wienke, J., Sparboom, U. and Oumeraci, H. (2001). “Large-scale experiments with<br />
slender cylinders in breaking waves.” Proceedings <strong>of</strong> <strong>the</strong> 11th International<br />
Offshore and Polar Engineering Conference, Stavanger, 4, 358-362.<br />
10<br />
Sparboom et al.