An assessment of local fisheries in Diego-Suarez Bay, Madagascar
An assessment of local fisheries in Diego-Suarez Bay, Madagascar
An assessment of local fisheries in Diego-Suarez Bay, Madagascar

Create successful ePaper yourself
Turn your PDF publications into a flip-book with our unique Google optimized e-Paper software.
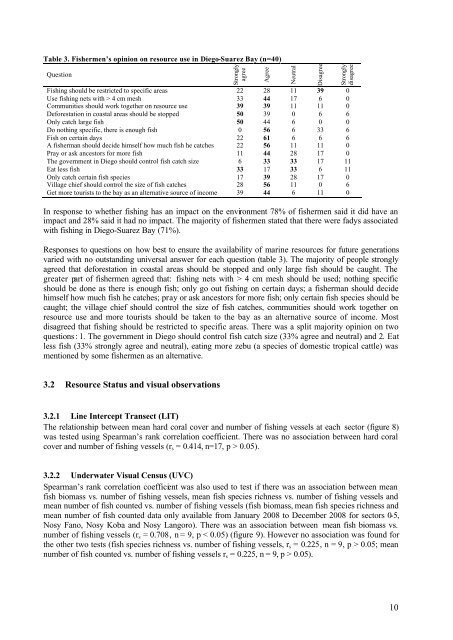
Table 3. Fishermen’s op<strong>in</strong>ion on resource use <strong>in</strong> <strong>Diego</strong>-<strong>Suarez</strong> <strong>Bay</strong> (n=40)<br />
Question<br />
Fish<strong>in</strong>g should be restricted to specific areas 22 28 11 39 0<br />
Use fish<strong>in</strong>g nets with > 4 cm mesh 33 44 17 6 0<br />
Communities should work together on resource use 39 39 11 11 0<br />
Deforestation <strong>in</strong> coastal areas should be stopped 50 39 0 6 6<br />
Only catch large fish 50 44 6 0 0<br />
Do noth<strong>in</strong>g specific, there is enough fish 0 56 6 33 6<br />
Fish on certa<strong>in</strong> days 22 61 6 6 6<br />
A fisherman should decide himself how much fish he catches 22 56 11 11 0<br />
Pray or ask ancestors for more fish 11 44 28 17 0<br />
The government <strong>in</strong> <strong>Diego</strong> should control fish catch size 6 33 33 17 11<br />
Eat less fish 33 17 33 6 11<br />
Only catch certa<strong>in</strong> fish species 17 39 28 17 0<br />
Village chief should control the size <strong>of</strong> fish catches 28 56 11 0 6<br />
Get more tourists to the bay as an alternative source <strong>of</strong> <strong>in</strong>come 39 44 6 11 0<br />
In response to whether fish<strong>in</strong>g has an impact on the environment 78% <strong>of</strong> fishermen said it did have an<br />
impact and 28% said it had no impact. The majority <strong>of</strong> fishermen stated that there were fadys associated<br />
with fish<strong>in</strong>g <strong>in</strong> <strong>Diego</strong>-<strong>Suarez</strong> <strong>Bay</strong> (71%).<br />
Responses to questions on how best to ensure the availability <strong>of</strong> mar<strong>in</strong>e resources for future generations<br />
varied with no outstand<strong>in</strong>g universal answer for each question (table 3). The majority <strong>of</strong> people strongly<br />
agreed that deforestation <strong>in</strong> coastal areas should be stopped and only large fish should be caught. The<br />
greater part <strong>of</strong> fishermen agreed that: fish<strong>in</strong>g nets with > 4 cm mesh should be used; noth<strong>in</strong>g specific<br />
should be done as there is enough fish; only go out fish<strong>in</strong>g on certa<strong>in</strong> days; a fisherman should decide<br />
himself how much fish he catches; pray or ask ancestors for more fish; only certa<strong>in</strong> fish species should be<br />
caught; the village chief should control the size <strong>of</strong> fish catches, communities should work together on<br />
resource use and more tourists should be taken to the bay as an alternative source <strong>of</strong> <strong>in</strong>come. Most<br />
disagreed that fish<strong>in</strong>g should be restricted to specific areas. There was a split majority op<strong>in</strong>ion on two<br />
questions: 1. The government <strong>in</strong> <strong>Diego</strong> should control fish catch size (33% agree and neutral) and 2. Eat<br />
less fish (33% strongly agree and neutral), eat<strong>in</strong>g more zebu (a species <strong>of</strong> domestic tropical cattle) was<br />
mentioned by some fishermen as an alternative.<br />
3.2 Resource Status and visual observations<br />
3.2.1 L<strong>in</strong>e Intercept Transect (LIT)<br />
The relationship between mean hard coral cover and number <strong>of</strong> fish<strong>in</strong>g vessels at each sector (figure 8)<br />
was tested us<strong>in</strong>g Spearman’s rank correlation coefficient. There was no association between hard coral<br />
cover and number <strong>of</strong> fish<strong>in</strong>g vessels (rs = 0.414, n=17, p > 0.05).<br />
3.2.2 Underwater Visual Census (UVC)<br />
Spearman’s rank correlation coefficient was also used to test if there was an association between mean<br />
fish biomass vs. number <strong>of</strong> fish<strong>in</strong>g vessels, mean fish species richness vs. number <strong>of</strong> fish<strong>in</strong>g vessels and<br />
mean number <strong>of</strong> fish counted vs. number <strong>of</strong> fish<strong>in</strong>g vessels (fish biomass, mean fish species richness and<br />
mean number <strong>of</strong> fish counted data only available from January 2008 to December 2008 for sectors 0-5,<br />
Nosy Fano, Nosy Koba and Nosy Langoro). There was an association between mean fish biomass vs.<br />
number <strong>of</strong> fish<strong>in</strong>g vessels (rs = 0.708, n = 9, p < 0.05) (figure 9). However no association was found for<br />
the other two tests (fish species richness vs. number <strong>of</strong> fish<strong>in</strong>g vessels, rs = 0.225, n = 9, p > 0.05; mean<br />
number <strong>of</strong> fish counted vs. number <strong>of</strong> fish<strong>in</strong>g vessels rs = 0.225, n = 9, p > 0.05).<br />
Strongly<br />
agree<br />
Agree<br />
Neutral<br />
Disagree<br />
Strongly<br />
disagree<br />
10