TURBISCAN - Formulaction
TURBISCAN - Formulaction
TURBISCAN - Formulaction

Create successful ePaper yourself
Turn your PDF publications into a flip-book with our unique Google optimized e-Paper software.
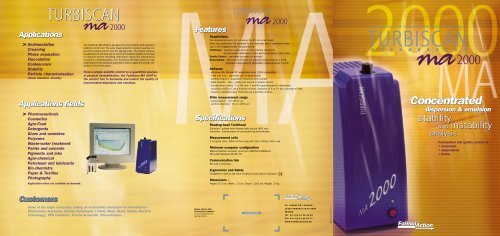
Applications<br />
><br />
<strong>TURBISCAN</strong><br />
Applications fields<br />
><br />
Sedimentation<br />
Creaming<br />
Phase separation<br />
Flocculation<br />
Coalescence<br />
Stability<br />
Particle characterisation<br />
(mean diameter, density)<br />
Pharmaceuticals<br />
Cosmetics<br />
Agro-Food<br />
Detergents<br />
Glues and varnishes<br />
Polymers<br />
Waste-water treatment<br />
Paints and cements<br />
Pigments and inks<br />
Agro-chemical<br />
Petroleum and lubricants<br />
Bio-chemistry<br />
Paper & Textiles<br />
Photography<br />
Application notes are available on demand.<br />
Customers<br />
ma 2000<br />
The TurbiScan MA 2000 is designed as a formulation and a product<br />
stability control tool. The early stage detection allows to quickly correct<br />
formulations and to shorten ageing tests. The kinetic analysis<br />
visualisation is the only way to document stability studies in an easy<br />
to interpret format. Providing information about the mechanisms<br />
involved in a destabilisation, the TurbiScan MA 2000 allows to fully<br />
understand these physical processes and to apply the proper correction<br />
to the formulation.<br />
From a simple stability control to a quantified analysis<br />
of physical destabilisation, the TurbiScan MA 2000 is<br />
the perfect tool to formulate and control the quality of<br />
concentrated dispersion and emulsion.<br />
Some of the major companies relying on instruments developed by FormulAction :<br />
Elf-Atochem, Fuji-Xerox, Henkel, Hutchinson, L’Oréal, Merk, Mobil, Nestle, Novartis<br />
(Ciba-Geigy), PPG Industries, Procter & Gamble, Rhône-Poulenc ...<br />
Features<br />
Please ask for other<br />
<strong>Formulaction</strong> products :<br />
On Line measurement,<br />
ageing station...<br />
ma 2000<br />
Acquisitions<br />
One acquisition every 40 µm along the 80 mm scan height<br />
From one scan every 20 seconds to one scan per day in automatic mode<br />
Up to 400 programmable measurements<br />
Calibration : physical measurement with external standards,<br />
an automatic calibration is then performed before each scan.<br />
Quality Control : standards provided on demand<br />
Repeatability : absolute incertitude for manual measurements ≤ 0.5%<br />
absolute incertitude for automatic measurements ≤ 0.1%<br />
Software<br />
- Windows 95, 98 and NT compatible (year 2000 compatible)<br />
- Date and time : automatic and programmable<br />
- Setting program : acquisition frequency and number<br />
- Data transfer : copy / paste raw curves or kinetic curves<br />
- Visualisation modes : T or BS only, T and BS superimposed or separated,<br />
evolution of BS or T as a function of time, evolution of λ or λ* as a function of time,<br />
cream or sediment layer thickness as a function of time...<br />
Wide measurement range<br />
- concentration : 0 to 60 % v/v<br />
- particle diameter : 0,1 to 1000 µm<br />
Specifications<br />
Reading head TurbiHead<br />
Emission : pulsed near infrared light source (850 nm)<br />
Detection : transmission & backscattering photodiodes<br />
Measurement cells<br />
5 ml glass cells, Teflon bottom plug with Viton O-Ring, Teflon cap<br />
Minimum computer configuration<br />
IBM-compatible computer (minimum 486DX33 8MbRam)<br />
Microsoft Windows 95,98, NT<br />
Communication link<br />
RS 232 C interface<br />
Ergonomics and Safety<br />
Designed to work in lab work conditions and easy to maintain.<br />
Dimensions :<br />
Height 27.5 cm, Width : 13 cm, Depth : 23.5 cm, Weight : 5 kg<br />
DISTRIBUTOR<br />
10, AVENUE DE L’EUROPE<br />
31520 RAMONVILLE-ST-AGNE<br />
FRANCE<br />
TEL 33 (0)5 61 28 56 52<br />
FAX 33 (0)5 61 28 56 77<br />
WWW.FORMULACTION.FR<br />
(Bien vu!) Mars 99 - 05 61 00 91 55<br />
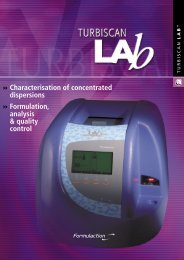
A NEW CONCEPT OF ABSOLUTE PHYSICAL MEASUREMENT<br />
ma 2000<br />
Concentrated<br />
dispersion dispersion & emulsion emulsion<br />
stability<br />
and instability<br />
analysis<br />
Formulation and quality control of<br />
• emulsions<br />
• suspensions<br />
• foams
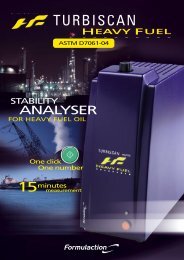
<strong>TURBISCAN</strong> ma 2000<br />
Detects concentrated dispersion<br />
nascent destabilisation’s phenomena<br />
and unravels their mechanisms<br />
to improve formulations, shorten<br />
and document ageing tests.<br />
Without dilution, it operates on emulsions, suspensions and foams:<br />
Up to 60% v/v concentrated<br />
From 0.1 µm to 1 mm particle size<br />
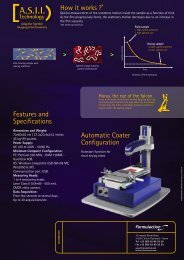
OW IT WORKS ?<br />
Multiple light scattering<br />
measurement for<br />
concentrated dispersion<br />
analysis<br />
This vertical scan macroscopic<br />
analyser consists of a reading<br />
head moving along a flat-bottomed<br />
cylindrical cell, while scanning the<br />
entire sample height. The reading<br />
head itself consists of a pulsed<br />
near infrared light source and two<br />
synchronous detectors:<br />
-The transmission detector picks<br />
up the light transmitted through<br />
the product,<br />
-The backscattering detector<br />
receives the light backscattered<br />
by the product (135°).<br />
The reading head acquires transmission<br />
and backscattering data<br />
every 40 µm on a maximum height<br />
of 80 mm. The profile obtained<br />
characterise the product homogeneity,<br />
particles concentration and<br />
mean diameter. It is represented<br />
on the software screen by a curve<br />
showing the percentage of backscattered<br />
or transmitted light as a<br />
function of the sample height (in<br />
mm).<br />
The acquisition along the product<br />
is then repeated with a programmable<br />
frequency to obtain a superimposition<br />
of product fingerprints<br />
characterising the stability or<br />
instability of the product, whether<br />
they are identical or not.<br />
Result of<br />
one scan<br />
of the<br />
sample<br />
Measurement<br />
cell<br />
Sample Height<br />
(mm)<br />
Transmission<br />
Transmission<br />
BackScattering<br />
BackScattering<br />
Intensity (%)<br />
The measurement performed allows the quantification of the physical processes involved :<br />
backscattered (BS) and transmitted (T) light fluxes measured depend respectively on the<br />
mean path length of photons in the dispersion λ and λ*. These physical absolute parameters, depending on<br />
particle diameter d and volume fraction Φ, give information on the real state of the dispersion (no dilution required).<br />
dh = detection area height<br />
g(d) = Assymetry factor<br />
QS(d) = Scattering efficiency factor<br />
Multiple Light Scattering Theory<br />
Dispersions instability is often the result of two different physical processes :<br />
Particle size increase (droplets or aggregates) due to coalescence or flocculation phenomena,<br />
Particles migration within the samples leading to creaming or sedimentation.<br />
The TurbiScan MA 2000 performs a kinetic analysis allowing the detection of these phenomena at an early stage.<br />
Stability<br />
If no particule size or volume fraction<br />
change occurs, BS & T remain constant<br />
(all the profiles superimpose).<br />
Particle size variation<br />
Particule size variations (flocculation or<br />
coalescence) induce λ* or λ changes,<br />
and therefore BS & T variations on the<br />
whole height of the sample.<br />
Particles migration<br />
Particules migration phenomena<br />
(creaming or sedimentation) induce<br />
particle volume fraction changes at<br />
the extremities of the sample.<br />
By following the migration front,<br />
Turbiscan MA 2000 allows<br />
the calculation of the migration rate.<br />
STABILITY<br />
FLOCCULATION<br />
COALESCENCE<br />
CREAMING<br />
SEDIMENTATION<br />
ri = measurement cell internal radius<br />
Destabilisation<br />
Phenomena Characterisation<br />
Application examples<br />
Destabilisation<br />
understanding<br />
Sedimentation<br />
Comparison<br />
Coalescence and sedimentation of<br />
a concentrated cosmetic emulsion<br />
(O/W, Φ = 40%)<br />
The TurbiScan MA 2000 detects the destabilisation<br />
20 times earlier than the naked eye.<br />
Moreover, it allows to fully understand the destabilisation<br />
causes : here the coalescence phenomenon<br />
occurs first, resulting in big droplets which sediment.<br />
Quantification<br />
Vs (B)<br />
λ*<br />
d<br />
Vs (A)<br />
Coalescence<br />
d Vs<br />
Clarification<br />
Latex suspension analysis<br />
(Φ = 10 %, d(manufacturer) = 2.03 µm)<br />
The TurbiScan MA 2000 allows to<br />
calculate the particle mean diameter :<br />
• by measuring λ* in the sample heart<br />
(BS = 95 %, λ* = 96 µm) : d ≈ 1.9 µm<br />
• with the settling rate measurement<br />
(shift velocity of dispersion/continuous phase<br />
interface ,Vs ≈ 8.3 10 -8 ms -1 ) : d ≈ 2.1 µm<br />
(General Law of Sedimentation, Snabre, Mills, 1994)<br />
Compared sedimentation of<br />
two latex suspensions<br />
(Φ = 10 %)<br />
The TurbiScan MA 2000 gives an easy to access<br />
picture of products behaviour comparison.<br />
The drawn kinetics give the thickness evolution of<br />
the clarification phase (in the sample top) as a<br />
function of time. Due to the flocculation of the particles<br />
in the B product, their settling rate is bigger<br />
than for the A product.<br />
Vs (A) = 8.3 10-8 ms-1 : d (A) = 2.0 µm<br />
Vs (B) = 42 10-8 ms-1 : d (B) = 4.7 µm<br />
d (B) is the equivalent diameter of the sphere which<br />
settles at the same speed than the floc.<br />
Sedimentation<br />
Coalescence<br />
Clarification<br />
User friendly<br />
interface<br />
Functions<br />
The acquisition program<br />
allows the analysis of products<br />
which destabilise<br />
very quickly (1 scan every<br />
20 seconds) and quality<br />
control of stable products<br />
(1 scan per day).<br />
Integration modes are available<br />
to draw the destabilisation<br />
kinetics : BS and T<br />
mean value variations as a<br />
function of time to analyse<br />
destabilisation intensities,<br />
peak thickness (particle<br />
migration distance) as a<br />
function of time to analyse<br />
sediment or cream layer<br />
thickness evolution.<br />
An easy operation to directly<br />
overlay many kinetics<br />
allows the comparison of<br />
different products destabilisations.<br />
Conviviality<br />
All treatments can be saved<br />
(zoom, kinetic curves,...).<br />
Kinetics of reference products<br />
can be saved as templates,<br />
and easily compared<br />
with others analysis<br />
(ex : visualisation and selection<br />
of formula more or less<br />
stable than the reference).