Download a pdf - FOH Online
Download a pdf - FOH Online
Download a pdf - FOH Online

Create successful ePaper yourself
Turn your PDF publications into a flip-book with our unique Google optimized e-Paper software.
Rational Acoustics Smaart v7.1<br />
Editor’s Note: Steve submitted this as his<br />
regular “On the Digital Edge” column for the<br />
January issue of <strong>FOH</strong> but, as it is a pretty extensive<br />
look at the nuts and bolts of a much-used<br />
software program, we are running it as a Road<br />
Test instead. Same stuff, different header.<br />
Getting Smaart RT<br />
The latest revision of Rational Acoustics’<br />
Smaart is v7.1 which runs under Mac OSX (10.5<br />
or 10.6) as well as Windows 7, XP, or Vista. Rational<br />
Acoustics recommends at least a 2 GHz<br />
dual-core processor and Smaart is compatible<br />
with CoreAudio, WAV or ASIO audio drivers. I<br />
ran Smaart on a MacBook 2 GHz Core 2 Duo/4<br />
GB RAM with Digi 002R and MOTU Traveler<br />
interfaces. If you’ve never used Smaart, it’s<br />
worthwhile reviewing the resources available<br />
from the Rational Acoustics web site, particularly<br />
the PowerPoint presentation and basic<br />
setup guide. Reading these documents while<br />
following along with your system can cut<br />
down the learning curve, and since there’s a<br />
lot to learn about Smaart, this idea is… well…<br />
smart.<br />
The Interface RT<br />
Rational Acoustics incorporated many<br />
improvements to the interface of Smaart v7.1,<br />
including a “Capture All” command that stores<br />
all active measurement traces and an improved<br />
trace filing system. A major change is<br />
that this version supports simultaneous measurement<br />
of multiple channels. Other changes<br />
will be discussed below.<br />
Smaart’s primary modes (Real Time and<br />
Impulse Response) include time and frequency<br />
domain measurements, but first you need<br />
to set up your hardware in the audio dialogue.<br />
When Smaart recognizes your interface, it appears<br />
on a menu of available I/Os. You can then<br />
set sample rate, bit-depth (16 or 24) and apply<br />
your own names to the inputs and outputs<br />
(nice for managing multi-channel systems).<br />
Smaart played very well with my Digi 002R at<br />
sample rates of 44.1-, 48- and 96 kHz, though<br />
it does not support 88.2 kHz (which I don’t see<br />
as a problem). I cannot say the same for my<br />
MOTU Traveler, which Smaart did not like very<br />
much. Sometimes Smaart would recognize<br />
the Traveler, and other times — typically after<br />
changing the sample rate — it would not.<br />
Averaging and Weighting RT<br />
Inputs are organized and added into<br />
Groups under the Group Manager, where<br />
you’ll find parameters including averaging<br />
and weighting. Version 7.1 is the first to support<br />
multiple channels, enabling simultaneous<br />
measurement of, for example, console<br />
output, a mic at <strong>FOH</strong>, another mic in the balcony,<br />
etc. Active channels are viewed “overlay”<br />
style; clicking on an input in the Control Strip<br />
brings its trace to the front of a window. It’d be<br />
nice if you could tile the screen into separate<br />
windows for each trace (e.g. four windows of<br />
RTA, each displaying a channel).<br />
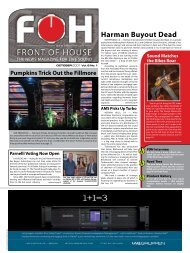
One of the few gripes I have with Smaart<br />
is that weighting is neither displayed nor accessible<br />
from the Control Strip, though it is<br />
indicated in the trace area. Figure 1 shows the<br />
Smaart Spectrum (RTA) function. Note that the<br />
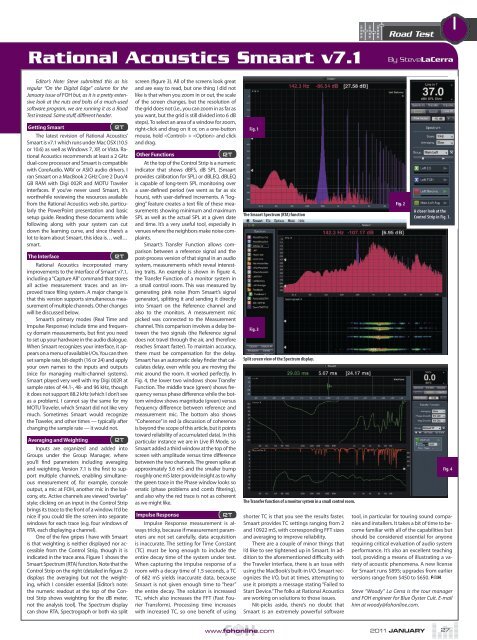
Control Strip on the right (detailed in figure 2)<br />
displays the averaging but not the weighting,<br />
which I consider essential [Editor’s note:<br />
the numeric readout at the top of the Control<br />
Strip shows weighting for the dB meter,<br />
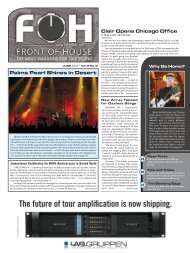
not the analysis tool]. The Spectrum display<br />
can show RTA, Spectrograph or both via split<br />
screen (figure 3). All of the screens look great<br />
and are easy to read, but one thing I did not<br />
like is that when you zoom in or out, the scale<br />
of the screen changes, but the resolution of<br />
the grid does not (i.e., you can zoom in as far as<br />
you want, but the grid is still divided into 6 dB<br />
steps). To select an area of a window for zoom,<br />
right-click and drag on it or, on a one-button<br />
mouse, hold + and click<br />
and drag.<br />
Other Functions RT<br />
At the top of the Control Strip is a numeric<br />
indicator that shows dBFS, dB SPL (Smaart<br />
provides calibration for SPL) or dBLEQ. dBLEQ<br />
is capable of long-term SPL monitoring over<br />
a user-defined period (we went as far as six<br />
hours), with user-defined increments. A “logging”<br />
feature creates a text file of these measurements<br />
showing minimum and maximum<br />
SPL as well as the actual SPL at a given date<br />
and time. It’s a very useful tool, especially in<br />
venues where the neighbors make noise complaints.<br />
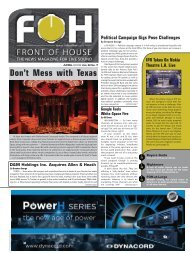
Smaart’s Transfer Function allows comparison<br />
between a reference signal and the<br />
post-process version of that signal in an audio<br />
system, measurements which reveal interesting<br />
traits. An example is shown in figure 4,<br />
the Transfer Function of a monitor system in<br />
a small control room. This was measured by<br />
generating pink noise (from Smaart’s signal<br />
generator), splitting it and sending it directly<br />
into Smaart on the Reference channel and<br />
also to the monitors. A measurement mic<br />
picked was connected to the Measurement<br />
channel. This comparison involves a delay between<br />
the two signals (the Reference signal<br />
does not travel through the air, and therefore<br />
reaches Smaart faster). To maintain accuracy,<br />
there must be compensation for the delay.<br />
Smaart has an automatic delay finder that calculates<br />
delay, even while you are moving the<br />
mic around the room. It worked perfectly. In<br />
Fig. 4, the lower two windows show Transfer<br />
Function. The middle trace (green) shows frequency<br />
versus phase difference while the bottom<br />
window shows magnitude (green) versus<br />
frequency difference between reference and<br />
measurement mic. The bottom also shows<br />
“Coherence” in red (a discussion of coherence<br />
is beyond the scope of this article, but it points<br />
toward reliability of accumulated data). In this<br />
particular instance we are in Live IR Mode, so<br />
Smaart added a third window at the top of the<br />
screen with amplitude versus time difference<br />
between the two channels. The green spike at<br />
approximately 5.6 mS and the smaller bump<br />
roughly one mS later provide insight as to why<br />
the green trace in the Phase window looks so<br />
erratic (phase problems and comb filtering),<br />
and also why the red trace is not as coherent<br />
as we might like.<br />
Impulse Response RT<br />
Impulse Response measurement is always<br />
tricky, because if measurement parameters<br />
are not set carefully, data acquisition<br />
is inaccurate. The setting for Time Constant<br />
(TC) must be long enough to include the<br />
entire decay time of the system under test.<br />
When capturing the impulse response of a<br />
room with a decay time of 1.5 seconds, a TC<br />
of 682 mS yields inaccurate data, because<br />
Smaart is not given enough time to “hear”<br />
the entire decay. The solution is increased<br />
TC, which also increases the FFT (Fast Fourier<br />
Transform). Processing time increases<br />
with increased TC, so one benefit of using<br />
Fig. 1<br />
The Smaart Spectrum (RTA) function<br />
Fig. 3<br />
www.fohonline.com<br />
Split screen view of the Spectrum display.<br />
The Transfer function of a monitor system in a small control room.<br />
shorter TC is that you see the results faster.<br />
Smaart provides TC settings ranging from 2<br />
and 10922 mS, with corresponding FFT sizes<br />
and averaging to improve reliability.<br />
There are a couple of minor things that<br />
I’d like to see tightened up in Smaart. In addition<br />
to the aforementioned difficulty with<br />
the Traveler interface, there is an issue with<br />
using the MacBook’s built-in I/O. Smaart recognizes<br />
the I/O, but at times, attempting to<br />
use it prompts a message stating “Failed to<br />
Start Device.” The folks at Rational Acoustics<br />
are working on solutions to those issues.<br />
Nit-picks aside, there’s no doubt that<br />
Smaart is an extremely powerful software<br />
Road Test<br />
By SteveLaCerra<br />
Fig. 2<br />
tool, in particular for touring sound companies<br />
and installers. It takes a bit of time to become<br />
familiar with all of the capabilities but<br />
should be considered essential for anyone<br />
requiring critical evaluation of audio system<br />
performance. It’s also an excellent teaching<br />
tool, providing a means of illustrating a variety<br />
of acoustic phenomena. A new license<br />
for Smaart runs $895; upgrades from earlier<br />
versions range from $450 to $650.<br />
Steve “Woody” La Cerra is the tour manager<br />
and <strong>FOH</strong> engineer for Blue Öyster Cult. E-mail<br />
him at woody@fohonline.com.<br />
2011 JANUARY<br />
A closer look at the<br />
Control Strip in Fig. 1.<br />
Fig. 4<br />
27