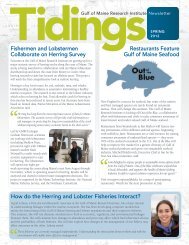
A Socioeconomic Survey of New England Lobster Fishermen
A Socioeconomic Survey of New England Lobster Fishermen
A Socioeconomic Survey of New England Lobster Fishermen

You also want an ePaper? Increase the reach of your titles
YUMPU automatically turns print PDFs into web optimized ePapers that Google loves.
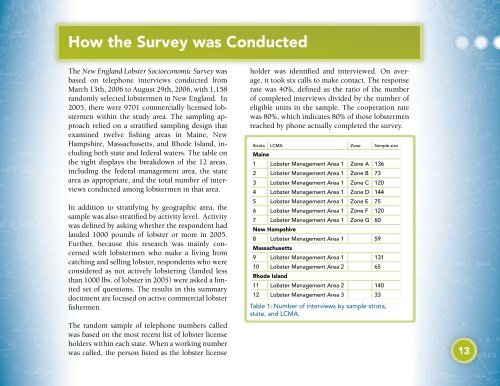
How the <strong>Survey</strong> was Conducted<br />
The <strong>New</strong> <strong>England</strong> <strong>Lobster</strong> <strong>Socioeconomic</strong> <strong>Survey</strong> was<br />
based on telephone interviews conducted from<br />
March 13th, 2006 to August 29th, 2006, with 1,158<br />
randomly selected lobstermen in <strong>New</strong> <strong>England</strong>. In<br />
2005, there were 9701 commercially licensed lobstermen<br />
within the study area. The sampling approach<br />
relied on a stratified sampling design that<br />
examined twelve fishing areas in Maine, <strong>New</strong><br />
Hampshire, Massachusetts, and Rhode Island, including<br />
both state and federal waters. The table on<br />
the right displays the breakdown <strong>of</strong> the 12 areas,<br />
including the federal management area, the state<br />
area as appropriate, and the total number <strong>of</strong> interviews<br />
conducted among lobstermen in that area.<br />
In addition to stratifying by geographic area, the<br />
sample was also stratified by activity level. Activity<br />
was defined by asking whether the respondent had<br />
landed 1000 pounds <strong>of</strong> lobster or more in 2005.<br />
Further, because this research was mainly concerned<br />
with lobstermen who make a living from<br />
catching and selling lobster, respondents who were<br />
considered as not actively lobstering (landed less<br />
than 1000 lbs. <strong>of</strong> lobster in 2005) were asked a limited<br />
set <strong>of</strong> questions. The results in this summary<br />
document are focused on active commercial lobster<br />
fishermen.<br />
The random sample <strong>of</strong> telephone numbers called<br />
was based on the most recent list <strong>of</strong> lobster license<br />
holders within each state. When a working number<br />
was called, the person listed as the lobster license<br />
holder was identified and interviewed. On average,<br />
it took six calls to make contact. The response<br />
rate was 40%, defined as the ratio <strong>of</strong> the number<br />
<strong>of</strong> completed interviews divided by the number <strong>of</strong><br />
eligible units in the sample. The cooperation rate<br />
was 80%, which indicates 80% <strong>of</strong> those lobstermen<br />
reached by phone actually completed the survey.<br />
Strata LCMA Zone Sample size<br />
Maine<br />
1 <strong>Lobster</strong> Management Area 1 Zone A 136<br />
2 <strong>Lobster</strong> Management Area 1 Zone B 73<br />
3 <strong>Lobster</strong> Management Area 1 Zone C 120<br />
4 <strong>Lobster</strong> Management Area 1 Zone D 144<br />
5 <strong>Lobster</strong> Management Area 1 Zone E 75<br />
6 <strong>Lobster</strong> Management Area 1 Zone F 120<br />
7 <strong>Lobster</strong> Management Area 1 Zone G 60<br />
<strong>New</strong> Hampshire<br />
8 <strong>Lobster</strong> Management Area 1 59<br />
Massachusetts<br />
9 <strong>Lobster</strong> Management Area 1 131<br />
10 <strong>Lobster</strong> Management Area 2 65<br />
Rhode Island<br />
11 <strong>Lobster</strong> Management Area 2 140<br />
12 <strong>Lobster</strong> Management Area 3 33<br />
Table 1: Number <strong>of</strong> interviews by sample strata,<br />
state, and LCMA.<br />
13