A Socioeconomic Survey of New England Lobster Fishermen
A Socioeconomic Survey of New England Lobster Fishermen
A Socioeconomic Survey of New England Lobster Fishermen

You also want an ePaper? Increase the reach of your titles
YUMPU automatically turns print PDFs into web optimized ePapers that Google loves.
What We Learned - Key Findings <strong>of</strong> the <strong>Survey</strong><br />
How Vulnerable are <strong>Lobster</strong> Fishing Families to a Potential Drop in Landings?<br />
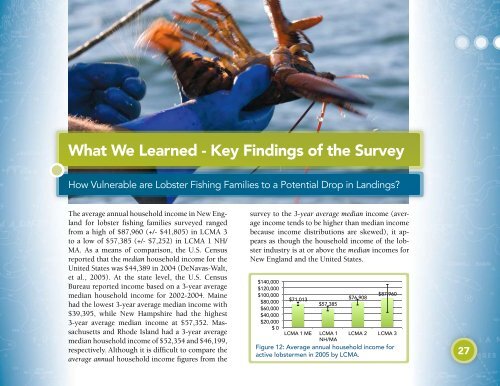
The average annual household income in <strong>New</strong> <strong>England</strong><br />
for lobster fishing families surveyed ranged<br />
from a high <strong>of</strong> $87,960 (+/- $41,805) in LCMA 3<br />
to a low <strong>of</strong> $57,385 (+/- $7,252) in LCMA 1 NH/<br />
MA. As a means <strong>of</strong> comparison, the U.S. Census<br />
reported that the median household income for the<br />
United States was $44,389 in 2004 (DeNavas-Walt,<br />
et al., 2005). At the state level, the U.S. Census<br />
Bureau reported income based on a 3-year average<br />
median household income for 2002-2004. Maine<br />
had the lowest 3-year average median income with<br />
$39,395, while <strong>New</strong> Hampshire had the highest<br />
3-year average median income at $57,352. Massachusetts<br />
and Rhode Island had a 3-year average<br />
median household income <strong>of</strong> $52,354 and $46,199,<br />
respectively. Although it is difficult to compare the<br />
average annual household income figures from the<br />
survey to the 3-year average median income (average<br />
income tends to be higher than median income<br />
because income distributions are skewed), it appears<br />
as though the household income <strong>of</strong> the lobster<br />
industry is at or above the median incomes for<br />
<strong>New</strong> <strong>England</strong> and the United States.<br />
$140,000<br />
$120,000<br />
$100,000<br />
$80,000<br />
$60,000<br />
$40,000<br />
$20,000<br />
$0<br />
$71,013<br />
$57,385<br />
LCMA 1 ME LCMA 1<br />
NH/MA<br />
$76,908<br />
$87,960<br />
LCMA 2 LCMA 3<br />
Figure 12: Average annual household income for<br />
active lobstermen in 2005 by LCMA.<br />
27