The Nalunaq gold prospect, South Greenland - Geus
The Nalunaq gold prospect, South Greenland - Geus
The Nalunaq gold prospect, South Greenland - Geus

Create successful ePaper yourself
Turn your PDF publications into a flip-book with our unique Google optimized e-Paper software.
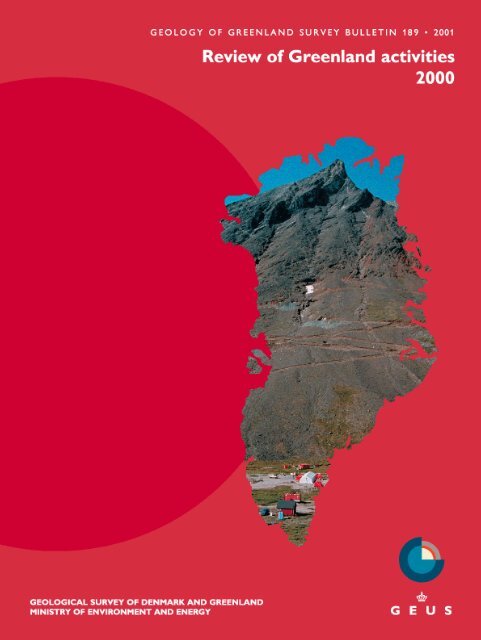
GEOLOGY OF GREENLAND SURVEY BULLETIN 189 • 2001<br />
Review of <strong>Greenland</strong> activities<br />
2000<br />
Edited by<br />
A.K. Higgins and Karsten Secher<br />
GEOLOGICAL SURVEY OF DENMARK AND GREENLAND<br />
MINISTRY OF ENVIRONMENT AND ENERGY
Geology of <strong>Greenland</strong> Survey Bulletin 189<br />
Keywords<br />
Climatic research, <strong>Greenland</strong> activities 2000, hyperspectral survey, limnology, marine geophysics, mineral resources, petroleum geology,<br />
publications review, sedimentology, stratigraphy.<br />
Cover<br />
<strong>The</strong> <strong>Nalunaq</strong> <strong>gold</strong> <strong>prospect</strong>, <strong>South</strong> <strong>Greenland</strong>, has been in focus in 2000 with test mining for feasibility studies. <strong>The</strong> scene features<br />
the east face of the <strong>Nalunaq</strong> mountain, the summit of which is 1100 m above the temporary mining camp situated on the valley floor.<br />
<strong>The</strong> winding road provides access to the adit portals at exploration levels 350, 400 and 450 m (see the article on <strong>Nalunaq</strong> <strong>gold</strong> <strong>prospect</strong>,<br />
page 70). Photo: Hans Christian Langager.<br />
Frontispiece: facing page<br />
Swarm of hydrothermal veins (‘Yellow Zone’) situated at the margin of a Palaeogene breccia pipe (upper right) north of Amdrup<br />
Fjord, southern East <strong>Greenland</strong>. <strong>The</strong> person clad in red in the centre of the picture is collecting a chip sample, which returned 0.8%<br />
Cu, 1.4% Pb, 3.2% Zn, 0.3 ppm Au and 127 ppm Ag over 4 m. <strong>The</strong> photograph was taken during EG 2000 (see Nielsen et al., page<br />
83 and Thomassen & Krebs, page 76) and the investigations demonstrate that the area holds a potential for vein-type <strong>gold</strong> and silver<br />
deposits.<br />
Photo: Bjørn Thomassen.<br />
Chief editor of this series: Peter R. Dawes<br />
Scientific editors: A.K. Higgins and Karsten Secher in conjunction with Peter R. Dawes<br />
Copy editors: A.K. Higgins and Karsten Secher<br />
Editorial secretary: Esben W. Glendal<br />
Illustrations: Annabeth Andersen, Jette Halskov, Eva Melskens and Alice Rosenstand<br />
Lay-out and graphic production: Carsten E. Thuesen<br />
Printers: From & Co. A/S, Copenhagen, Denmark<br />
Manuscripts submitted: 1 February – 19 March 2001<br />
Final versions approved: 3 July 2001<br />
Printed: 31st October 2001<br />
ISBN 87-7871-086-3<br />
ISSN 1397-1905<br />
Geology of <strong>Greenland</strong> Survey Bulletin<br />
<strong>The</strong> series Geology of <strong>Greenland</strong> Survey Bulletin is a continuation of Bulletin Grønlands Geologiske Undersøgelse and incorporates<br />
Rapport Grønlands Geologiske Undersøgelse.<br />
Citation of the name of this series<br />
It is recommended that the name of this series is cited in full, viz. Geology of <strong>Greenland</strong> Survey Bulletin.<br />
If abbreviation of this volume is necessary the following form is suggested: Geology <strong>Greenland</strong> Surv. Bull. 189, 131 pp.<br />
Available from<br />
Geological Survey of Denmark and <strong>Greenland</strong><br />
Thoravej 8, DK-2400 Copenhagen NV, Denmark<br />
Phone: +45 38 14 20 00, fax: +45 38 14 20 50, e-mail: geus@geus.dk<br />
or<br />
Geografforlaget ApS<br />
Fruerhøjvej 43, DK-5464 Brenderup, Denmark<br />
Phone: +45 63 44 16 83, fax: +45 63 44 16 97, e-mail: go@geografforlaget.dk<br />
© Danmarks og Grønlands Geologiske Undersøgelse (GEUS), 2001
15<br />
14<br />
12<br />
2<br />
13<br />
3<br />
11<br />
10<br />
4,5<br />
6<br />
9<br />
1<br />
500 km<br />
7<br />
8<br />
Physiographic map of <strong>Greenland</strong> showing the locations discussed in the 15 technical papers of this volume. <strong>The</strong> map is reproduced<br />
with courtesy of the National Survey and Cadastre, Copenhagen. For a full list of Survey field activities in 2000 and for the geographical<br />
subdivisions as used in this bulletin, see the map in the directorial review (Fig. 1, page 8).<br />
4
Contents<br />
Numbers of articles correspond to those on to the map opposite<br />
<strong>The</strong> year in focus, 2000<br />
K. Sørensen<br />
<strong>The</strong> year’s publications: a review with listing for 2000<br />
P.R. Dawes<br />
1. Petroleum geological activities in West <strong>Greenland</strong> in 2000<br />
F.G. Christiansen, J.A. Bojesen-Koefoed, J.A. Chalmers, F. Dalhoff, A. Mathiesen, M. Sønderholm, G. Dam,<br />
U. Gregersen, C. Marcussen, H. Nøhr-Hansen, S. Piasecki, T. Preuss, T.C.R. Pulvertaft, J.A. Rasmussen and<br />
E. Sheldon<br />
2. Acquisition of high-resolution multichannel seismic data in the offshore part of the Nuussuaq<br />
Basin, central West <strong>Greenland</strong><br />
C. Marcussen, J.A. Chalmers, H.L. Andersen, R. Rasmussen and T. Dahl-Jensen<br />
3. Late Quaternary circulation changes and sedimentation in Disko Bugt and adjacent fjords, central<br />
West <strong>Greenland</strong><br />
A. Kuijpers, J.M. Lloyd, J.B. Jensen, R. Endler, M. Moros, L.A. Park, B. Schulz, K.G. Jensen and T. Laier<br />
4. Palaeolimnological investigation of atmospheric pollution in the Søndre Strømfjord region, southern<br />
West <strong>Greenland</strong>: accumulation rates and spatial patterns<br />
R. Bindler, N.J. Anderson, I. Renberg and C. Malmquist<br />
5. Determining the date of ice-melt for low Arctic lakes along Søndre Strømfjord, southern West<br />
<strong>Greenland</strong><br />
N.J. Anderson and K.P. Brodersen<br />
6. Holocene temperature and environmental reconstruction from lake sediments in the Søndre<br />
Strømfjord region, southern West <strong>Greenland</strong><br />
K.P. Brodersen, C. Lindegaard and N.J. Anderson<br />
7. Marine and terrestrial investigations in the Norse Eastern Settlement, <strong>South</strong> <strong>Greenland</strong><br />
N. Mikkelsen, A. Kuijpers, S. Lassen and J. Vedel<br />
8. <strong>The</strong> <strong>Nalunaq</strong> <strong>gold</strong> <strong>prospect</strong>, <strong>South</strong> <strong>Greenland</strong>: test mining for feasibility studies<br />
M. Lind, L. Kludt and B. Ballou<br />
9. Reconnaissance for noble metals in Precambrian and Palaeogene rocks, Amdrup Fjord, southern<br />
East <strong>Greenland</strong><br />
B. Thomassen and J.D. Krebs<br />
10. <strong>The</strong> East <strong>Greenland</strong> continental margin, the Prinsen af Wales Bjerge and new Skaergaard intrusion<br />
initiatives<br />
T.F.D. Nielsen, H. Hansen, C.K. Brooks, C.E. Lesher and field parties<br />
11. Pre-basaltic sediments (Aptian–Paleocene) of the Kangerlussuaq Basin, southern East <strong>Greenland</strong><br />
M. Larsen, M. Bjerager, T. Nedkvitne, S. Olaussen and T. Preuss<br />
12. Vendian – Lower Ordovician stratigraphy of Ella Ø, North-East <strong>Greenland</strong>: new investigations<br />
S. Stouge, D.W. Boyce, J. Christiansen, D.A.T. Harper and I. Knight<br />
13. Periglacial processes in the Mestersvig region, central East <strong>Greenland</strong><br />
N. Mikkelsen, S. Carver, J. Woodward and H.H. Christiansen<br />
14. Projects MINEO and HyperGreen: airborne hyperspectral data acquisition in East <strong>Greenland</strong> for<br />
environmental monitoring and mineral exploration<br />
T. Tukiainen<br />
15. Studies of sea-ice conditions north of <strong>Greenland</strong>: results from a pilot GRASP initiative on the extension<br />
of territorial limits into the Arctic Ocean<br />
N. Mikkelsen, P. Gudmandsen and R. Forsberg<br />
7<br />
11<br />
24<br />
34<br />
41<br />
48<br />
54<br />
59<br />
65<br />
70<br />
76<br />
83<br />
99<br />
107<br />
115<br />
122<br />
127<br />
5
■<br />
■<br />
■<br />
■<br />
■<br />
■<br />
■<br />
■<br />
■<br />
■<br />
■<br />
■<br />
■<br />
■<br />
■<br />
■<br />
■<br />
■<br />
■<br />
■<br />
■<br />
■<br />
■<br />
■<br />
■<br />
■<br />
■<br />
■<br />
■<br />
■<br />
■<br />
■<br />
■<br />
■<br />
■<br />
■<br />
■<br />
■<br />
■<br />
■<br />
■<br />
■<br />
■<br />
■<br />
▲<br />
■<br />
■<br />
■<br />
■<br />
■<br />
■<br />
■■<br />
■<br />
■<br />
■<br />
■<br />
■<br />
■<br />
■<br />
■<br />
■<br />
■<br />
■<br />
■ ■<br />
▲<br />
■<br />
■<br />
■<br />
■<br />
■<br />
▲<br />
▲<br />
▲<br />
▲<br />
▲<br />
▲<br />
▲<br />
▲<br />
▲<br />
▲<br />
■<br />
■<br />
■<br />
■<br />
■<br />
■ ■<br />
■<br />
■<br />
■<br />
■<br />
■<br />
■<br />
■<br />
■<br />
■<br />
■<br />
■<br />
■<br />
■<br />
■<br />
■<br />
■<br />
■<br />
■<br />
■<br />
■<br />
■<br />
■<br />
■<br />
■<br />
■<br />
■ ■<br />
■<br />
■<br />
■<br />
■<br />
■<br />
■<br />
■<br />
■<br />
■<br />
■<br />
■<br />
■<br />
■<br />
■<br />
■<br />
■<br />
90°<br />
Ellesmere Island<br />
78°<br />
80°<br />
76°<br />
■<br />
■<br />
90° 80° 70° 60° 50° 40° 30° 20° 10° 0° 10°<br />
Canada<br />
Qaanaaq<br />
■ ■<br />
■<br />
Nares<br />
■<br />
IMB<br />
t<br />
Strai<br />
■<br />
■<br />
■<br />
Lincoln<br />
Alert<br />
Sea<br />
■<br />
IO<br />
▲ ▲<br />
Wandel<br />
Sea<br />
▲ ▲ ▲ ▲<br />
▲▲ ▲<br />
▲<br />
▲<br />
▲ ▲ ▲<br />
▲<br />
Station<br />
Nord<br />
■<br />
■ ■<br />
G r<br />
■ ■<br />
e e n l<br />
■ ■ ■<br />
a n d<br />
S e a<br />
80°<br />
10°<br />
78°<br />
0°<br />
76°<br />
Geological map<br />
of<br />
<strong>Greenland</strong>:<br />
onshore/offshore<br />
Modified from the poster<br />
“Sedimentary basins of<br />
<strong>Greenland</strong>” at 1:5 000 000<br />
compiled by T.C.R.<br />
Pulvertaft (1995). <strong>The</strong><br />
bathymetric contour shown<br />
is at 500 m.<br />
■ ■ ■ ■ ■<br />
■ ■ ■<br />
■ ■ ■ ■<br />
■<br />
■ ■<br />
■<br />
■<br />
Melville<br />
▲<br />
■<br />
▲<br />
■ ■<br />
74°<br />
70°<br />
■<br />
■<br />
■<br />
■ ■<br />
■<br />
■<br />
■<br />
Bugt<br />
<strong>Greenland</strong><br />
74°<br />
10°<br />
■<br />
■<br />
Daneborg<br />
72°<br />
Baffin<br />
Bay<br />
■ ■<br />
■<br />
Upernavik<br />
■ ■<br />
Inland Ice<br />
▲<br />
▲<br />
▲<br />
■<br />
■ ■<br />
72°<br />
RMB<br />
■ ■<br />
▲ ▲<br />
▲<br />
70°<br />
with C anada<br />
■ ■<br />
■<br />
■<br />
▲<br />
▲<br />
▲<br />
▲<br />
▲<br />
▲<br />
▲<br />
▲<br />
■ ■<br />
70°<br />
Illoqqortoormiut /<br />
Scoresbysund<br />
Border<br />
■ ■<br />
68°<br />
500 m<br />
■<br />
Disko<br />
Bugt<br />
Ilulissat<br />
■ ■ ■<br />
68°<br />
■ ■<br />
66°<br />
60°<br />
64°<br />
62°<br />
60°<br />
Davis<br />
Strait<br />
■<br />
■<br />
■<br />
▲<br />
■<br />
■<br />
▲<br />
▲<br />
■<br />
▲<br />
■<br />
▲<br />
▲<br />
■<br />
Labrador<br />
Sea<br />
■ ■<br />
▲<br />
■<br />
■ ■<br />
■ ■<br />
■<br />
■<br />
▲<br />
■<br />
■<br />
■<br />
■ ■<br />
■ ■<br />
■<br />
■<br />
■<br />
■<br />
Sisimiut<br />
Nuuk<br />
■<br />
■<br />
▲<br />
▲<br />
■<br />
▲ ▲<br />
■<br />
■<br />
▲<br />
NMB<br />
Qaqortoq<br />
KMB<br />
60°<br />
50° 40°<br />
▲<br />
▲ ▲ ▲<br />
■<br />
Tasiilaq /<br />
Ammassalik<br />
■ ■<br />
▲ ▲<br />
500 m<br />
▲<br />
500 km<br />
D e n m a r k S t r a i t<br />
30°<br />
66°<br />
64°<br />
62°<br />
Offshore basins with substantial<br />
sediment thicknesses<br />
Offshore basins where deeper<br />
sedimentary successions are concealed<br />
by Paleogene basalts<br />
North Atlantic<br />
Ocean<br />
Landward limit of proven oceanic crust<br />
Extensional fault<br />
Compressional fault, thrust<br />
Strike-slip fault<br />
Transform fault<br />
Iceland Permanent ice<br />
500 m<br />
35° 30° 25°<br />
66°<br />
Intrusive complexes; Paleogene in East<br />
<strong>Greenland</strong>, 20° Mesoproterozoic in <strong>South</strong> <strong>Greenland</strong><br />
Basalts: Paleogene in East and West <strong>Greenland</strong>;<br />
Upper Cretaceous in North <strong>Greenland</strong><br />
Cretaceous–Paleogene sediments,<br />
Reykjavik West 64° <strong>Greenland</strong> and East <strong>Greenland</strong>;<br />
Nuussuaq and Kangerlussuaq Basins<br />
Carboniferous–Paleogene sediments,<br />
Wandel Sea Basin in North <strong>Greenland</strong><br />
Carboniferous–Cretaceous sediments,<br />
East <strong>Greenland</strong>, Jameson Land Basin<br />
62°<br />
and North-East <strong>Greenland</strong><br />
Devonian sediments and volcanics,<br />
North-East <strong>Greenland</strong><br />
Shelf<br />
Trough*<br />
60°<br />
Lower Palaeozoic sediments, North<br />
<strong>Greenland</strong>. * Reaches Devonian<br />
Franklinian Basin, IO: Innuitian orogen<br />
Meso- to Neoproterozoic sediments and<br />
volcanic rocks<br />
Caledonian orogenic belt, contains Archaean,<br />
Proterozoic and Palaeozoic rocks<br />
Palaeoproterozoic orogenic belts, contain<br />
both Archaean and Proterozoic rocks<br />
IMB: Inglefield mobile belt;<br />
RMB: Rinkian mobile belt;<br />
KMB: Ketilidian mobile belt;<br />
NMB: Nagssugtoqidian mobile belt<br />
Site of exploration well<br />
Archaean craton<br />
6
<strong>The</strong> year in focus, 2000<br />
Kai Sørensen<br />
Director<br />
<strong>The</strong> year 2000 was unusual in that it lacked major field<br />
activity directly involved with the systematic geological<br />
mapping of <strong>Greenland</strong>. However, field activities were<br />
again many and varied, including a successful highresolution<br />
seismic survey offshore central West <strong>Greenland</strong>,<br />
and a joint Geological Survey of Denmark and<br />
<strong>Greenland</strong> (GEUS) – Danish Lithosphere Centre (DLC)<br />
project centred on Kangerlussuaq in southern East <strong>Greenland</strong>.<br />
Of the Survey’s 354 personnel, 93 were allocated<br />
to <strong>Greenland</strong>-related activities (Table 1). <strong>The</strong> <strong>Greenland</strong><br />
level of activity in 2000, both in Copenhagen and in the<br />
field, thus compared favourably with that of 1999.<br />
<strong>The</strong> Survey is obliged to spend a fixed percentage of<br />
its Finance Law grant on <strong>Greenland</strong>-related activities.<br />
<strong>The</strong>se activities are planned each year by the Survey in<br />
consultation with the <strong>Greenland</strong> authorities, in particular<br />
the Bureau of Minerals and Petroleum (BMP). <strong>The</strong><br />
activities, as described in the annual work programme,<br />
are approved by the Board of GEUS, on which the BMP<br />
is represented. In addition to the Finance Law grant,<br />
funding of <strong>Greenland</strong> activities comes from the BMP,<br />
the Danish Energy Research Programme and the Danish<br />
National Research Foundation; the last named institution<br />
funds the DLC, as well as a number of other research<br />
centres in Denmark. Funding for specific research projects<br />
in 2000 included grants from the Carlsberg<br />
Foundation, the Danish Natural Science Research<br />
Council, the Commission for Scientific Research in<br />
<strong>Greenland</strong> and the European Union (EU).<br />
During parts of the year 2000, several geologists from<br />
GEUS were seconded to the BMP in Nuuk, <strong>Greenland</strong>,<br />
to assist in work concerning both mineral and oil exploration.<br />
Together with BMP, GEUS continues to inform<br />
the international oil and mining industries on exploration<br />
possibilities in <strong>Greenland</strong>, both through participation<br />
in conferences in Europe and North America, and<br />
through publication of the newsletters <strong>Greenland</strong> MINEX<br />
News (directed towards the mining industry) and Ghexis<br />
Newsletter (directed towards the oil industry).<br />
Regional geology and mapping<br />
Field work for the long-term mapping project aimed at<br />
the publication of 1:500 000 geological maps of the<br />
land areas of <strong>Greenland</strong> was completed in 1999. One<br />
sheet was printed in 2000, and compilation of the final<br />
two map sheets in the 14-map series is underway with<br />
printing planned for 2001 and 2002 respectively (see<br />
also publications review, page 11). Geological maps in<br />
the 1:100 000 series continue to be published, currently<br />
with about one new sheet annually.<br />
A multinational field party continued studies in the<br />
very Early Archaean greenstone belt at Isua, north-east<br />
of Nuuk (Fig. 1, A). This was planned to be the last year<br />
of field activities for the Isua Multidisciplinary Research<br />
Table 1. Key statistics on Survey resources<br />
RESOURCES 2000 1999<br />
HUMAN RESOURCES<br />
Permanent staff (man-years)<br />
GEUS personnel* 354 356<br />
Allocated to <strong>Greenland</strong> work 93 87<br />
<strong>Greenland</strong> field work (persons)<br />
Total number of participants† 92 85<br />
DLC persons involved 21 27<br />
FINANCIAL RESOURCES (million DKK)<br />
GEUS Finance Law grant 138 135<br />
Of this spent on <strong>Greenland</strong> activities 32 33<br />
GEUS external funding‡ 77 78<br />
Of this spent on <strong>Greenland</strong> activities 22 28<br />
DLC spending on <strong>Greenland</strong> activities 14 18<br />
Total expenditure on <strong>Greenland</strong> activities 68 79<br />
* excludes DLC staff resource of c. 20.<br />
† includes DLC and external scientists.<br />
‡ excludes DLC funds.<br />
From: Annual Accounts 1999/2000 and internal/external sources.<br />
Geology of <strong>Greenland</strong> Survey Bulletin 189, 7–10 (2001) © GEUS, 2001<br />
7
Canada<br />
52°<br />
Ellesmere<br />
Island<br />
Pituffik<br />
Thule Air Base<br />
Upernavik<br />
Nuussuaq<br />
Disko M<br />
Disko Bugt<br />
Sisimiut<br />
Maniitsoq<br />
N<br />
I<br />
Nuuk<br />
A<br />
central<br />
western eastern<br />
North<br />
North - West<br />
H<br />
J<br />
E<br />
central<br />
West<br />
southern<br />
West<br />
<strong>South</strong> -<br />
West<br />
<strong>South</strong><br />
Nanortalik<br />
Alert<br />
Kangerlussuaq<br />
F K<br />
O<br />
North - East<br />
Inland<br />
Ice<br />
central<br />
East<br />
southern<br />
East<br />
<strong>South</strong> -<br />
East<br />
44° Kap Farvel<br />
B<br />
Tasiilaq<br />
Ammassalik<br />
36°<br />
Station Nord<br />
G<br />
C<br />
L<br />
Jameson<br />
Land<br />
Kangerlussuaq<br />
400 km<br />
80°<br />
76°<br />
Daneborg<br />
72°<br />
Mestersvig<br />
Iceland<br />
D<br />
Scoresby<br />
Sund<br />
28°<br />
68°<br />
64°<br />
60°<br />
Fig. 1. Map showing the regions in which Survey field activities<br />
were carried out in 2000: frames A–O. Letters underlined below<br />
indicate those regions for which articles are presented in this volume;<br />
numbers 1–15 in parentheses refer to the articles as listed<br />
in the Contents and on the adjoining index map (pages 4 and 5).<br />
A: Isua Multidisciplinary Research Project, Isukasia region,<br />
regional geology and geochronology, early Archaean life.<br />
B: EG 2000, Kangerlussuaq area, Cretaceous–Palaeogene sedimentology,<br />
investigation of Palaeogene basalt formations and<br />
intrusive complexes (9, 10, 11).<br />
C: Ella Ø, Vendian – Lower Ordovician stratigraphy and palaeontology<br />
(12).<br />
D: Jameson Land Basin, sedimentological research.<br />
E: Ussuit 1:100 000 map sheet, geological mapping.<br />
F: <strong>Nalunaq</strong> <strong>gold</strong> <strong>prospect</strong>, Nanortalik area, mining geology and<br />
feasibility studies (8).<br />
G: MINEO and HyperGreen projects, hyperspectral and remote<br />
sensing research (14).<br />
H: Kimberlite Project, Kangerlussuaq–Sisimiut area, kimberlite survey<br />
and exploration.<br />
I: Offshore exploration drilling, Fylla offshore area, drilling of<br />
exploration well Qulleq-1 (1).<br />
J: Nuussuaq Basin geophysical survey, high resolution seismics<br />
(2).<br />
K: Holocene environment, palaeoclimate studies around former<br />
Norse settlements (7).<br />
L: Mestersvig, solifluction and mass-wasting experimental sites<br />
revisited (13).<br />
M: Disko Bugt, palaeo-oceanographic research, marine sample<br />
coring (3).<br />
N: Søndre Strømfjord, palaeoclimatic research, investigations of<br />
lake sediments and airborne pollutants (4, 5, 6).<br />
O: GRASP initiatives, North <strong>Greenland</strong> shelf area, sea-ice observations<br />
and satellite data comparison (15).<br />
Project, but due to poor weather conditions field objectives<br />
were not met, and field activities will now be carried<br />
out in 2001. <strong>The</strong> management and the Chairman<br />
of the Board of GEUS visited Isua during the field season<br />
(Fig. 2).<br />
With combined funding from DLC and GEUS, an<br />
extensive field programme (EG 2000) was carried out<br />
in the Kangerlussuaq area of southern East <strong>Greenland</strong>,<br />
from a base at Sødalen close to the Skaergaard intrusion<br />
(Fig. 1, B). Investigations included studies of the<br />
Cretaceous–Palaeogene sedimentary basin, as well as<br />
the Palaeogene basalt formations and intrusive complexes.<br />
A special grant from the Danish Natural Science<br />
Research Council made it possible to retrieve and transport<br />
to Copenhagen 6 km of selected drillcore (weighing<br />
20 tons), part of the 80 tons of drillcore recovered<br />
during mineral exploration of the Skaergaard intrusion<br />
in 1989–1990, and stored in the open at Sødalen. <strong>The</strong>se<br />
cores provide an invaluable research archive for an<br />
anticipated extensive research programme into differentiation<br />
processes in this celebrated layered gabbro<br />
intrusion.<br />
Field parties visited North-East and central East<br />
<strong>Greenland</strong>. One party carried out work from a base on<br />
Ella Ø (73°N; Fig. 1, C), collecting samples and mapping<br />
the Lower Palaeozoic carbonate succession which<br />
represents the passive margin of the Laurentian continent.<br />
A second party based at Constable Pynt (70°45′N;<br />
Fig. 1, D) investigated the sedimentology and biostratigraphy<br />
of the Upper Palaeozoic sediments exposed<br />
along the margin of the Jameson Land Basin.<br />
Limited field work was carried out on the Ussuit<br />
1:100 000 map sheet in the Nordre Strømfjord area,<br />
southern West <strong>Greenland</strong> (Fig. 1, E).<br />
8
Fig. 2. Mr. Leo Larsen, Permanent<br />
Secretary of the Danish Ministry of<br />
Environment and Energy (left) and Dr.<br />
Per Buch Andreasen, Chairman of the<br />
board of GEUS (right), at Isua north-east<br />
of Nuuk in July 2000; some of the visitors<br />
to the multinational research group<br />
studying the very Early Archaean<br />
greenstone belt.<br />
Photo: Johnny Fredericia.<br />
Mineral resources<br />
As part of the southern East <strong>Greenland</strong> activity reported<br />
on above, a field party investigated the mineralisation<br />
adjacent to Palaeogene intrusives in the Amdrup Fjord<br />
area (68°N; Fig. 1, B) and sampled extensively for analytical<br />
work.<br />
Survey representatives carried out a courtesy inspection<br />
visit to the site of the <strong>Nalunaq</strong> <strong>gold</strong> mineralisation<br />
(60°N; Fig. 1, F) in the Ketilidian supracrustal rocks of<br />
<strong>South</strong> <strong>Greenland</strong>. In the summer of 2000 the consortium<br />
holding the <strong>Nalunaq</strong> licence carried out test mining<br />
as part of a feasibility study with respect to future<br />
mining to extract the <strong>gold</strong>.<br />
<strong>The</strong> SUPRASYD project was concluded with the publication<br />
of a CD-ROM with systematic presentations of<br />
comprehensive geodata sets collected in the Proterozoic<br />
rocks of <strong>South</strong> <strong>Greenland</strong>. This is accessible to users in<br />
a format allowing GIS-manipulation.<br />
As a part of an EU-funded remote-sensing project<br />
(MINEO), collection of hyperspectral data was carried<br />
out over an area including the abandoned lead-zinc<br />
mine at Mestersvig in central East <strong>Greenland</strong> (Fig. 1, G).<br />
<strong>The</strong> project had a double aim of testing the method both<br />
for use in environmental monitoring as well as for<br />
exploration purposes. Hyperspectral data acquisition<br />
in the same region was extended with project Hyper-<br />
Green, a mineral exploration project financed by BMP<br />
(Fig. 1, G).<br />
Research had also been planned in the kimberlite<br />
province to the west of Kangerlussuaq airport in southern<br />
West <strong>Greenland</strong>, but the work accomplished was<br />
limited because of logistic problems (Fig. 1, H).<br />
Petroleum geology<br />
Drilling of the offshore Qulleq-1 well, some 150 km west<br />
of Nuuk, was carried out in the summer of 2000 in the<br />
Statoil-operated Fylla licence (Fig. 1, I). To the disappointment<br />
of all, the well did not encounter hydrocarbons<br />
in the tilted fault-block of the Fylla structural<br />
complex which it tested. It bottomed out in a reservoir<br />
sequence of Santonian age, so that the possible occurrence<br />
of Cenomanian–Turonian source rocks in the<br />
West <strong>Greenland</strong> offshore basins remains conjectural.<br />
In preparation for the licensing round planned for<br />
late 2001, a comprehensive reassessment of the West<br />
<strong>Greenland</strong> offshore basins has been undertaken, with<br />
the aim of identifying potential plays within the area to<br />
be included in the licensing round.<br />
In order to obtain a more detailed understanding of<br />
the Nuussuaq Basin of central West <strong>Greenland</strong>, a highresolution<br />
seismic survey was carried out in the waters<br />
north and south of the Nuussuaq peninsula using the<br />
research vessel R/V Dana (Fig. 1, J). Data acquisition<br />
was carried out over a period of 18 days, with recovery<br />
of 2743 line km of high-quality data. Spectacular reservoir<br />
sections of Late Cretaceous and Palaeogene age are<br />
exposed onshore, and the occurrence of oil seeps in<br />
basalts and shows in wells in this basin have demonstrated<br />
that the Nuussuaq Basin has exploration potential. <strong>The</strong><br />
additional seismic data are expected to encourage exploration<br />
interest by the petroleum industry.<br />
Below the basalts of southern East <strong>Greenland</strong> sediments<br />
of Cretaceous and Palaeogene age are preserved<br />
in the Kangerlussuaq Basin. <strong>The</strong>se sediments provide<br />
analogues of interest for exploration on the eastern<br />
9
Atlantic margin and an important data point in the<br />
reconstruction of the regional palaeogeography; a field<br />
party from the petroleum industry visited the region during<br />
2000, utilising the field base at Sødalen (Fig. 1, B).<br />
General scientific activities<br />
Aspects of the marine and onshore Holocene development<br />
of <strong>Greenland</strong> were in focus in a number of field<br />
investigations during the year. Thus, a visit to localities<br />
of the former Norse settlements in <strong>South</strong> <strong>Greenland</strong><br />
focused on acquisition of palaeoclimatic evidence (Fig.<br />
1, K), while a revisit to localities around Mestersvig, central<br />
East <strong>Greenland</strong> (Fig. 1, L), established during extensive<br />
short-term solifluction studies in the 1950s, permitted<br />
long-term conclusions and comparisons.<br />
Following the programme of acquisition of seismic<br />
data around Nuussuaq by R/V Dana, advantage was<br />
taken by marine geologists of GEUS and colleague institutions<br />
to use the ship to acquire piston cores, assisted<br />
by shallow sub-bottom seismic (chirp) profiling in the<br />
Egedesminde Dyb and outside the mouth of Jakobshavn<br />
Isfjord, in the Disko Bugt region (Fig. 1, M). <strong>The</strong> cruise<br />
constituted a follow-up to the marine geological investigations<br />
carried out in 1999 with the smaller research<br />
vessel R/V Porsild. With R/V Dana as a platform it was<br />
possible to collect longer cores in the eastern part of<br />
Disko Bugt, where sediment accumulation features<br />
allow mapping of potential palaeo-oceanographic variations<br />
and studies of the dynamic history of the ice<br />
margin. Meltwater from the Inland Ice through the Disko<br />
Bugt region may have contributed significantly to the<br />
deep-water formation in the Labrador Sea.<br />
Palaeolimnological investigations were continued in<br />
2000, with additional sampling and measurements in<br />
the water column of inland lakes near Søndre Strømfjord<br />
(Fig. 1, N); sampling of the lake sediments was also carried<br />
out. Palaeoclimate studies are ongoing and measurements<br />
of airborne pollutants have been initiated.<br />
In order to investigate the feasibility of establishing<br />
data collection from the sea ice to the north of <strong>Greenland</strong>,<br />
observations were made from flights with a C-130 aircraft<br />
for comparison with satellite images (Fig. 1, O).<br />
Publications<br />
<strong>The</strong> Survey published four issues in the peer-reviewed<br />
Geology of <strong>Greenland</strong> Survey Bulletin series in 2000, as<br />
well as a range of other publications including map<br />
sheets and compilations of data on CD-ROM. <strong>The</strong><br />
Survey’s 2000 publications dealing with <strong>Greenland</strong>,<br />
including papers published by Survey members and<br />
colleagues in international scientific outlets, are reviewed<br />
in the following pages (pp. 11–23).<br />
Author’s address<br />
Geological Survey of Denmark and <strong>Greenland</strong>, Thoravej 8, DK-2400 Copenhagen NV, Denmark. E-mail: ks@geus.dk<br />
10
<strong>The</strong> year’s publications: a review with listing for 2000<br />
Peter R. Dawes<br />
Chief Editor<br />
This review deals with just one part of the Survey’s total<br />
publication production for the year 2000, namely, that<br />
covering geoscientific topics about <strong>Greenland</strong>, the surrounding<br />
oceans and neighbouring lands, i.e. Canada,<br />
Svalbard and Iceland. Publications about Denmark, the<br />
Faeroe Islands, and other regions of Scandinavia, as<br />
well as elsewhere in the world where the Survey has<br />
been active, are listed on the Survey’s website<br />
(www.geus.dk).<br />
Following a summary of the year’s achievements, this<br />
review lists the publications released in 2000 in the<br />
Survey’s own series, as well as the scientific and semipopular<br />
articles written by staff and co-workers published<br />
in external outlets. International volumes on <strong>Greenland</strong><br />
and related areas, where staff have acted as scientific<br />
editors or compilers, are also cited. Geoscientific abstracts<br />
on <strong>Greenland</strong>, of which about 50 were published during<br />
the year, as well as other forms of information transfer<br />
(e.g. international symposia, seminars, conferences,<br />
posters, etc.) are not listed but may be consulted in the<br />
annual publication catalogue that is on the Geological<br />
Survey of Denmark and <strong>Greenland</strong> (GEUS) website.<br />
All available products are listed in the Catalogue of<br />
<strong>Greenland</strong> publications and data described below<br />
(Fig. 1). <strong>The</strong> present coverage of <strong>Greenland</strong> by standard<br />
geological maps at scales 1:500 000 and 1:100 000, as<br />
well as Quaternary geology and geophysical maps, is<br />
shown in the index maps of Fig. 2. <strong>The</strong> range of products<br />
now available on CD-ROM, and released in 2000,<br />
is illustrated in Fig. 3 while facsimiles of 2000 covers<br />
from four <strong>Greenland</strong>-relevant publication series are shown<br />
in Fig. 4.<br />
Summary of the year’s achievements<br />
<strong>The</strong> Survey’s status as a research and advisory institution<br />
under the Ministry of Environment and Energy carries<br />
a commitment to achieve specific objectives that<br />
are outlined and defined in contract periods. <strong>The</strong> year<br />
2000 was the first year of the new contract period<br />
2000–2003. An assessment in 1999 of the research and<br />
publications record of several departments at the Survey<br />
(specifically oil- and gas-related research) by an international<br />
evaluation panel led to a recommendation for<br />
more emphasis on the release of research results in<br />
international peer-reviewed publications. Rather than<br />
represent a fundamental change in publication strategy,<br />
the panel’s report (Danmarks og Grønlands Geologiske<br />
Undersøgelse Rapport 1999/69) calls for a shift in research<br />
culture to encourage more staff to publish, or to be<br />
involved in the preparation of, high-quality external<br />
publications, thus helping to promote the Survey’s international<br />
profile. In the short life of the present Survey<br />
(established in 1995 by the fusion of the former Geological<br />
Survey of Denmark and the former Geological<br />
Survey of <strong>Greenland</strong>), the number of scientific research<br />
products each year has been dominated by titles released<br />
in international outlets. Peer-review bulletins and maps<br />
in the Survey’s own series have formed only a small<br />
part of the total annual publication achievement and<br />
this also applies for the year 2000.<br />
<strong>The</strong> Survey’s field operations in <strong>Greenland</strong> in 2000<br />
and the associated activities in Copenhagen, including<br />
those of the Danish Lithosphere Centre (administratively<br />
attached to GEUS), resulted in about 50 scientific<br />
papers on <strong>Greenland</strong> and surrounding regions being<br />
released in external publication outlets. In addition,<br />
three special volumes on <strong>Greenland</strong> and neighbouring<br />
regions published by international journals were<br />
edited/compiled by Survey staff.<br />
Maps. <strong>The</strong> national geological map sheet coverage<br />
of <strong>Greenland</strong> has two scales: 1:500 000 and 1:100 000.<br />
<strong>The</strong> 1:500 000 series that was initiated in the 1970s is<br />
nearing completion (see Fig. 2A); the 1:100 000 map<br />
series, the first map sheet of which was published in<br />
1967, has a sporadic coverage with the main map-sheet<br />
blocks in West, <strong>South</strong>-West, <strong>South</strong> and East <strong>Greenland</strong><br />
Geology of <strong>Greenland</strong> Survey Bulletin 189, 11–23 (2001) © GEUS, 2001<br />
11
(see Fig. 2B). One map sheet from each series was<br />
printed in 2000. <strong>The</strong> publication of the Lambert Land map<br />
sheet from North-East <strong>Greenland</strong> brought the total of<br />
1:500 000 maps released up to 12, leaving just two sheets<br />
outstanding. <strong>The</strong> publication of the map sheet Uiffaq, from<br />
the Disko Bugt region of central West <strong>Greenland</strong>, brings<br />
the total of 1:100 000 maps printed up to 55.<br />
<strong>The</strong> high-resolution, airborne geophysical mapping<br />
of West <strong>Greenland</strong> south of 71ºN that was initiated in<br />
the early 1990s was completed with a survey in 1999<br />
of the region between 65º40′N and 68º20′N (see Fig.<br />
2D, for magnetic and electromagnetic coverage). In<br />
2000, a total of 62 maps from the 1999 survey were<br />
released: two at a scale of 1:250 000 with the remainder<br />
at 1:50 000. Parameters available are total magnetic<br />
intensity and associated vertical derivatives.<br />
Digital products. <strong>The</strong> demand for digital versions of<br />
all types of geoscientific data is increasing and the<br />
Survey is meeting this challenge by releasing soft copies<br />
of maps and data on CD-ROM (Fig. 3), as well as improving<br />
electronic access to databanks with the aim of delivering<br />
information through the internet. In 2000, nine<br />
CD-ROMs were issued; some of these comprise compilations<br />
of existing data and maps, while others contain<br />
new data and refined datasets and images. CD-ROMs<br />
designed to give exploration companies easy access to<br />
digital multi-datasets were released from onshore <strong>South</strong><br />
<strong>Greenland</strong> (mineral potential) and offshore southern<br />
West <strong>Greenland</strong> (hydrocarbon potential).<br />
<strong>The</strong> <strong>South</strong> <strong>Greenland</strong> CD-ROM, that focused on the<br />
mineral resource potential of the Palaeoproterozoic<br />
Ketilidian mobile belt, contains the hitherto most comprehensive<br />
digital assembly of geoscientific data available<br />
from a particular region of <strong>Greenland</strong>, with<br />
geological, geophysical, geochemical, topographical,<br />
mineral occurrences and remote sensing spatial datasets<br />
(see page 15 under CD-ROM issues). <strong>The</strong> West <strong>Greenland</strong><br />
CD-ROM, specially prepared to highlight the geology<br />
and hydrocarbon potential of the offshore region<br />
between 63º and 68ºN, contains a wide range of geoscientific<br />
data, including play types and information on<br />
licensing policy and operational conditions. In the<br />
Geology of Denmark and <strong>Greenland</strong> Map Series, seven<br />
CD-ROMs were released featuring previously published<br />
1:100 000 geological maps bringing the total of digital<br />
versions of standard map sheets up to 15 (eight CD-<br />
ROMs with geological maps at 1:500 000 have been<br />
released previously). Of the 2000 issues, six relate to<br />
the Archaean craton of southern West <strong>Greenland</strong>, and<br />
one is from the Palaeoproterozoic Ketilidian mobile<br />
belt of <strong>South</strong>-East <strong>Greenland</strong>.<br />
Bulletins. Four volumes of the Survey’s peer-reviewed<br />
series – Geology of <strong>Greenland</strong> Survey Bulletin – were<br />
published in 2000. <strong>The</strong>se included the long-awaited<br />
descriptive text to the 1:2 500 000 Geological map of<br />
<strong>Greenland</strong> (Bulletin 185); the map sheet itself was<br />
printed and released in 1995. A folded copy of the map<br />
is included with the bulletin. <strong>The</strong> map is also available<br />
as an individual sheet (96 × 120 cm) supplied in a map<br />
roll; an atlas (20 × 24 cm) presenting the map in 12 parts<br />
is in preparation. <strong>The</strong> effort to have the annual Review<br />
of <strong>Greenland</strong> activities (Bulletin 186 covering 1999 activities)<br />
to the public earlier than usual succeeded with<br />
printing in early July 2000. This publication, produced<br />
in full colour and with a wide distribution to libraries<br />
and the Survey’s geological contacts, continues to be<br />
the Survey’s most popular international publication.<br />
<strong>The</strong> review was followed by a multi-article volume<br />
(Bulletin 187) dealing with the sedimentary evolution<br />
of the Wandel Sea Basin in North <strong>Greenland</strong> based on<br />
new field work and palynological studies (of some relevance<br />
to the hydrocarbon potential of the immediate<br />
offshore region), and a volume (Bulletin 188) on the<br />
regional tectonic features of the late Phanerozoic rocks<br />
of Svartenhuk Halvø, central West <strong>Greenland</strong>, the origin<br />
of which is related to the opening of Baffin Bay.<br />
Ph.D. theses and Reports. <strong>The</strong> Survey fosters close<br />
cooperation with Danish universities and research institutions,<br />
and one aspect of this cooperation is the training<br />
of students by research scientists and research<br />
professors for higher degrees. Five theses on <strong>Greenland</strong>related<br />
subjects were submitted in 2000 by students<br />
based at the Survey as part of Ph.D. degrees at the<br />
Universities of Copenhagen and Aarhus. Two of these<br />
appeared in the Danmarks og Grønlands Geologiske<br />
Undersøgelse Rapport series (numbers 2000/64 and<br />
2000/82). In 2000, this open file-type series released 19<br />
reports with a <strong>Greenland</strong> geological content. Most<br />
<strong>Greenland</strong>-related reports in this series are in English<br />
but a few have Danish titles; several reports were issued<br />
with data attached in CD-ROM or diskette form.<br />
International newsletters. <strong>The</strong> two newsletters to<br />
international industry – Ghexis Newsletter and <strong>Greenland</strong><br />
MINEX News – continue to gain readership. <strong>The</strong>y are<br />
published jointly by GEUS and the Bureau of Minerals<br />
and Petroleum (BMP), Government of <strong>Greenland</strong>, and<br />
both newsletters are now available on the websites of<br />
both institutions (www.geus.dk and www.bmp.gl; see<br />
page 23 under Availability of Survey publications). In<br />
2000 there were three issues: numbers 17 and 18 of<br />
Ghexis Newsletter and number 18 of <strong>Greenland</strong> MINEX<br />
News.<br />
12
Catalogue of <strong>Greenland</strong> publications<br />
and data<br />
<strong>The</strong> front cover of the catalogue is illustrated in Fig. 1.<br />
Edited by B. Eriksen & P.R. Dawes, 58 pp. Copenhagen:<br />
Geological Survey of Denmark and <strong>Greenland</strong> (revised<br />
in September 2000).<br />
<strong>The</strong> catalogue, available free of charge (see under<br />
Availability of Survey publications p. 23), contains a<br />
complete list of the geoscientific publications on<br />
<strong>Greenland</strong> issued by both the former and present Survey<br />
organisations, going back to the first bulletin released<br />
by the Geological Survey of <strong>Greenland</strong> in 1948.<br />
Information on ‘how to order’ with prices and payment<br />
details are included. <strong>The</strong> catalogue also reviews available<br />
maps and graphic services (in addition to the geological<br />
and geophysical map coverage shown in Fig.<br />
2), including geochemical, topographic, bathymetric<br />
and satellite maps at varying scales. A data directory specifying<br />
the range of data and services available at the<br />
Survey is also included: it comprises various data bases;<br />
map, sample and drill-core archives; bibliographic and<br />
library facilities, including unpublished maps and<br />
reports from the Survey’s own activities and those of<br />
industry.<br />
<strong>The</strong> catalogue contains an index to selected topics<br />
such as Fiskenæsset anorthosite and minerals, Glaciology<br />
and hydropower, Kimberlites/diatremes, Mineralisation,<br />
Offshore geophysics, Onshore geophysics, Palaeontology<br />
and stratigraphy, Prospecting, Quaternary and permafrost,<br />
Sedimentary and petroleum geology, as well as<br />
an author/project index.<br />
Maps<br />
<strong>The</strong> national geological map sheet coverage at scales 1:500 000<br />
and 1:100 000 is shown in Fig. 2A–C; regions covered by geophysical<br />
maps are shown in Fig. 2D.<br />
Standard map sheets (printed in 2000)<br />
Geological map of <strong>Greenland</strong>, 1:500 000, Lambert Land,<br />
sheet 9. Compiled by H.F. Jepsen. Copenhagen:<br />
Geological Survey of Denmark and <strong>Greenland</strong>.<br />
Geological map of <strong>Greenland</strong>, 1:100 000, Uiffaq 69 V.1<br />
Syd. Compiled by A.K. Pedersen, F. Ulff-Møller, L.M.<br />
Larsen, G.K. Pedersen & K.S. Dueholm. Copenhagen:<br />
Geological Survey of Denmark and <strong>Greenland</strong>.<br />
Fig. 1. <strong>The</strong> front cover of Catalogue of <strong>Greenland</strong> publications<br />
and data, 58 pp. For details see the text. <strong>The</strong> catalogue can be<br />
requested free of charge.<br />
Geology of Denmark and <strong>Greenland</strong> Map<br />
Series CD<br />
This series contains previously published map sheets of the<br />
national map coverage and, where available, with accompanying<br />
descriptions. <strong>The</strong> first eight issues feature 1:500 000 map<br />
sheets; numbers 9 to 15 released in 2000 are 1:100 000 map<br />
sheets. <strong>The</strong> most recently printed 1:100 000 map sheet available<br />
on CD-ROM, Lindenow Fjord CD 15, is illustrated in Fig. 3. <strong>The</strong><br />
dates in brackets below refer to the printed editions of the original<br />
map sheets.<br />
CD 9 Grædefjord, 63 V.1 Syd. (1982)<br />
CD 10 Sinarssuk 63 V.2 Syd. (1980)<br />
CD 11 Kangiata Nuna 63 V.2 Nord. (1981)<br />
CD 12 Fiskefjord 64 V.1 Nord. (1989)<br />
CD 13 Ivisârtoq 64 V.2 Nord. (1988)<br />
CD 14 Isukasia 65 V.2 Nord. (1987)<br />
CD 15 Lindenow Fjord 60 Ø.l Nord (1998)<br />
Airborne geophysical maps<br />
<strong>The</strong> regions covered by geophysical maps are shown in Fig. 2D.<br />
<strong>South</strong>ern West <strong>Greenland</strong> 65º40′–68º20′N<br />
Sixty-two map sheets were released in 2000: two maps<br />
at scale 1:250 000 of total magnetic field intensity (colours<br />
and shadow) and first vertical derivative of magnetics,<br />
and sixty maps at 1:50 000 of total magnetic field intensity<br />
(colours and contours) and first vertical derivative<br />
of magnetics. <strong>The</strong> aeromagnetic survey leading to these<br />
13
A<br />
7<br />
8<br />
B<br />
83<br />
82<br />
81<br />
5<br />
6<br />
Geology<br />
1:500 000<br />
9<br />
10<br />
74<br />
Geology<br />
1:100 000<br />
4<br />
12<br />
11<br />
73<br />
72<br />
71<br />
70<br />
69<br />
71<br />
70<br />
3<br />
67<br />
13<br />
65<br />
64<br />
2<br />
1<br />
14<br />
In preparation<br />
Published sheets<br />
Published with<br />
descriptive text<br />
63<br />
62<br />
61<br />
60<br />
V1N V2N<br />
64<br />
V1S V2S<br />
Published sheets<br />
Published with<br />
descriptive text<br />
C<br />
D<br />
5<br />
Quaternary<br />
geology<br />
1:1 000 000<br />
1:500 000<br />
Airborne<br />
geophysics<br />
1–5:Magnetic anomaly<br />
map sheets<br />
1:500 000 (1)<br />
1:1 000 000 (2–5)<br />
4<br />
12<br />
3<br />
1<br />
3<br />
2<br />
500 km<br />
Published sheets<br />
1<br />
Published with<br />
descriptive text<br />
2<br />
1:1 000 000<br />
1:500 000<br />
14
maps (Aeromag 1999) was flown in 1999 by Sander<br />
Geophysics Ltd., Ottawa, Canada; it was financed by<br />
the Bureau of Minerals and Petroleum, Government of<br />
<strong>Greenland</strong> and managed by the Survey.<br />
CD-ROM issues<br />
In addition to the two items listed here, CD-ROMs of map sheets<br />
of the national map sheet coverage are featured under Geology<br />
of Denmark and <strong>Greenland</strong> Map Series CD above. CD-ROMs with<br />
three types of data are illustrated in Fig. 3.<br />
Mineral resource potential of <strong>South</strong> <strong>Greenland</strong>: the CD-<br />
ROM. Compiled by F. Schjøth, A.A. Garde, M.S.<br />
Jørgensen, M. Lind, E. Moberg, T.F.D. Nielsen, T.M.<br />
Rasmussen, K. Secher, A. Steenfelt, H. Stendal, L.<br />
Thorning & T. Tukiainen. <strong>The</strong> geological province<br />
in focus is the Palaeoproterozoic Ketilidian mobile<br />
belt. <strong>The</strong> CD-ROM contains geological, geochemical<br />
(stream sediments), geophysical (magnetics, electromagnetics,<br />
radiometrics, gravity), topographical,<br />
mineral occurrence, mineral exploration and remote<br />
sensing spatial datasets presented as maps or images.<br />
It is released as part of Danmarks og Grønlands<br />
Geologiske Undersøgelse Rapport 2000/57; the accompanying<br />
report is cited below under that series.<br />
West <strong>Greenland</strong> 2001 Licensing Round. Nomination<br />
2000/2001. Compiled by M. Sønderholm & C.<br />
Marcussen. Contains information on West <strong>Greenland</strong><br />
geology, including <strong>prospect</strong>ivity, play types and<br />
source rocks, as well as data types and operational<br />
conditions. Prepared by the Survey and available<br />
free of charge; also available from BMP (Bureau of<br />
Minerals and Petroleum, <strong>Greenland</strong>) and Nunaoil<br />
A/S (national oil and gas company of <strong>Greenland</strong>).<br />
Facing page<br />
Fig. 2. Geological and geophysical map sheets by the Survey<br />
(red frames) with regions covered by airborne geophysical surveys<br />
1992–1999 outlined in green. Ten sheets (1–5, 7, 8, 12–14)<br />
of the 1:500 000 geological coverage are available on CD-ROM<br />
in the Geology of Denmark and <strong>Greenland</strong> Map Series. Of the<br />
two 1:500 000 sheets yet to be published, sheet 11 is scheduled<br />
to be released in 2001. <strong>The</strong> arrow in Fig. 2B marks the Uiffaq<br />
map sheet released in 2000. Magnetic maps and data reports are<br />
available for all geophysical surveys; in addition, electromagnetic<br />
maps and data are available for the six areas with green<br />
shading.<br />
Fig. 3. Selected CD-ROMs from the year 2000: for details see the<br />
listing in the text. Front to back: Danmarks og Grønlands<br />
Geologiske Undersøgelse Rapport 2000/57, Mineral resource potential<br />
of <strong>South</strong> <strong>Greenland</strong>; Geology of Denmark and <strong>Greenland</strong><br />
Map Series CD 15, Geological map of <strong>Greenland</strong> 1:100 000; West<br />
<strong>Greenland</strong> 2001 Licensing Round, Nomination 2000/2001, available<br />
free of charge.<br />
Geology of <strong>Greenland</strong> Survey Bulletin<br />
This is a peer-reviewed series; an exception is the annual Review<br />
of <strong>Greenland</strong> activities which is edited and reviewed internally.<br />
Front covers of Bulletins 185, 186 and 188 are illustrated in Fig.<br />
4A–C.<br />
185: <strong>Greenland</strong> from Archaean to Quaternary.<br />
Descriptive text to the Geological map of<br />
<strong>Greenland</strong>, 1:2 500 000. By N. Henriksen, A.K.<br />
Higgins, F. Kalsbeek & T.C.R. Pulvertaft, 93 pp. +<br />
1 map (see below for summary).<br />
186: Review of <strong>Greenland</strong> activities 1999. Edited by P.R.<br />
Dawes & A.K. Higgins, 105 pp. (13 articles, see<br />
below for details).<br />
187: Palynology and deposition in the Wandel Sea<br />
Basin, eastern North <strong>Greenland</strong>. Edited by L.<br />
Stemmerik, 101 pp. (5 articles, see below for summary).<br />
188: <strong>The</strong> structure of the Cretaceous–Palaeogene sedimentary-volcanic<br />
area of Svartenhuk Halvø, central<br />
West <strong>Greenland</strong>. By J.G. Larsen & T.C.R.<br />
Pulvertaft, 40 pp. + 1 plate with cross-sections<br />
(see below for summary).<br />
Bulletin 185: <strong>Greenland</strong> from Archaean to<br />
Quaternary. Descriptive text to the<br />
Geological map of <strong>Greenland</strong>, 1:2 500 000<br />
<strong>Greenland</strong>’s geological development spans a period of<br />
4 Ga from the earliest Archaean to the Quaternary. An<br />
15
A<br />
B<br />
C<br />
D<br />
E<br />
Fig. 4. Selected Survey publications on <strong>Greenland</strong> from the year 2000: for details see listing in the text. A–C: Geology of <strong>Greenland</strong><br />
Survey Bulletin 185, 186 and 188; D: Danmarks og Grønlands Geologiske Undersøgelse Rapport 2000/9; E: Ghexis Newsletter No. 18,<br />
December 2000; F: <strong>Greenland</strong> MINEX News No. 18, February 2000.<br />
F<br />
overview of the geology was presented in 1995 on the<br />
Geological map of <strong>Greenland</strong> at a scale of 1:2 500 000.<br />
This bulletin provides a description of the geology<br />
of <strong>Greenland</strong>. It is divided into onshore and offshore<br />
parts and there are sections on mineral deposits and<br />
petroleum potential. It includes an extensive subject<br />
index, a place names register and a special legend<br />
explanation. <strong>The</strong> main chapters comprise descriptions<br />
of the Precambrian shield with Archaean and Proterozoic<br />
crystalline complexes, Proterozoic and Palaeozoic sedimentary<br />
basins, Palaeozoic fold belts, late Palaeozoic –<br />
Mesozoic sedimentary basins, Tertiary basalts, offshore<br />
sedimentary depocentres and the central continental<br />
ice sheet – the Inland Ice.<br />
Bulletin 186: Review of <strong>Greenland</strong><br />
activities 1999<br />
This volume contains a full-page geological map<br />
(onshore/offshore), 11 technical articles and two reviews,<br />
i.e. a directorial review – <strong>The</strong> year in focus – and a review<br />
of the publications on <strong>Greenland</strong> and surrounding<br />
regions of the North Atlantic released in 1999. <strong>The</strong> latter<br />
includes a listing of publications issued in the Survey’s<br />
16
own series and those scientific and semi-popular papers<br />
written by its staff and co-workers released in international<br />
outlets.<br />
<strong>The</strong> technical articles report on the main projects<br />
carried out in 1999, in all parts of <strong>Greenland</strong> stretching<br />
from 81ºN in the north to the southern tip at 60ºN. <strong>The</strong><br />
topics touched on range from geological mapping and<br />
stratigraphic studies of Archaean to Quaternary rocks,<br />
economic assessments of mineral and petroleum<br />
deposits, as well as an airborne geophysical survey in<br />
West <strong>Greenland</strong>. Three papers report on field work<br />
dealing with the impact of climatic change on the environment.<br />
<strong>The</strong> articles<br />
<strong>The</strong> year in focus, 1999. By K. Sørensen, 7–10.<br />
Kane Basin 1999: mapping, stratigraphic studies and economic<br />
assessment of Precambrian and Lower<br />
Palaeozoic provinces in north-western <strong>Greenland</strong>.<br />
By P.R. Dawes, T. Frisch, A.A. Garde, T.R. Iannelli,<br />
J.R. Ineson, S.M. Jensen, F. Pirajno, M. Sønderholm,<br />
L. Stemmerik, S. Stouge, B. Thomassen & J.A.M. van<br />
Gool, 11–28.<br />
Notes on the late Cenozoic history of the Washington<br />
Land area, western North <strong>Greenland</strong>. By O. Bennike,<br />
29–34.<br />
A new volcanic province: evidence from glacial erratics<br />
in western North <strong>Greenland</strong>. By P.R. Dawes, B.<br />
Thomassen & T.I.H. Andersson, 35–41.<br />
Episodic tectono-thermal activity in the southern part<br />
of the East <strong>Greenland</strong> Caledonides. By A.G. Leslie<br />
& A.P. Nutman, 42–49.<br />
Ketilidian structure and the rapakivi suite between<br />
Lindenow Fjord and Kap Farvel, <strong>South</strong>-East <strong>Greenland</strong>.<br />
By B. Chadwick, A.A. Garde, J. Grocott, K.J.W.<br />
McCaffrey & M.A. Hamilton, 50–59.<br />
Lake sediment coring in <strong>South</strong> <strong>Greenland</strong> in 1999. By<br />
O. Bennike & S. Björck, 60–64.<br />
Earth’s oldest well-preserved mafic dyke swarms in the<br />
vicinity of the Isua greenstone belt, southern West<br />
<strong>Greenland</strong>. By R.V. White, J.L. Crowley & J.S. Myers,<br />
65–72.<br />
Aeromagnetic survey in southern West <strong>Greenland</strong>: project<br />
Aeromag 1999. By T.M. Rasmussen & J.A.M. van<br />
Gool, 73–77.<br />
Subfossil insect remains (Chironomidae) and lake-water<br />
temperature inference in the Sisimiut–Kangerlussuaq<br />
region, southern West <strong>Greenland</strong>. By K.P. Brodersen<br />
& N.J. Anderson, 78–82.<br />
Coring of laminated lake sediments for pigment and mineral<br />
magnetic analyses, Søndre Strømfjord, southern<br />
West <strong>Greenland</strong>. By N.J. Anderson, A. Clarke, R.K.<br />
Juhler, S. McGowan & I. Renberg, 83–87.<br />
Petroleum geological activities in West <strong>Greenland</strong> in<br />
1999. By F.G. Christiansen, F. Dalhoff, J.A. Bojesen-<br />
Koefoed, J.A. Chalmers, G. Dam, C. Marcussen, H.<br />
Nøhr-Hansen, T. Nielsen, A.K. Pedersen, R. Riisager<br />
& M. Sønderholm 88–96.<br />
<strong>Greenland</strong> publications review with listing for 1999. By<br />
P.R. Dawes & E.W. Glendal, 97–105.<br />
Bulletin 187: Palynology and deposition in<br />
the Wandel Sea Basin, eastern North<br />
<strong>Greenland</strong><br />
<strong>The</strong> Wandel Sea Basin developed during the Late<br />
Palaeozoic to Palaeogene. Two main tectonic epochs<br />
of basin evolution are recognised: Late Palaeozoic to<br />
Early Triassic block faulting affected the entire basin<br />
whereas Mesozoic strike-slip movements affected only<br />
the northern part. This is reflected in different thermal<br />
histories and hydrocarbon potential.<br />
This bulletin contains five articles based on field and<br />
palynological studies. <strong>The</strong> tectono-stratigraphic history<br />
of the south-eastern part of the basin is discussed with<br />
implications for shelf areas: a refined, upper age constraint<br />
for the compressional tectonism has been gained<br />
from detailed study of the Palaeogene microflora. <strong>The</strong><br />
Early Carboniferous age of the oldest sediments is based<br />
on a microflora comparable to that of western Europe,<br />
whereas a Late Carboniferous algal flora shows affinities<br />
with the Sverdrup Basin flora of Arctic Canada.<br />
Bulletin 188: <strong>The</strong> structure of the<br />
Cretaceous–Palaeogene sedimentaryvolcanic<br />
area of Svartenhuk Halvø,<br />
central West <strong>Greenland</strong><br />
Svartenhuk Halvø is a peninsula lying at the northern<br />
end of the West <strong>Greenland</strong> Palaeogene volcanic<br />
province. In the down-faulted south-western part of<br />
the peninsula upper Paleocene basalts overlie Cretaceous<br />
– lower Paleocene sediments, whereas to the northwest<br />
the basalts lie directly on Precambrian basement.<br />
This bulletin describes the structural pattern in the<br />
basin area. This is dominated by NW–SE-trending extensional<br />
faults with downthrow to the north-east. Also<br />
trending NW–SE are faulted monoclinal flexure zones<br />
that were probably generated by reactivation of deep<br />
basement faults. Both the extensional fault arrays and<br />
the flexure zones are offset at approximately E–Wtrending<br />
transfer faults. <strong>The</strong> regional extension is<br />
17
elieved to be related to the opening of Baffin Bay during<br />
the late Paleocene – Eocene.<br />
Danmarks og Grønlands Geologiske<br />
Undersøgelse Rapport<br />
This open file-type series comprises unedited reports in limited<br />
numbers covering <strong>Greenland</strong>, Danish and international topics.<br />
<strong>The</strong> series includes confidential reports, some of which are<br />
released when confidentiality expires. Only unclassified numbers<br />
dealing with <strong>Greenland</strong> geological topics are included below.<br />
<strong>The</strong> front cover of Rapport 2000/9 is illustrated in Fig. 4D.<br />
2000/5: GREENMIN. Introduction and users’ manual.<br />
By L. Thorning, L.A. Christensen, M. Lind,<br />
H. Stendal & T. Tukiainen, 87 pp. (GREEN-<br />
MIN is the abbreviation for <strong>Greenland</strong><br />
Mineralisation Data Bank.)<br />
2000/9: Gold indications in northern Inglefield Land,<br />
North-West <strong>Greenland</strong>: a preliminary report<br />
from project Kane Basin 1999. By B. Thomassen,<br />
P.R. Dawes, T.R. Iannelli & F. Pirajno,<br />
14 pp.<br />
2000/13: Indledende lokalisering af grønlandske<br />
gletschere med is/vand egnet til export. By<br />
C.E. Bøggild, A. Weidick & O.B. Olesen, 30<br />
pp. (Danish version of Rapport 2000/73.)<br />
2000/26: Sammenstilling af sedimentologiske og biostratigrafiske<br />
data fra Nuussuaq Bassinet,<br />
Vestgrønland. By G. Dam, 37 pp. + app.<br />
2000/29: <strong>Greenland</strong> and the Danish sector – Well data<br />
and geophysical data. Prices and sales conditions.<br />
14 pp.<br />
2000/31: Well data summary sheets. Volume 35,<br />
released wells from West <strong>Greenland</strong>. 63 pp.<br />
2000/50: Mineral resource potential of <strong>South</strong> <strong>Greenland</strong>:<br />
review of new digital data sets. By A.<br />
Steenfelt, T.F.D. Nielsen & H. Stendal, 47 pp.<br />
2000/56: Cretaceous–Paleocene depositional evolution<br />
of the Nuussuaq Basin, West <strong>Greenland</strong>.<br />
Field trip guide prepared for TGS-NOPEC,<br />
Nuussuaq–Disko, 19–26 July 2000. By G.<br />
Dam, 21 pp. + app.<br />
2000/57: Mineral resource potential of <strong>South</strong> <strong>Greenland</strong>:<br />
the CD-ROM. By F. Schjøth, A.A. Garde,<br />
M.S. Jørgensen, M. Lind, E. Moberg, T.F.D.<br />
Nielsen, T.M. Rasmussen, K. Secher, A. Steenfelt,<br />
H. Stendal, L. Thorning & T. Tukiainen,<br />
36 pp. + CD-ROM. (See also above under<br />
CD-ROM issues.)<br />
2000/60: Bjergkædedannelse i den sydlige del af det<br />
kaledoniske foldebælte i Østgrønland – et<br />
studie af præorogene basementkomplekser,<br />
overliggende sedimentbassiner, synorogene<br />
deformationer og overskydninger samt synsenorogene<br />
kaledoniske granitintrusioner.<br />
By N. Henriksen, 148 pp.<br />
2000/64: Geochronology of the pre-Caledonian basement<br />
in East <strong>Greenland</strong> 72º–75ºN. By K.<br />
Thrane, 196 pp. (Cited below under Ph.D.<br />
theses.)<br />
2000/67: Undersøgelse af bakterielle kimtal i Grønlands<br />
indlandsis. By C.S. Jacobsen, 10 pp.<br />
2000/72: Sen palæozoisk palæoklima og palæogeografi<br />
i det nordatlantiske område. Statusrapport.<br />
By L. Stemmerik, 8 pp.<br />
2000/73: Preliminary localization of <strong>Greenland</strong>ic glaciers<br />
with ice/water suitable for export. By C.E.<br />
Bøggild, A. Weidick & O.B. Olesen, 28 pp.<br />
(English version of Rapport 2000/13.)<br />
2000/77: Amdrup Fjord, <strong>South</strong>-East <strong>Greenland</strong>: reconnaissance<br />
for noble metals. By B. Thomassen,<br />
10 pp.<br />
2000/82: Inversion of airborne transient electromagnetic<br />
data. By L.H. Poulsen, 143 pp. (Cited<br />
below under Ph.D. theses.)<br />
2000/83: Qulleq-1 (6354/4-1): petroleum geochemistry.<br />
Service report prepared for Statoil a.s.<br />
By J.A. Bojesen-Koefoed, H.P. Nytoft & P.<br />
Rosenberg, 35 pp.<br />
2000/88: Tectonic architecture of the East <strong>Greenland</strong><br />
Caledonides 72º–74º30′N. By S. Elvevold,<br />
J.C. Escher, K.S. Frederiksen, J.D. Friderichsen,<br />
J.A. Gilotti, N. Henriksen, A.K. Higgins,<br />
H.F. Jepsen, K.A. Jones, F. Kalsbeek, P.D.<br />
Kinny, A.G. Leslie, S. Robertson, M.P. Smith,<br />
K. Thrane, & G.R. Watt, 34 pp.<br />
2000/100: Economic investigations in Inglefield Land,<br />
North-West <strong>Greenland</strong>: part of the project<br />
Kane Basin 1999. By B. Thomassen, F. Pirajno,<br />
T.R. Iannelli, P.R. Dawes & S.M. Jensen, 98<br />
pp. + 2 maps, 1 diskette with Tables 1–6.<br />
2000/101: Biostratigraphy of well 6354/4-1 (Qulleq-1),<br />
West <strong>Greenland</strong>. By H. Nøhr-Hansen, S. Piasecki,<br />
J.A. Rasmussen & E. Sheldon, 81 pp.<br />
2000/104: Assessing and monitoring the environmental<br />
impact of mining activities in Europe<br />
using advanced Earth Observation techniques.<br />
By T. Tukiainen, 24 pp. (Includes<br />
work in East <strong>Greenland</strong>.)<br />
18
Ph.D. theses<br />
In 2000 Ph.D. theses were produced both as reports in the<br />
Danmarks og Grønlands Geologiske Undersøgelse Rapport series<br />
and as unnumbered volumes.<br />
Frederiksen, K.S. 2000: A Neoproterozoic carbonate<br />
ramp and base-of-slope succession, the Andrée Land<br />
Group, Eleonore Bay Supergroup, North-East<br />
<strong>Greenland</strong>: sedimentary facies, stratigraphy and basin<br />
evolution, 242 pp. University of Copenhagen and<br />
Geological Survey of Denmark and <strong>Greenland</strong>,<br />
Copenhagen, Denmark. <strong>The</strong>sis for Ph.D. degree<br />
from the University of Copenhagen.<br />
Kragh, K. 2000: <strong>The</strong> Citronen Fjord sedimentary exhalative<br />
sulphide deposit, North <strong>Greenland</strong>. A study of<br />
primary and diagenetic textures, oxygen and carbon<br />
isotopes, and fluid inclusions, 277 pp. Geological<br />
Survey of Denmark and <strong>Greenland</strong>, Copenhagen, Denmark.<br />
<strong>The</strong>sis for Ph.D. degree from Aarhus University.<br />
Poulsen, L.H. 2000: Inversion of airborne transient electromagnetic<br />
data. Danmarks og Grønlands Geologiske<br />
Undersøgelse Rapport 2000/82, 143 pp. <strong>The</strong>sis for<br />
Ph.D. degree from Aarhus University.<br />
<strong>The</strong>rkelsen, J. 2000: Petrographic and diagenetic studies<br />
on Triassic and Jurassic sandstones in the Traill<br />
Ø region, East <strong>Greenland</strong>, 188 pp. University of<br />
Copenhagen and Geological Survey of Denmark<br />
and <strong>Greenland</strong>, Copenhagen, Denmark. <strong>The</strong>sis for<br />
Ph.D. degree from the University of Copenhagen.<br />
Thrane, K. 2000: Geochronology of the pre-Caledonian<br />
basement in East <strong>Greenland</strong> 72º–75ºN. Danmarks<br />
og Grønlands Geologiske Undersøgelse Rapport<br />
2000/64, 196 pp. <strong>The</strong>sis for Ph.D. degree from the<br />
University of Copenhagen.<br />
Ghexis Newsletter<br />
<strong>Greenland</strong> hydrocarbon exploration information service. Page 1<br />
of issue No. 18 is illustrated in Fig. 4E.<br />
Issue No. 17, April 2000, 8 pp.<br />
Selected titles:<br />
<strong>The</strong> first well offshore West <strong>Greenland</strong> in the new<br />
millennium.<br />
New seismic data acquisition in the Nuussuaq Basin<br />
during summer 2000.<br />
East <strong>Greenland</strong> – analogues for the future.<br />
Upper Palaeozoic carbonates in northern <strong>Greenland</strong><br />
– an analogue to the Barents Sea sucession.<br />
Lower Cretaceous fault-crest sandstones, Hold with<br />
Hope – an overlooked play offshore Norway?<br />
Issue No. 18, December 2000, 8 pp.<br />
Selected titles:<br />
Qulleq-1 and the media: myths and facts about the<br />
Fylla exploration well.<br />
Invitation to nominate blocks on the West <strong>Greenland</strong><br />
continental shelf announced.<br />
Seismic acquisition during summer 2000 – the<br />
Canadian connection.<br />
Environmental oil spill sensitivity atlas for <strong>South</strong>-<br />
West <strong>Greenland</strong>.<br />
<strong>Greenland</strong> MINEX News<br />
<strong>Greenland</strong> mineral exploration newsletter. Page 1 of issue No.<br />
18 is illustrated in Fig. 4F.<br />
Issue No. 18, February 2000, 8 pp.<br />
Leading article: Exploration commitments for 2000<br />
reduced by 50%.<br />
Selected titles:<br />
Commercial exploration round-up: 2000 update.<br />
Airborne geophysical survey in 1999: Project Aeromag<br />
1999.<br />
High-resolution hyperspectral image data from West<br />
and East <strong>Greenland</strong>.<br />
Palladium potential of Skærgaard: economically<br />
viable?<br />
Scientific publications on <strong>Greenland</strong><br />
and adjoining regions in external<br />
outlets<br />
Included here are authored articles as well as edited and compiled<br />
volumes by Survey staff. <strong>The</strong> articles are of four types: (1)<br />
from peer-reviewed international journals, (2) from invited special<br />
thematic volumes, (3) from conference proceedings, and (4)<br />
from other international series. Articles written by staff of the<br />
Danish Lithosphere Centre, Copenhagen (administratively attached<br />
to the Survey), as well as non-survey staff where the basic work<br />
was initiated under the Survey’s auspices, are included.<br />
Edited and compiled volumes<br />
Chalmers, J.A. & Cloetingh, S. (eds) 2000: Neogene<br />
uplift and tectonics around the North Atlantic. Global<br />
and Planetary Change 24(3–4), 164–318.<br />
19
Stemmerik, L. & Trappe, J. (eds) 2000: Pangea: the Late<br />
Carboniferous to Late Triassic interval. Palaeogeography,<br />
Palaeoclimatology, Palaeoecology 161(1–2),<br />
293 pp.<br />
Stendal, H. (compiler) 2000: Exploration in <strong>Greenland</strong>:<br />
discoveries of the 1990s. Transactions of the Institution<br />
of Mining and Metallurgy, section B, Applied<br />
earth science 109(January–April), 66 pp.<br />
Authored articles<br />
Appel, P.W.U. 2000: Gahnite in the ~3.75 Ga Isua<br />
Greenstone Belt, West <strong>Greenland</strong>. Mineralogical<br />
Magazine 64(1), 121–124.<br />
Appel, P.W.U., Bliss, I.C., Coller, D.W., Grahl-Madsen,<br />
L. & Petersen, J.S. 2000: Recent <strong>gold</strong> discoveries in<br />
Archaean rocks of central West <strong>Greenland</strong>. In:<br />
Stendal, H. (compiler): Exploration in <strong>Greenland</strong>:<br />
discoveries of the 1990s. Transactions of the Institution<br />
of Mining and Metallurgy, section B, Applied earth<br />
science 109(January–April), B34–B41.<br />
Bennike, O. 2000: Palaeoecological studies of Holocene<br />
lake sediments from west <strong>Greenland</strong>. Palaeogeography,<br />
Palaeoclimatology, Palaeoecology 155(3–4),<br />
285–304.<br />
Bennike, O. & Jepsen, H.F. 2000: A new interglacial<br />
sequence from Washington Land, northern <strong>Greenland</strong>.<br />
Polar Record 19(2), 267–270.<br />
Bennike, O., Björck, S., Böcher, J. & Walker, I.R. 2000:<br />
<strong>The</strong> Quaternary arthropod fauna of <strong>Greenland</strong>: a<br />
review with new data. Bulletin of the Geological<br />
Society of Denmark 47(2), 111–134.<br />
Bernstein, S. & Bird, D.K. 2000: Formation of wehrlites<br />
through dehydration of metabasalt xenoliths in<br />
layered gabbros of the Noe-Nygaard intrusion,<br />
SE <strong>Greenland</strong>. Geological Magazine 137(2), 109–<br />
128.<br />
Bernstein, S., Leslie, A.G., Higgins, A.K. & Brooks, C.K.<br />
2000: Tertiary alkaline volcanics of the Nunatak<br />
Region, Northeast <strong>Greenland</strong>: new observations and<br />
comparison with Siberian maymechites. Lithos 53(1),<br />
1–20.<br />
Breddam, K., Kurz, M.D. & Storey, M. 2000: Mapping<br />
out the conduit of the Iceland mantle plume with<br />
helium isotopes. Earth and Planetary Science Letters<br />
176(1), 45–55.<br />
Chalmers, J.A. 2000: Offshore evidence for Neogene<br />
uplift in central West <strong>Greenland</strong>. In: Chalmers, J.A.<br />
& Cloetingh, S. (eds): Neogene uplift and tectonics<br />
around the North Atlantic. Global and Planetary<br />
Change 24(3–4), 311–318.<br />
Chalmers, J.A., Hamann, N.E., Sønderholm, M. & Olsen,<br />
J.C. 2000: West <strong>Greenland</strong> offshore geology, seeps<br />
resemble North Sea <strong>prospect</strong>s. Offshore 60(10), p.<br />
56 (cont.), p. 58 (cont.), p. 128.<br />
Connelly, J.N. & Mengel, F.C. 2000: Evolution of Archean<br />
components in the Paleoproterozoic Nagssugtoqidian<br />
Orogen, West <strong>Greenland</strong>. Geological Society of<br />
America Bulletin 112(5), 747–763.<br />
Connelly, J.N., van Gool, J.A.M. & Mengel, F.C. 2000:<br />
Temporal evolution of a deeply eroded orogen: the<br />
Nagssugtoqidian Orogen, West <strong>Greenland</strong>. Canadian<br />
Journal of Earth Sciences 37(8), 1121–1142.<br />
Dam, G., Nøhr-Hansen, H., Pedersen, G.K. & Sønderholm,<br />
M. 2000: Sedimentary structural evidence of<br />
a new early Campanian rift phase in the Nuussuaq<br />
Basin, West <strong>Greenland</strong>. Cretaceous Research 21(1),<br />
127–154.<br />
Elvevold, S. & Gilotti, J.A. 2000: Pressure–temperature<br />
evolution of retrogressed kyanite eclogites, Weinschenk<br />
Island, North-East <strong>Greenland</strong> Caledonides.<br />
Lithos 53(2), 127–147.<br />
Fitton, J.G., Larsen, L.M., Saunders, A.D., Hardarson,<br />
B.S. & Kempton, P.D. 2000: Palaeogene continental<br />
to oceanic magmatism on the SE <strong>Greenland</strong> continental<br />
margin at 63ºN: a review of the results of<br />
Ocean Drilling Program legs 152 and 163. Journal<br />
of Petrology 41(7), 951–966.<br />
Frederiksen, K.S. 2000: Evolution of a Late Proterozoic<br />
carbonate ramp (Ymer Ø and Andrée Land Groups,<br />
Eleonore Bay Supergroup, East <strong>Greenland</strong>): response<br />
to relative sea-level rise. In: Roland, N.W. & Tessensohn,<br />
F. (eds): ICAM III. Third international conference<br />
on Arctic margins. Polarforschung 68, 125–130.<br />
Funck, T., Louden, K.E. & Reid, I.D. 2000: Wide-angle<br />
seismic imaging of a Mesoproterozoic anorthosite<br />
complex: the Nain Plutonic Suite in Labrador, Canada.<br />
Journal of Geophysical Research 105(B11), 25,693–<br />
25,707.<br />
Funck, T., Louden, K.E., Wardle, R.J., Hobro, J.W.,<br />
Salisbury, M.H. & Muzzatti, A. 2000: Three-dimensional<br />
structure of the Torngat Orogen (NE Canada)<br />
from active seismic tomography. Journal of Geophysical<br />
Research 105(B10), 23,403–23,420.<br />
Garde, A.A., Friend, C.R.L., Nutman, A.P. & Marker, M.<br />
2000: Rapid maturation and stabilisation of middle<br />
Archaean continental crust: the Akia terrane, southern<br />
West <strong>Greenland</strong>. Bulletin of the Geological<br />
Society of Denmark 47(1), 1–27.<br />
Grocott, J., Garde A.A., Chadwick, B., Cruden, A.R. &<br />
Swager C.[P.] 2000: Reply to Hutton, D.H.W. & Brown,<br />
P.E. 2000: Discussion on emplacement of rapakivi<br />
20
granite and syenite by floor depression and roof<br />
uplift in the Palaeoproterozoic Ketilidian orogen,<br />
<strong>South</strong> <strong>Greenland</strong>. Journal of the Geological Society<br />
(London) 157(3), 703–704.<br />
Hald, N. & Tegner, C. 2000: Composition and age of<br />
Tertiary sills and dykes, Jameson Land Basin, East<br />
<strong>Greenland</strong>: relation to regional flood volcanism.<br />
Lithos 54(3–4), 207–233.<br />
Hansen, H. & Grönvold, K. 2000: Plagioclase ultraphyric<br />
basalts in Iceland: the mush of the rift. Journal of<br />
Volcanology and Geothermal Research 98(1–4),<br />
1–32.<br />
Henriksen, N. & Higgins, A.K. 2000: Early Palaeozoic<br />
basin development of North <strong>Greenland</strong> – part of<br />
the Franklinian Basin. In: Roland, N.W. & Tessensohn,<br />
F. (eds): ICAM III. Third international conference<br />
on Arctic margins. Polarforschung 68, 131–140.<br />
Hieronymus, C.F. & Bercovici, D. 2000: Non-hotspot<br />
formation of volcanic chains: control of tectonic and<br />
flexural stresses on magma transport. Earth and<br />
Planetary Science Letters 181(4), 539–554.<br />
Higgins, A.K. & Leslie, A.G. 2000: Restoring thrusting<br />
in the East <strong>Greenland</strong> Caledonides. Geology 28(11),<br />
1019–1022.<br />
Higgins, A.K., Soper, N.J. & Leslie, A.G. 2000: <strong>The</strong><br />
Ellesmerian and Caledonian orogenic belts of<br />
<strong>Greenland</strong>. In: Roland, N.W. & Tessensohn, F. (eds):<br />
ICAM III. Third international conference on Arctic<br />
margins. Polarforschung 68, 141–151.<br />
Ineson, J.R. & Surlyk, F. 2000: Carbonate megabreccias<br />
in a sequence stratigraphic context: evidence from<br />
the Cambrian of North <strong>Greenland</strong>. In: Hunt, D. &<br />
Gawthorpe, R.L. (eds): Sedimentary responses to<br />
forced regressions. Geological Society Special<br />
Publication (London) 172, 47–68.<br />
Japsen, P. & Chalmers, J.A. 2000: Neogene uplift and<br />
tectonics around the North Atlantic: overview. In:<br />
Chalmers, J.A. & Cloetingh, S. (eds): Neogene uplift<br />
and tectonics around the North Atlantic. Global and<br />
Planetary Change 24(3–4), 165–173.<br />
Jepsen, H.F. & Kalsbeek, F. 2000: Precambrian evolution<br />
of North and North-East <strong>Greenland</strong>: crystalline<br />
basement and sedimentary basins. In: Roland, N.W.<br />
& Tessensohn, F. (eds): ICAM III. Third international<br />
conference on Arctic margins. Polarforschung 68,<br />
153–160.<br />
Kalsbeek, F., Thrane, K., Nutman, A.P. & Jepsen, H.F.<br />
2000: Late Mesoproterozoic to early Neoproterozoic<br />
history of the East <strong>Greenland</strong> Caledonides: evidence<br />
for Grenvillian orogenesis? Journal of the Geological<br />
Society (London) 157(6), 1215–1225.<br />
Korenaga, J., Holbrook, W.S., Kent, G.M., Kelemen,<br />
P.B., Detrick, R.S., Larsen, H.C., Hopper, J.R. & Dahl-<br />
Jensen, T. 2000: Crustal structure of the <strong>South</strong>east<br />
<strong>Greenland</strong> margin from joint refraction and reflection<br />
seismic tomography. Journal of Geophysical<br />
Research 105(B9), 21,591–21,614.<br />
Larsen, L.M. & Pedersen, A.K. 2000: Processes in high-<br />
Mg, high-T magmas: evidence from olivine, chromite<br />
and glass in Palaeogene picrites from West <strong>Greenland</strong>.<br />
Journal of Petrology 41(7), 1071–1098.<br />
Linthout, K., Troelstra, S.R. & Kuijpers, A. 2000:<br />
Provenance of coarse ice-rafted detritus near the SE<br />
<strong>Greenland</strong> margin. Geologie en Mijnbouw 79(1),<br />
109–121.<br />
Mathiesen, A., Bidstrup, T. & Christiansen, F.G. 2000:<br />
Denudation and uplift history of the Jameson Land<br />
basin, East <strong>Greenland</strong> – constrained from maturity<br />
and apatite fission track data. In: Chalmers J.A. &<br />
Cloetingh, S. (eds): Neogene uplift and tectonics<br />
around the North Atlantic. Global and Planetary<br />
Change 24(3–4), 275–301.<br />
Mitchell, R.H., Scott-Smith, B.H. & Larsen, L.M. 2000:<br />
Mineralogy of ultramafic dikes from Sarfatoq, Sisimiut<br />
and Maniitsoq areas, West <strong>Greenland</strong>. In: Gurney,<br />
J.J. et al. (eds) Proceedings of the VIIth International<br />
Kimberlite Conference 2, 574–583. Cape Town: Red<br />
Roof Designs.<br />
Mueller, W.U., Garde, A.A. & Stendal, H. 2000: Shallowwater,<br />
eruption-fed, mafic pyroclastic deposits along<br />
a Paleoproterozoic coastline: Kangerluluk volcanosedimentary<br />
sequence, southeast <strong>Greenland</strong>. In:<br />
Mueller, W.U., Chown, E.H. & Thurston, P.C. (eds):<br />
Processes in physical volcanology and volcaniclastic<br />
sedimentation: modern and ancient. Precambrian<br />
Research 101(2–4), 163–192.<br />
Nøhr-Hansen, H. & Sheldon, E. 2000: Palyno- and nannostratigraphic<br />
dating of the marine Paleocene succession<br />
in the Nuussuaq Basin, West <strong>Greenland</strong>. In:<br />
Schmitz, B., Sundquist, B. & Andreasson, F.P. (eds):<br />
Early Paleogene warm climates and biosphere<br />
dynamics. GFF 122(1), 115–116. Stockholm:<br />
Geological Society of Sweden.<br />
Nytoft, H.P., Bojesen-Koefoed, J.A. & Christiansen, F.G.<br />
2000: C 26 and C 28 -C 34 28-norhopanes in sediments<br />
and petroleum. Organic Geochemistry 31(1), 25–39.<br />
Pedersen, M. 2000: Lead isotope signatures of sedimentary<br />
rocks as a tool for tracing ore lead sources:<br />
a study of base-metal and barite occurrences in<br />
Jameson Land Basin, central East <strong>Greenland</strong>. In:<br />
Stendal, H. (compiler): Exploration in <strong>Greenland</strong>:<br />
discoveries of the 1990s. Transactions of the Institut-<br />
21
ion of Mining and Metallurgy, section B, Applied earth<br />
science 109(January–April), B1–B5.<br />
Pedersen, M. & Stendal, H. 2000: Mineral occurrences<br />
in central East and North-East <strong>Greenland</strong> – new possibilities?<br />
In: Stendal, H. (compiler): Exploration in<br />
<strong>Greenland</strong>: discoveries of the 1990s. Transactions of<br />
the Institution of Mining and Metallurgy, section B,<br />
Applied earth science 109(January–April), B42–B48.<br />
Pirajno, F., Thomassen, B., Iannelli, T.R. & Dawes, P.R.<br />
2000: Copper-<strong>gold</strong> mineralization in Inglefield Land,<br />
NW <strong>Greenland</strong>. International Liaison Group on <strong>gold</strong><br />
mineralization Newsletter 30, 49–54.<br />
Reeh, N., Mayer, C., Olesen, O.B., Christensen, E.L. &<br />
Thomsen, H.H. 2000: Tidal movements of Nioghalvfjerdsfjorden<br />
glacier, Northeast <strong>Greenland</strong>: observations<br />
and modelling. Annals of Glaciology 31(3),<br />
111–117.<br />
Riisager, P. & Abrahamsen, N. 2000: Palaeointensity of<br />
West <strong>Greenland</strong> Palaeocene basalts: asymmetric<br />
intensity around C27n-C26r transition. Physics of the<br />
Earth and Planetary Interior 118(1–2), 53–64.<br />
Skaarup, N., Chalmers, J.A. & White, D. 2000: An AVO<br />
study of a possible new hydrocarbon play, offshore<br />
central West <strong>Greenland</strong>. AAPG Bulletin 84(2),<br />
174–182. Tulsa: American Association of Petroleum<br />
Geologists.<br />
Steenfelt, A. 2000: Geochemical signatures of <strong>gold</strong><br />
provinces in <strong>South</strong> <strong>Greenland</strong>. In: Stendal, H. (compiler):<br />
Exploration in <strong>Greenland</strong>: discoveries of the<br />
1990s. Transactions of the Institution of Mining and<br />
Metallurgy, section B, Applied earth science<br />
109(January–April), B14–B22.<br />
Stemmerik, L. 2000: Late Palaeozoic evolution of the<br />
North Atlantic margin of Pangea. In: Stemmerik, L.<br />
& Trappe, J. (eds): Pangea: the Late Carboniferous<br />
to Late Triassic interval. Palaeogeography, Palaeoclimatology,<br />
Palaeoecology 161(1–2), 95–126.<br />
Stemmerik, L. & Worsley, D. 2000: Upper Carboniferous<br />
cyclic shelf deposits, Kapp Kåre Formation, Bjørnøya,<br />
Svalbard: response to high frequency, high amplitude<br />
sea level fluctuations and local tectonism. Polar<br />
Research 19(2), 227–249.<br />
Stendal, H. & Frei, R. 2000: Gold occurrences and lead<br />
isotopes in Ketilidian Mobile Belt, <strong>South</strong> <strong>Greenland</strong>.<br />
In: Stendal, H. (compiler): Exploration in <strong>Greenland</strong>:<br />
discoveries of the 1990s. Transactions of the<br />
Institution of Mining and Metallurgy, section B,<br />
Applied earth science 109(January–April), B6–B13.<br />
Stendal, H. & Grahl-Madsen, L. 2000: Geochemical<br />
investigation over a <strong>gold</strong> <strong>prospect</strong>, Niaqornaarsuk<br />
peninsula, <strong>South</strong> <strong>Greenland</strong>. In: Stendal, H. (compiler):<br />
Exploration in <strong>Greenland</strong>: discoveries of the<br />
1990s. Transactions of the Institution of Mining and<br />
Metallurgy, section B, Applied earth science<br />
109(January–April), B60–B66.<br />
Stendal, H. & Schønwandt, H.K. 2000: Mineral exploration<br />
in <strong>Greenland</strong> in the 1990s. In: Stendal, H.<br />
(compiler): Exploration in <strong>Greenland</strong>: discoveries<br />
of the 1990s. Transactions of the Institution of Mining<br />
and Metallurgy, section B, Applied earth science<br />
109(January–April), B1–B5.<br />
Vosgerau, H., Bojesen-Koefoed, J.A., Petersen, H.I. &<br />
Surlyk, F. 2000: Forest fires, climate, and sea-level<br />
changes in a coastal plain – shallow marine succession<br />
(Early–Middle Oxfordian Jakobsstigen<br />
Formation, North-East <strong>Greenland</strong>). Journal of<br />
Sedimentary Research 70(2), 408–418.<br />
Watt, G.R., Kinny, P.D. & Friderichsen, J.D. 2000: U–Pb<br />
geochronology of Neoproterozoic and Caledonian<br />
tectonothermal events in the East <strong>Greenland</strong><br />
Caledonides. Journal of the Geological Society<br />
(London) 157(5), 1031–1048.<br />
Semi-popular articles<br />
Articles are from the Survey’s own series, as well as other outlets<br />
in Denmark and elsewhere.<br />
Appel, P.W.U. 2000: Minturn cirkels: een recent ontdekt<br />
glaciaal fenomeen. Gea 35 (4), 24–27. Purmerend,<br />
Netherlands: Stichting Geologische Aktiviteiten.<br />
Appel, P.W.U. & Touret, J.L.R. 2000: De oudste gesteenten<br />
op Aarde. Gea 33(1), 1–6. Purmerend,<br />
Netherlands: Stichting Geologische Aktiviteiten.<br />
Henriksen, N. 2000: Geologisk oversigt. In: Jakobsen,<br />
B.H. et al. (eds): Topografisk atlas Grønland. Atlas<br />
over Danmark Serie II 6, 18–21. København, Danmark:<br />
Det Kongelige Danske Geografiske Selskab /<br />
Kort & Matrikelstyrelsen.<br />
Secher, K. 2000: Kobberminen Innatsiaq – ‘Josvas Mine’<br />
i Sydgrønland, minedrift før 1. Verdenskrig. In:<br />
Jakobsen, B.H. et al. (eds): Topografisk atlas Grønland.<br />
Atlas over Danmark Serie II 6, 222–223.<br />
København, Danmark: Det Kongelige Danske Geografiske<br />
Selskab / Kort & Matrikelstyrelsen.<br />
Secher, K. & Burchardt, J. 2000: Ingeniør M. Ib Nyeboe<br />
– Industripionér i Grønlands undergrund. Grønland<br />
2000(6–7), 245–276. Charlottenlund, Danmark: Det<br />
Grønlandske Selskab.<br />
Secher, K. & Burchardt, J. 2000: Modern mining technology<br />
100 years ago – a look at a pioneer mining<br />
22
operation in southern <strong>Greenland</strong>. In: This is <strong>Greenland</strong><br />
2000–2001, 156–161. Copenhagen: Government<br />
of <strong>Greenland</strong> / Royal Danish Ministry of Foreign<br />
Affairs.<br />
Secher, K. & Olsen, H.K. 2000: Mineralske råstoffer. In:<br />
Jakobsen, B.H. et al. (eds): Topografisk atlas Grønland.<br />
Atlas over Danmark Serie II 6, 22–25. København,<br />
Danmark: Det Kongelige Danske Geografiske<br />
Selskab / Kort & Matrikelstyrelsen.<br />
Secher, K. & Petersen, O.V. 2000: En rigdom af enestående<br />
mineraler. In: Jakobsen, B.H. et al. (eds):<br />
Topografisk atlas Grønland. Atlas over Danmark<br />
Serie II 6, 124–125. København, Danmark: Det<br />
Kongelige Danske Geografiske Selskab / Kort &<br />
Matrikelstyrelsen.<br />
Steenfelt, A. & Thorning, L. 2000: Mineralefterforskning<br />
i en digital verden. GEUS Årsberetning for 1999,<br />
51–65. København, Danmark: Danmarks og Grønlands<br />
Geologiske Undersøgelse.<br />
Stemmerik, L., Larsen, M. & Piasecki, S. 2000: De østgrønlandske<br />
sedimentbassiner – et oliegeologisk<br />
feltlaboratorium. Geologi – Nyt fra GEUS 2000(1),<br />
20 pp. København: Danmarks og Grønlands Geologiske<br />
Undersøgelse.<br />
Thomassen, B. 2000: Blyminen ved Mesters Vig. In:<br />
Jakobsen, B.H. et al. (eds): Topografisk atlas Grønland.<br />
Atlas over Danmark Serie II 6, 230–231.<br />
København, Danmark: Det Kongelige Danske Geografiske<br />
Selskab / Kort & Matrikelstyrelsen.<br />
Thomsen, H.H. 2000: ‘De blå floders land’. In: Jakobsen,<br />
B.H. et al. (eds): Topografisk atlas Grønland. Atlas<br />
over Danmark Serie II 6, 100–101. København, Danmark:<br />
Det Kongelige Danske Geografiske Selskab /<br />
Kort & Matrikelstyrelsen.<br />
Thomsen, H.H. 2000: Nioghalvfjerdsfjorden – her spiser<br />
havet af Indlandsisen. In: Jakobsen, B.H. et al. (eds):<br />
Topografisk atlas Grønland. Atlas over Danmark<br />
Serie II 6, 116–117. København, Danmark: Det<br />
Kongelige Danske Geografiske Selskab / Kort &<br />
Matrikelstyrelsen.<br />
Weidick, A. 2000: Det Østgrønlandske højland og dets<br />
isdækker. In: Jakobsen, B.H. et al. (eds): Topografisk<br />
atlas Grønland. Atlas over Danmark Serie II 6, 84–87.<br />
København, Danmark: Det Kongelige Danske<br />
Geografiske Selskab / Kort & Matrikelstyrelsen.<br />
Weidick, A. 2000: Jakobshavn Isbræ – Grønlands største<br />
kalvisproducent. In: Jakobsen, B.H. et al. (eds):<br />
Topografisk atlas Grønland. Atlas over Danmark<br />
Serie II 6, 112–115. København, Danmark: Det<br />
Kongelige Danske Geografiske Selskab / Kort &<br />
Matrikelstyrelsen.<br />
Availability of Survey publications<br />
Survey publications can be obtained by contacting the<br />
Survey’s headquarters in Copenhagen or the Survey’s<br />
book agent, Geografforlaget ApS, at the addresses given<br />
on page 2 of this volume. Of the publications listed in<br />
this review, the newsletters to the international mining<br />
and oil industries, i.e. Ghexis Newsletter and <strong>Greenland</strong><br />
MINEX News, respectively, the Catalogue of <strong>Greenland</strong><br />
publications and data described above, as well as the<br />
CD-ROM <strong>The</strong> West <strong>Greenland</strong> 2001 Licensing Round (see<br />
above under CD-ROM issues), can be requested from<br />
the Survey free of charge.<br />
All Survey publications can be viewed at GEUS headquarters<br />
in Copenhagen, Denmark; publications on<br />
<strong>Greenland</strong> are also available at the Bureau of Minerals<br />
and Petroleum (BMP) in Nuuk, <strong>Greenland</strong>. Information<br />
on publications and data from <strong>Greenland</strong> can be found<br />
on the Survey’s website (www.geus.dk) as well as that<br />
of BMP (www.bmp.gl). Several publication series are<br />
available on the website, for example the annual Review<br />
of <strong>Greenland</strong> activities (this volume), as are the abstracts<br />
of volumes in the scientific series Geology of <strong>Greenland</strong><br />
Survey Bulletin, as well as the two newsletters Ghexis<br />
Newsletter and <strong>Greenland</strong> MINEX News. For details of<br />
all Survey publications on <strong>Greenland</strong>, see the printed<br />
Catalogue of <strong>Greenland</strong> publications and data (Fig. 1).<br />
Author’s address<br />
Geological Survey of Denmark and <strong>Greenland</strong>, Thoravej 8, DK-2400 Copenhagen NV, Denmark. E-mail: prd@geus.dk<br />
23
Petroleum geological activities in West <strong>Greenland</strong> in 2000<br />
Flemming G. Christiansen, Jørgen A. Bojesen-Koefoed, James A. Chalmers, Finn Dalhoff,<br />
Anders Mathiesen, Martin Sønderholm, Gregers Dam, Ulrik Gregersen, Christian Marcussen,<br />
Henrik Nøhr-Hansen, Stefan Piasecki,Thomas Preuss,T. Christopher R. Pulvertaft,<br />
Jan Audun Rasmussen and Emma Sheldon<br />
<strong>The</strong> summer of 2000 was exciting for everyone interested<br />
in the petroleum geology and exploration of West<br />
<strong>Greenland</strong>. <strong>The</strong> first offshore well in more than 20 years<br />
was drilled by the Statoil group in the Fylla licence<br />
area, and seismic acquisition activity offshore West<br />
<strong>Greenland</strong> was more intense than previous years with<br />
four new surveys being carried out (Fig. 1).<br />
Expectations were high when drilling of the Qulleq-1<br />
well was initiated in July 2000, not only with the licensees<br />
and the authorities, but also with the public. <strong>The</strong> well<br />
was classified as highly confidential, but nevertheless<br />
all information available was closely followed by the<br />
press, especially in <strong>Greenland</strong> and Denmark, but also<br />
internationally (see Ghexis 2000). Disappointment was<br />
equally high when the press release in September 2000<br />
reported that the well was dry. Since that time much<br />
technical work has been carried out by Statoil and its<br />
consultants (Pegrum et al. 2001) and by the Geological<br />
Survey of Denmark and <strong>Greenland</strong> (GEUS), and a more<br />
balanced view of the positive and negative surprises from<br />
the well can now be presented.<br />
When the licence was granted in December 1996, the<br />
Fylla licence area consisted of two sub-areas totalling<br />
9487 km 2 . Recently the Statoil group relinquished the<br />
eastern sub-area, which covers 2645 km 2 , after having<br />
fulfilled their exploration obligations (Fig. 1). As a consequence,<br />
all data within the eastern sub-area are now<br />
‘open file’ and available from GEUS. <strong>The</strong> relinquished<br />
eastern sub-area is included in the forthcoming licensing<br />
round, which has a planned closing date in early<br />
2002.<br />
Although the Qulleq-1 well did not discover hydrocarbons,<br />
it has produced new information important to<br />
the evaluation of the petroleum exploration potential<br />
of offshore West <strong>Greenland</strong>. With a licensing round in<br />
<strong>prospect</strong> and the several seismic surveys carried out in<br />
the summer of 2000 providing many new and interesting<br />
exploration targets, <strong>Greenland</strong> is prepared for continued<br />
exploration on a sound geological background,<br />
Table 1. Well data for Qulleq-1 (6354/4-1)<br />
Operator:<br />
Drill ship:<br />
Well name:<br />
Co-ordinates:<br />
UTM co-ordinates:<br />
Statoil A/S<br />
West Navion<br />
6354/4-1 (Qulleq-1)<br />
63°48'48.03" N, 54°27'06.61" W<br />
E 625442, N 7078718; Zone 21; central<br />
meridian 57°W<br />
Wildcat<br />
36 m above sea level<br />
Well classification:<br />
Rotary table:<br />
Well spud: 10 July 2000<br />
Well termination: 4 September 2000<br />
Total measured depth: 2973 m RT<br />
Water depth:<br />
Core:<br />
Sidewall core:<br />
Logs:<br />
Formation drilled:<br />
Hydrocarbons:<br />
Test:<br />
Status:<br />
Prospect type:<br />
1152 m<br />
No conventional core taken<br />
150 shots, 120 recoveries, 5 misfired<br />
and 25 lost<br />
Wireline: gamma ray, resistivity, density,<br />
neutron, sonic, caliper and SP<br />
MWD while reaming from 1920 m–TD:<br />
gamma ray, sonic, density, neutron, resistivity,<br />
and acoustic caliper<br />
Quaternary, Palaeogene and Campanian<br />
mudstone; Santonian sandstone<br />
No hydrocarbons<br />
MDT: 11 pressure points were tested and<br />
1 fluid sample collected<br />
Plugged and abandoned<br />
Upper Cretaceous reservoir with crosscutting<br />
reflection in a major rotated fault<br />
block structure<br />
despite the temporary setback from the disappointing<br />
outcome of Qulleq-1.<br />
Drilling of the Qulleq-1 well and<br />
release of data<br />
<strong>The</strong> Qulleq-1 well was drilled by the Statoil group as<br />
part of their commitments in the eastern sub-area of the<br />
Fylla licence. <strong>The</strong> official well designation according to<br />
the existing block system is 6354/4-1, but the name<br />
Qulleq-1, which is derived from the <strong>Greenland</strong>ic word<br />
24<br />
Geology of <strong>Greenland</strong> Survey Bulletin 189, 24–33 (2001) © GEUS, 2001
70˚W<br />
60°W<br />
50°W<br />
40°W<br />
74°N<br />
TGS-NOPEC GREEN 2000<br />
survey line<br />
NuussuaqSeis 2000<br />
survey area<br />
BMP Baffin Bay survey line<br />
Existing KANUMAS<br />
line<br />
GGU/92-22 and ST9902-01001<br />
74 N<br />
Exploration well<br />
2001–2002 licensing round area<br />
200 km<br />
Svartenhuk<br />
Halvø<br />
Border with Canada<br />
70°N<br />
Baffin<br />
Bay<br />
Nuussuaq<br />
70°N<br />
Disko<br />
<strong>Greenland</strong><br />
Inland<br />
Ice<br />
Canada<br />
66°N<br />
62°N<br />
Sisimiut-West<br />
licence area<br />
60°W<br />
Qulleq-1<br />
(6354/4-1)<br />
for a train-oil lamp, has also been used by both Statoil<br />
and the authorities. <strong>The</strong> well was drilled with the newly<br />
built drill ship West Navion (Fig. 2). It was spudded in<br />
1152 m water depth on 10 July and reached total depth<br />
(TD) at 2973 m below rotary table (RT) before it was<br />
plugged and abandoned in early September (see well<br />
data in Table 1).<br />
Although the density of icebergs in the drilling region<br />
was higher than expected, downtime due to icebergs<br />
K-1<br />
Fylla<br />
licence<br />
area<br />
50°W<br />
66°N<br />
62°N<br />
Fig. 1. Map of West and North-West <strong>Greenland</strong> showing seismic<br />
lines acquired during summer of 2000, licence areas and area covered<br />
by 2001–2002 licensing round. K-1: Kangâmiut-1 well.<br />
Fig. 2. West Navion drilling off West <strong>Greenland</strong> in 2000. Photo<br />
courtesy of Smedvig asa.<br />
in the vicinity of the drill ship was only 33 hours (Ghexis<br />
2000). On the other hand, there was approximately 4<br />
weeks of downtime during the drilling period due to<br />
technical problems with the blow out preventer (BOP)<br />
and wellhead.<br />
<strong>The</strong> sampling programme during drilling has given<br />
some limitations in interpretation of the results of the well,<br />
as no cores were taken. Furthermore, cuttings are not<br />
available from the uppermost ~ 600 m of the hole,<br />
because it was drilled riserless; only minor amounts of<br />
material were collected from this interval from the seabed<br />
using a remote operated vehicle (ROV). However, an<br />
extensive sidewall-core programme has been very important<br />
for biostratigraphic studies and also for interpretation<br />
of lithology. A total of 120 of 150 sidewall cores were<br />
recovered. Due to serious hole problems in the deeper<br />
part of the well, logging of the interval below ~ 2205 m<br />
could only be carried out during a wiper trip using<br />
‘Measuring While Drilling’ (MWD) tools.<br />
Some of the main results from the well are reported<br />
briefly below. Biostratigraphical, organic geochemical<br />
and petrographical details may be found in consultancy<br />
reports produced for the Statoil group (Bojesen-Koefoed<br />
et al. 2000; Nøhr-Hansen et al. 2000; Preuss & Dalhoff<br />
2001; Preuss et al. 2001). All depths in the text and figures<br />
are in metres below rotary table (RT).<br />
25
m below<br />
RT<br />
WNW<br />
ESE<br />
msecs<br />
TWT<br />
QM<br />
2000<br />
1855<br />
1893<br />
1955<br />
2120<br />
LEoc<br />
UPal<br />
CCR<br />
2500<br />
2280<br />
UC2<br />
2649<br />
2736<br />
UC1<br />
C–T<br />
source<br />
rock<br />
3000<br />
2973<br />
3150<br />
LC<br />
3600<br />
3500<br />
LC<br />
Basement<br />
Fig. 3. Seismic line ST9902-01001 through the Qulleq-1 (6354/4-1) well. See Fig. 1 for position. <strong>The</strong> gamma-ray log is shown in green<br />
to the left of the well and the acoustic impedance log is shown in red to the right. Note that there is no significant change in acoustic<br />
impedance at the cross-cutting reflection (CCR) at 2537 msec TWT. LC: ?Lower Cretaceous; UC: Upper Cretaceous; UPal: Upper Paleocene;<br />
LEoc: Lower Eocene; QM: Quaternary – Middle Miocene. TWT: Seismic two-way-time.<br />
Exploration targets<br />
<strong>The</strong> main target of the Qulleq-1 well was the prominent<br />
cross-cutting reflection (CCR) which can be seen<br />
on the seismic data at around 2550 msecs two-way<br />
travel time (TWT) corresponding to a depth of c. 2100<br />
m (Fig. 3). Extensive analysis of all data available prior<br />
to drilling (including amplitude versus offset (AVO)<br />
analysis of the seismic data) suggested that this reflection<br />
represented a gas–liquid contact in a compartmentalised<br />
turbidite sandstone succession (e.g. Bate et<br />
al. 1995; Aram 1999; Isaacson & Neff 1999). <strong>The</strong> well,<br />
however, encountered only mudstones in this interval<br />
and no gas or oil. At present, the nature of the CCR is<br />
not fully understood, but X-ray diffraction analysis of<br />
sidewall cores by Statoil suggests that it may be related<br />
to a phase-change transition from opal-CT mineralisation<br />
to quartz mineralisation.<br />
Prior to drilling, TD was planned to 2850 m, just<br />
below a strong, regionally developed seismic reflection<br />
(~ 3100 msecs, Fig. 3), which was interpreted to be a<br />
source rock interval of possible Cenomanian– Turonian<br />
age. This reflection turned out to be the contact between<br />
Lower Campanian mudstones above and Upper<br />
26
Caliper<br />
0<br />
Bit size<br />
30<br />
0 30<br />
Metres<br />
MD<br />
Sonic<br />
240<br />
40 1.5<br />
Gamma-ray<br />
SWC 0<br />
180 75<br />
Density<br />
Porosity<br />
Resistivity<br />
3<br />
0 0.2 20<br />
Epoch<br />
1300<br />
1350<br />
1400<br />
1450<br />
Pliocene<br />
1500<br />
1550<br />
1600<br />
1650<br />
1700<br />
L. Paleocene E. Eocene<br />
M. – L.<br />
Miocene<br />
1750<br />
1800<br />
1850<br />
1900<br />
1950<br />
2000<br />
2050<br />
2100<br />
Early Campanian<br />
2150<br />
2200<br />
2250<br />
2300<br />
2350<br />
2400<br />
2450<br />
2500<br />
2550<br />
2600<br />
2650<br />
Lithology<br />
Sand<br />
Mud<br />
Carbonate<br />
cementation<br />
Fig. 4. Summary log of the Qulleq-1 well.<br />
SWC: Sidewall core.<br />
Late Santonian<br />
2700<br />
2750<br />
2800<br />
2850<br />
2900<br />
2950<br />
27
Santonian sandstones of reservoir quality below. As a<br />
result of the unexpected age and lithology of the sediments<br />
in this part of the section, and the lack of hydrocarbons<br />
at the CCR, it was decided to deepen the well<br />
to a maximum of 3000 metres. However, due to technical<br />
problems it was not operationally feasible to go<br />
deeper than the final TD of 2973 m.<br />
<strong>The</strong> possibility of reaching deeper targets in the<br />
inferred Lower Cretaceous succession, or to penetrate<br />
the full stratigraphic succession to basement, was not<br />
considered by the Statoil group (Pegrum et al. 2001).<br />
At the actual drilling position, however, continued<br />
drilling, if undertaken, would penetrate deeper reservoir<br />
targets below structural closure and probably below<br />
spillpoint.<br />
Stratigraphic units<br />
With the new results from the Qulleq-1 well, it is now<br />
possible to interpret the seismic data from the region<br />
in more detail. Four major stratigraphic units including<br />
basement, a syn-rift succession seen in half-graben<br />
structures, a tilted fault-block succession and a draping,<br />
more or less flat-lying succession can be identified<br />
on the seismic data. However, only the upper two of<br />
these were penetrated by the well (Figs 3, 4).<br />
<strong>The</strong> drilling demonstrated that the youngest unit<br />
draping the large, tilted fault-blocks of the Fylla structural<br />
complex consists of mid-Upper Paleocene to<br />
Quaternary mudstone-dominated, fully marine deposits<br />
(1152–1893 m). From outcrop and older well data, as<br />
well as from regional seismic data, two hiatuses spanning<br />
the interval across the Paleocene–Eocene boundary<br />
and the uppermost Middle Miocene to uppermost<br />
Early Eocene were expected, and their presence was<br />
confirmed at ~ 1885 m and ~ 1860 m, respectively.<br />
Prior to drilling, Statoil’s well programme had identified<br />
several potential drilling risks in this unit including<br />
the presence of large boulders (dropstones) in the<br />
Pliocene–Quaternary succession, shallow gas in a possible<br />
sandstone interval (seen as a high amplitude reflection<br />
at ~ 1900 msecs on the seismic data), and possibly<br />
thin volcanic ash layers. Due to expected relatively low<br />
temperatures and the large water depth, the possibility<br />
of gas hydrates was considered a major risk while<br />
drilling and during any well control events. In the event,<br />
none of these risk elements were encountered during<br />
drilling. <strong>The</strong>re was no evidence of shallow gas or gas<br />
hydrates, boulders were avoided and the age interval<br />
with possible volcanic rocks is missing due to a major<br />
hiatus.<br />
Within the tilted fault-block succession two units differing<br />
in lithological and seismic character can be identified<br />
(Figs 3, 4).<br />
<strong>The</strong> upper unit (1893–2649 m; 2318–3007 msecs) is<br />
characterised by good seismic reflectivity and lateral<br />
continuity although it is somewhat transparent (UC2<br />
on Fig. 3). When drilled it was found to consist of fully<br />
marine mudstones of Early Campanian age (Fig. 4).<br />
<strong>The</strong> unconformity between the Palaeogene and the<br />
Upper Cretaceous penetrated by the well spans the<br />
Early Campanian to mid-Late Paleocene, representing<br />
about 12–15 million years (Nøhr-Hansen et al. 2000).<br />
<strong>The</strong> lower unit (2650–2973 m; 3007 to ~ 3300 msecs)<br />
is characterised by good reflectivity and lateral continuity<br />
of units (UC1 on Fig. 3). <strong>The</strong> upper part of this<br />
unit comprises a fully marine, sandstone-dominated<br />
succession of Late Santonian age. <strong>The</strong> first possible<br />
Upper Santonian strata are found at 2635 m and,<br />
although the seismic data suggest an unconformity<br />
between the sandstone-dominated unit and the overlying<br />
mudstones, there is no evidence of a hiatus or condensed<br />
section (Fig. 4; Nøhr-Hansen et al. 2000).<br />
<strong>The</strong> syn-rift succession (~ 3300 to ~ 3600 msecs) was<br />
not reached by the well but may be seen on the seismic<br />
data as a distinct change in seismic character (Fig. 3). <strong>The</strong><br />
boundary with the overlying unit is unconformable and<br />
could represent a regionally mappable contact between<br />
Lower Cretaceous syn-rift sediments (fluvial or shallow<br />
marine) below and fully marine mid-Cretaceous/Upper<br />
Cretaceous sediments including a possible ?Cenomanian–Turonian<br />
source rock interval above.<br />
Basement is difficult to delineate on the seismic data,<br />
but may be seen at around 3500 msecs at the well position<br />
in Fig. 3. <strong>The</strong> crystalline basement may, however,<br />
be covered by both Ordovician limestones and Jurassic<br />
sediments, since Jurassic spores have been found in sidewall<br />
cores in the well (Nøhr-Hansen et al. 2000).<br />
Santonian reservoir sandstone<br />
Qulleq-1 encountered ~ 90 metres of reservoir-quality<br />
sand below which is a sandstone-dominated unit down<br />
to TD also showing reservoir potential (Fig. 4). <strong>The</strong><br />
gamma-log signature suggests that the penetrated Upper<br />
Santonian sandstone succession could be divided into<br />
three sub-units (Fig. 5). <strong>The</strong> sandstones are, however,<br />
both immature (with abundant feldspar, mica, pyroxene<br />
and rock fragments) and glauconitic. It is therefore<br />
not possible to relate the gamma-ray curve directly to<br />
sandstone/shale ratio. <strong>The</strong> main (upper) reservoir sandstone<br />
appears to exist within much or all of the struc-<br />
28
Epoch<br />
E. C.<br />
Caliper<br />
0<br />
Bit size<br />
30<br />
0 30<br />
Metres<br />
SWC<br />
240<br />
0<br />
Sonic<br />
Gamma-ray<br />
40 1.5<br />
180 75<br />
Density<br />
Porosity<br />
Resistivity<br />
3<br />
0 0.2 20<br />
2600<br />
2650<br />
2700<br />
Late Santonian<br />
2750<br />
2800<br />
Lithology<br />
Mud<br />
2850<br />
Carbonate<br />
cementation<br />
2900<br />
SWC<br />
sandstone<br />
2950<br />
SWC<br />
mudstone<br />
Fig. 5. Detailed log of the Santonian sandstone reservoir unit in the Qulleq-1 well. SWC: Sidewall core. E.C. Early Campanian.<br />
Sand<br />
ture shown in Fig. 8, but the character of the reflections<br />
changes from place to place indicating some changes<br />
in lithology or petrophysical properties. Unfortunately,<br />
the thickness of the best reservoir interval is close to<br />
seismic resolution, so it is not a simple task to relate<br />
the changes in seismic character to changes in lithology<br />
and reservoir properties.<br />
Organic geochemistry and thermal maturity<br />
Organic geochemical analyses of samples from the<br />
Qulleq-1 well were hampered by pervasive contamination<br />
by polyalkyleneglycol (PAG) – a drilling mud additive<br />
which was used in very high concentrations because<br />
of the risk of gas hydrates. Attempts to remove the contaminant<br />
failed, and Rock-Eval/TOC screening data<br />
from the well are therefore largely useless (see details<br />
in Bojesen-Koefoed et al. 2000). Generally, total organic<br />
carbon (TOC) values are below 0.5 wt% in the<br />
Palaeogene–Neogene mudstone unit, whereas most of<br />
the Lower Campanian marine mudstones show values<br />
between 1 and 2 wt%. <strong>The</strong> data show that no prolific<br />
petroleum source rocks are present within the drilled<br />
succession. Over the interval 2739–2811 m, a number<br />
of mudstone samples show relatively high TOC values<br />
(3–7 wt%). Mathematical curve-fitting carried out on<br />
original Rock-Eval pyrograms allowed elimination of the<br />
effects of PAG contamination, and showed that, despite<br />
high organic matter contents, these deposits possess<br />
only marginal source rock potential with corrected<br />
hydrogen indices (HI) < 120. Visual kerogen analyses<br />
confirm these results, showing the kerogen to consist<br />
predominantly of coaly and non-fluorescent amorphous<br />
organic matter.<br />
Analysis of sandstones from sidewall cores was carried<br />
out in an attempt to detect traces of migrated petroleum,<br />
but the results showed only PAG and various<br />
other contaminants. No traces of migrated hydrocarbons<br />
were detected.<br />
Since optical analyses were unaffected by PAG-contamination,<br />
a well-constrained maturity trend could be<br />
established (Fig. 6). Vitrinite reflectance (R 0 ) measurements<br />
show the succession to be immature with respect<br />
to petroleum generation. <strong>The</strong> top of the ‘oil window’<br />
is projected to be at about 3160 m, corresponding to<br />
c. 200 m below TD of the well. No significant changes<br />
of vitrinite reflectance are observed across biostratigraphic<br />
hiatuses. Based on the projected vitrinite<br />
reflectance level at the seabed, it may be concluded that<br />
the succession is near its maximum depth of burial.<br />
Basin modelling<br />
With new knowledge on the thermal maturity and temperature<br />
gradients in Qulleq-1, together with a reinterpretation<br />
of the seismic data based on new lithological<br />
and biostratigraphic information, the 2D basin modelling<br />
of the Fylla area has been revised.<br />
29
m below TD<br />
1000<br />
1500<br />
2000<br />
2500<br />
3000<br />
3500<br />
0<br />
Earliest oil<br />
0.2 0.4 0.6 R0<br />
acoustic impedance at the depth of the CCR (Fig. 3),<br />
which raises the question about the origin of the prominent<br />
reflection. Isaacson & Neff (1999, fig. 13) show<br />
an increase of amplitude with offset for the CCR, and<br />
a decrease in amplitude with offset for the top Cretaceous<br />
reflection. <strong>The</strong>se observations could indicate that there<br />
is significant seismic anisotropy within the opal-CT<br />
section. Such anisotropy could result in significantly<br />
different horizontal acoustic impedances in the opal-CT<br />
and quartz sections and little or no reflection of near<br />
vertical seismic energy, but significant reflection of faroffset<br />
rays. A stacked section which shows the summed<br />
contribution of both near- and far-offset energy,<br />
consequently shows the CCR from the far-offset traces<br />
only.<br />
4000<br />
Fig. 6. Vitrinite reflectance versus depth in Qulleq-1.<br />
<strong>The</strong> model clearly demonstrates that the sedimentary<br />
succession penetrated by Qulleq-1, as well as most of<br />
the succession underlying TD, is immature and that the<br />
assumed Cenomanian–Turonian source rock is immature<br />
in the vicinity of Qulleq-1 (Fig. 7). It is, however,<br />
evident from the modelling that this interval is situated<br />
in the main oil window in the two fault-blocks immediately<br />
east of Qulleq-1 (Fig. 7). <strong>The</strong> Cenomanian–<br />
Turonian is also inferred to be mature in the westernmost<br />
part of the Fylla licence area, although the lack<br />
of a seismic tie across the main fault zone makes it difficult<br />
to predict the position in detail. This suggests that<br />
the seismic line GGU/92-22 intersects three major<br />
kitchens for hydrocarbon generation, results which have<br />
very important implications for <strong>prospect</strong>ivity. If the<br />
modelling data from line GGU/92-22 are used to predict<br />
the position of the oil generation zones throughout<br />
the Fylla area, and if there is a source rock in these<br />
localities, a number of other kitchens and migration<br />
pathways can be mapped (Fig. 8).<br />
Seismic reinterpretation of the crosscutting<br />
reflection<br />
<strong>The</strong> results of the Qulleq-1 well show that the forecast<br />
Upper Cretaceous reservoir consists entirely of mudstone,<br />
and that the cross-cutting reflection (CCR) may be related<br />
to the phase transition from opal-CT to quartz. <strong>The</strong><br />
acoustic impedance log shows no significant change in<br />
Summary of results<br />
<strong>The</strong> drilling of the Qulleq-1 well, not unexpectedly,<br />
gave some surprises. Organic geochemistry, biostratigraphy,<br />
log interpretation and seismic reinterpretation<br />
have provided new information of importance for assessment<br />
of the petroleum potential of offshore West<br />
<strong>Greenland</strong>.<br />
1. Seismic velocities in the Qulleq-1 well are distinctly<br />
lower than in all other wells in West <strong>Greenland</strong>.<br />
2. In contrast to all the previous wells (Rolle 1985)<br />
there is surprisingly little sand in the Neogene succession.<br />
3. Several of the drilling risks considered before drilling<br />
are now known not to apply to this part of the basin.<br />
4. <strong>The</strong> major hiatuses in and bounding the Palaeogene<br />
were expected and their ages confirmed.<br />
5. <strong>The</strong> age and lithology of the seismic units within the<br />
tilted fault-blocks were not as expected. <strong>The</strong> upper<br />
units are somewhat older than expected, and consist<br />
of mudstone where substantial amounts of sand<br />
were expected (Bate et al. 1995; Aram 1999; Isaacson<br />
& Neff 1999). <strong>The</strong> deeper units are significantly<br />
younger (Santonian instead of Aptian/Albian) and<br />
reservoir-quality sand was found where it was hoped<br />
to encounter Cenomanian–Turonian source rock.<br />
This information has both negative and positive<br />
implications for the exploration possibilities.<br />
6. <strong>The</strong> CCR is not related to a gas–liquid contact. <strong>The</strong><br />
‘flat spot play’ in the Fylla licence area seems to be<br />
dead.<br />
7. <strong>The</strong> well-penetrated sediments are only immature<br />
for oil generation, and the main oil window (peak<br />
generation) is deeper than TD.<br />
30
33 00<br />
Fig. 7. 2D basin modelling of seismic line<br />
GGU/92-22 using the IES PetroMod® 2D<br />
modelling software. <strong>The</strong> model describes<br />
all important basin processes and data as<br />
a function of time. <strong>The</strong> figure shows the<br />
subdivision used in Qulleq-1 with<br />
modelled thermal maturity on a modelled<br />
depth-converted seismic line. Note the<br />
position of the Santonian sand unit and<br />
the possible Cenomanian–Turonian<br />
source rock interval in the kitchens east<br />
and west of Qulleq-1. See Fig. 1 for<br />
position of seismic line.<br />
Depth (m)<br />
1000<br />
2000<br />
3000<br />
4000<br />
5000<br />
6000<br />
7000<br />
8000<br />
WNW<br />
GGU/92-22<br />
Basement<br />
20 km<br />
Basement<br />
Late oil at<br />
~ 5500 m<br />
Early<br />
oil at<br />
~ 3200 m<br />
Qulleq-1<br />
(6354/4-1)<br />
Santonian sand<br />
Maturation<br />
Immature<br />
Early oil (> 0.5%)<br />
Main oil (> 0.7%)<br />
Late oil (> 1.0%)<br />
Dry gas (> 1.3%)<br />
ESE<br />
Main oil at<br />
~ 4300 m<br />
?Cenomanian–Turonian source rock<br />
54°30'W<br />
3300<br />
3200<br />
3000<br />
54°00'W<br />
53°30'W<br />
3000<br />
3500<br />
3600<br />
25 km<br />
2 9 00<br />
3000<br />
3700<br />
3 2 00<br />
3600<br />
Basement<br />
high<br />
290 0<br />
30 0 0<br />
3 90 0<br />
3 80 0<br />
3500<br />
2700<br />
2600<br />
25 0 0<br />
24 0 0<br />
3 500<br />
3400<br />
3300<br />
64°00'N<br />
36 0 0<br />
2 9 0 0<br />
3300<br />
28 0 0<br />
3100<br />
260 0<br />
Qulleq-1<br />
C<br />
2 400<br />
4 10 0<br />
400 0<br />
3200<br />
2 800<br />
2700<br />
2600<br />
2400<br />
2500<br />
230 0<br />
2800<br />
3 9 00<br />
380 0<br />
31 0 0<br />
2200<br />
2100<br />
300<br />
370 0<br />
3600<br />
D<br />
4 100<br />
4100<br />
2 9 0 0<br />
2000<br />
Fig. 8. Map showing depths in metres<br />
below sea level to the top of the<br />
Santonian sandy interval penetrated by<br />
Qulleq-1 at 2749 metres below rotary<br />
table. <strong>The</strong> crest of the structure is more<br />
than 800 metres shallower than the<br />
depth at which the well penetrated the<br />
horizon. Overlain colours indicate where<br />
a potential Cenomanian–Turonian source<br />
rock may be mature. Migration routes of<br />
oil from kitchen areas to leads and<br />
<strong>prospect</strong>s are indicated. Grey areas<br />
represent faults.<br />
C<br />
D<br />
Prospect<br />
Lead<br />
Boundary of eastern<br />
sub-area of the Fylla licence<br />
Ro<br />
Fault<br />
0.55<br />
0.60<br />
0.65<br />
0.70<br />
Early oil<br />
Main oil<br />
From Ro = 0.55–0.60<br />
From Ro = 0.60–0.70<br />
From Ro > 0.70<br />
Fylla Prospect C<br />
Fylla Prospect D<br />
Oil<br />
migration<br />
routes<br />
260 0<br />
290 0<br />
3700<br />
3 400<br />
30 00<br />
2 8 00<br />
3600<br />
3400<br />
3600<br />
3 30 0<br />
310 0<br />
3500<br />
31 00<br />
3 200<br />
38 00<br />
37<br />
35 00<br />
00<br />
33 0 0<br />
3 400<br />
34 00<br />
4 000<br />
33 0 0<br />
32 00<br />
3 500<br />
3700<br />
3100<br />
3000<br />
2900<br />
28 00<br />
27 0 0<br />
2 6 0 0<br />
No data<br />
2500<br />
3000<br />
2000<br />
1800<br />
63°30'N<br />
31
8. <strong>The</strong>rmal maturity data show a simple trend and are<br />
in accordance with measured temperatures. This is<br />
not a surprise and makes exploration simpler.<br />
9. <strong>The</strong> Qulleq-1 well was not drilled deeply enough,<br />
neither stratigraphically nor in absolute depth, considering<br />
the frontier nature of the Fylla area.<br />
Prospective successions of both presumed Early and<br />
Late Cretaceous age were left untouched below TD.<br />
10. <strong>The</strong> Santonian reservoir sandstone that was found<br />
was penetrated more than 800 m below the crest of<br />
the <strong>prospect</strong>, and significant up-dip potential on the<br />
structure remains untested.<br />
Implications for <strong>prospect</strong>ivity<br />
<strong>The</strong> results from the Qulleq-1 well have significant implications<br />
for the evaluation of the <strong>prospect</strong>ivity of the<br />
region. For many years the main risk in assessing the<br />
potential of offshore West <strong>Greenland</strong> has been the question<br />
of whether or not oil-prone source rocks are present<br />
(see first discussion in Chalmers et al. 1993). This risk was<br />
considerably reduced with the finds of widespread oil<br />
seeps onshore in the Disko–Nuussuaq region (see<br />
Christiansen et al. 1994; Bojesen-Koefoed et al. 1999).<br />
Although the results of Qulleq-1 were not as hoped, they<br />
have neither increased nor decreased this risk, since the<br />
well did not reach the postulated Cenomanian–Turonian<br />
succession which is considered to be the most likely<br />
oil-prone source rock interval in the region.<br />
<strong>The</strong> nature of the CCR is unrelated to hydrocarbon<br />
charge. <strong>The</strong> lack of high gas readings during drilling,<br />
and the lack of petroleum traces in cuttings and sidewall<br />
cores may be arguments for a higher risk of especially<br />
the presence of a source rock for gas. However,<br />
the well drilled mainly through immature mudstones,<br />
and the only potential reservoir sandstones were penetrated<br />
700–800 m below the crest and close to spillpoint<br />
of the structure.<br />
<strong>The</strong> thermal maturity data and basin modelling suggest<br />
that a possible Cenomanian–Turonian oil-prone<br />
source rock would be mature in kitchens in the deeper<br />
synclines of the Fylla area fault-blocks, and that there<br />
are simple migration pathways into several large<br />
<strong>prospect</strong>s with four-way dip closure; however, the well<br />
was on none of them (Fig. 8). One significant reservoir<br />
interval in the Upper Santonian has been demonstrated,<br />
and other reservoir sandstones may be present below<br />
the unconformity that is seen on the seismic data some<br />
hundred metres below TD of the Qulleq-1 well. <strong>The</strong><br />
thick Campanian and Palaeogene–Neogene mudstone<br />
successions form an excellent seal to these <strong>prospect</strong>s.<br />
Seismic acquisition during summer<br />
2000 – the Canadian connection<br />
In the summer of 2000 three seismic vessels operated<br />
in the waters off West and North-West <strong>Greenland</strong>. <strong>The</strong><br />
seismic company TGS-NOPEC extended their 1999<br />
acquisition of non-exclusive seismic data in the area designated<br />
for the licensing round in 2001 (Fig. 1). <strong>The</strong> seismic<br />
survey vessel Zephyr acquired more than 6300 km<br />
of seismic data, mainly in the region between the<br />
Sisimiut-West and Fylla licence areas. In particular, the<br />
data coverage around the Kangâmiut-1 well (the<br />
Kangâmiut Ridge area) was improved considerably (Fig.<br />
1). In order to link the Canadian and <strong>Greenland</strong> basins,<br />
TGS-NOPEC acquired three tie lines in Canadian waters.<br />
<strong>The</strong> TGS-NOPEC seismic data base off West <strong>Greenland</strong><br />
now comprises more than 9000 km of high-quality data.<br />
<strong>The</strong> Danish fishery inspection vessel <strong>The</strong>tis, with seismic<br />
equipment and operated by Nunaoil, acquired proprietary<br />
seismic data within the Sisimiut-West licence area<br />
for the Phillips group (about 1200 km). <strong>The</strong> Bureau of<br />
Minerals and Petroleum (BMP), Nuuk, <strong>Greenland</strong>, funded<br />
a seismic survey in the Baffin Bay area of North-West<br />
<strong>Greenland</strong>. <strong>The</strong> survey was designed as infill to the existing<br />
regional KANUMAS survey in order to achieve a<br />
denser seismic coverage of leads observed on the KANU-<br />
MAS lines. A total of 1340 km were acquired (Fig. 1).<br />
GEUS used the Danish research vessel Dana to<br />
acquire high-resolution seismic data in the waters around<br />
Nuussuaq. This programme (NuussuaqSeis 2000) was<br />
undertaken in co-operation with Aarhus University,<br />
Denmark, and was funded by the Danish Energy<br />
Research Programme and BMP. This project aims to<br />
improve understanding of the structure of the shallow<br />
part of the Nuussuaq Basin. <strong>The</strong> new data will also<br />
have direct implications for assessing the hydrocarbon<br />
potential of the onshore areas. Due to excellent weather<br />
and favourable ice conditions, more than 2700 km of<br />
data were acquired in only 18 days (see Marcussen et<br />
al. 2001, this volume).<br />
Onshore field work and other activities<br />
For the first time in more than 10 years there was no<br />
petroleum-related onshore field work in the Disko–<br />
Nuussuaq–Svartenhuk Halvø region in 2000. Activities<br />
were restricted to a field trip organised by TGS-NOPEC<br />
with GEUS providing guidance in the field.<br />
<strong>The</strong> extensive field programme that GEUS and collaborating<br />
partners have carried out throughout the<br />
32
1990s has reached a temporary conclusion. Many of<br />
the results from this work are important for the evaluation<br />
of the exploration potential of the Nuussuaq Basin<br />
itself and also for the offshore areas. Several important<br />
studies have been published in 2000, including the<br />
structures of Svartenhuk Halvø (Larsen & Pulvertaft<br />
2000), evidence of an Early Campanian rift-phase on<br />
Nuussuaq (Dam et al. 2000), specific compounds in<br />
seeping oils (Nytoft et al. 2000), a possible play showing<br />
seismic anomalies west of Disko (Skaarup et al.<br />
2000) and documentation of major Neogene uplift in<br />
West <strong>Greenland</strong> (Chalmers 2000). Many other studies<br />
on basin history, sedimentological and structural models,<br />
lithostratigraphy, organic geochemistry of northern<br />
seeps etc. are in progress.<br />
References<br />
Aram, R.B. 1999: West <strong>Greenland</strong> versus Vøring Basin: comparison<br />
of two deepwater frontier plays. In: Fleet, A.J. & Boldy, S.A.R.<br />
(eds): Petroleum geology of Northwest Europe: Proceedings of<br />
the 5th conference, 315–324. London: Geological Society.<br />
Bate, K.J., Whittaker, R.C., Chalmers, J.A. & Dahl-Jensen, T. 1995:<br />
<strong>The</strong> Fylla structural complex: possible very large gas reservoirs<br />
offshore southern West <strong>Greenland</strong>. Rapport Grønlands<br />
Geologiske Undersøgelse 165, 22–27.<br />
Bojesen-Koefoed, J.A., Christiansen, F.G., Nytoft, H.P. & Pedersen,<br />
A.K. 1999: Oil seepage onshore West <strong>Greenland</strong>: evidence of<br />
multiple source rocks and oil mixing. In: Fleet, A.J. & Boldy,<br />
S.A.R. (eds): Petroleum geology of Northwest Europe: Proceedings<br />
of the 5th conference, 305–314. London: Geological Society.<br />
Bojesen-Koefoed, J.A., Nytoft, H.P. & Rosenberg, P. 2000: Qulleq-<br />
1 (6354/4-1): petroleum geochemistry. Service report prepared<br />
for Statoil a.s. Danmarks og Grønlands Geologiske Undersøgelse<br />
Rapport 2000/83, 35 pp.<br />
Chalmers, J.A. 2000: Offshore evidence for Neogene uplift in<br />
central West <strong>Greenland</strong>. In: Chalmers, J.A. & Cloetingh, S.<br />
(eds): Neogene uplift and tectonics around the North Atlantic.<br />
Global and Planetary Change 24(3–4), 311–318.<br />
Chalmers, J.A., Pulvertaft, T.C.R., Christiansen, F.G., Larsen, H.C.,<br />
Laursen, K.H. & Ottesen, T.G. 1993: <strong>The</strong> southern West<br />
<strong>Greenland</strong> continental margin: rifting history, basin development,<br />
and petroleum potential. In: Parker, J.R. (ed.): Petroleum<br />
geology of Northwest Europe: Proceedings of the 4th conference,<br />
915–931. London: Geological Society.<br />
Christiansen, F.G., Dam, G. & Pedersen, A.K. 1994: Discovery of<br />
live oil at Marraat, Nuussuaq: field work, drilling and logging.<br />
Rapport Grønlands Geologiske Undersøgelse 160, 57–63.<br />
Dam, G., Nøhr-Hansen, H., Pedersen, G.K. & Sønderholm, M. 2000:<br />
Sedimentary and structural evidence of a new early Campanian<br />
rift phase in the Nuussuaq Basin, West <strong>Greenland</strong>. Cretaceous<br />
Research 21(1), 127–154.<br />
Ghexis 2000: Qulleq-1 and the media: myths and facts about the<br />
Fylla exploration well. An interview with Statoil. Ghexis<br />
Newsletter 18, 1–3. Copenhagen/Nuuk: Geological Survey of<br />
Denmark and <strong>Greenland</strong>/Bureau of Minerals and Petroleum.<br />
Isaacson, E.S. & Neff, D.B. 1999: A, B AVO cross-plotting and its<br />
application to <strong>Greenland</strong> and the Barents Sea. In: Fleet, A.J.<br />
& Boldy, S.A.R. (eds): Petroleum geology of Northwest Europe:<br />
Proceedings of the 5th Conference, 1289–1298. London:<br />
Geological Society.<br />
Larsen, J.G. & Pulvertaft, T.C.R. 2000: <strong>The</strong> structure of the<br />
Cretaceous–Palaeogene sedimentary-volcanic area of<br />
Svartenhuk Halvø, central West <strong>Greenland</strong>. Geology of<br />
<strong>Greenland</strong> Survey Bulletin 188, 40 pp.<br />
Marcussen, C., Chalmers, J.A., Andersen, H.L., Rasmussen, R. &<br />
Dahl-Jensen, T. 2001: Acquisition of high-resolution multichannel<br />
seismic data in the offshore part of the Nuussuaq<br />
Basin, central West <strong>Greenland</strong>. Geology of <strong>Greenland</strong> Survey<br />
Bulletin 189, 34–40 (this volume).<br />
Nøhr-Hansen, H., Piasecki, S., Rasmussen, J.A. & Sheldon, E.<br />
2000: Biostratigraphy of well 6354/4-1 (Qulleq-1), West<br />
<strong>Greenland</strong>. Danmarks og Grønlands Geologiske Undersøgelse<br />
Rapport 2000/101, 81 pp.<br />
Nytoft, H.P., Bojesen-Koefoed, J.A. & Christiansen, F.G. 2000: C 26<br />
and C 28 -C 34 28-norhopanes in sediments and petroleum. Organic<br />
Geochemistry 31(1), 25–39.<br />
Pegrum, R.M., Ødegård, T., Bonde K & Hamann, N.E. 2001:<br />
Exploration in the Fylla area, SW <strong>Greenland</strong>. UNIGRA/AAPG<br />
International Conference, St. Petersburg, Russia, 15–18 July 2001.<br />
CD–Rom abstracts.<br />
Preuss, T. & Dalhoff, F. 2001: Qulleq-1 (6354/4-1): petrography<br />
of selected sidewall cores. Service report prepared for Statoil.a.s.<br />
Danmarks og Grønlands Geologiske Undersøgelse Rapport<br />
2001/33, 14 pp.<br />
Preuss, T., Dam, G. & Dalhoff, F. 2001: Qulleq-1 (6354/4-1): sidewall<br />
core description. Service report prepared for Statoil a.s.<br />
Danmarks og Grønlands Geologiske Undersøgelse Rapport<br />
2001/4, 31 pp.<br />
Rolle, F. 1985: Late Cretaceous – Tertiary sediments offshore central<br />
West <strong>Greenland</strong>: lithostratigraphy, evolution, and petroleum<br />
potential. Canadian Journal of Earth Sciences 22,<br />
1001–1019.<br />
Skaarup, N., Chalmers, J.A. & White, D. 2000: An AVO study of<br />
a possible new hydrocarbon play, offshore central West<br />
<strong>Greenland</strong>. AAPG Bulletin 84(2), 174–182. Tulsa: American<br />
Association of Petroleum Geologists.<br />
Authors’ addresses<br />
F.G.C., J.A.B.-K., J.A.C., F.D., A.M., M.S., U.G., C.M., H.N.-H., S.P., T.P., T.C.R.P., J.A.R. & E.S., Geological Survey of Denmark and <strong>Greenland</strong>,<br />
Thoravej 8, DK-2400 Copenhagen NV, Denmark. E-mail: fgc@geus.dk<br />
G.D., Dansk Olie og Naturgas, Egern Alle 24–26, DK-2970 Hørsholm, Denmark.<br />
33
Acquisition of high-resolution multichannel seismic data<br />
in the offshore part of the Nuussuaq Basin, central West<br />
<strong>Greenland</strong><br />
Christian Marcussen, James A. Chalmers, Holger Lykke Andersen,<br />
Rasmus Rasmussen and Trine Dahl-Jensen<br />
A high-resolution multichannel seismic survey (project<br />
NuussuaqSeis 2000) was carried out from 18 July to 2<br />
August 2000 in the offshore part of the Nuussuaq Basin,<br />
central West <strong>Greenland</strong> using the Danish research vessel<br />
R/V Dana with seismic equipment from the Geological<br />
Institute, Aarhus University, Denmark. Funding<br />
for the project was provided by the Danish Energy<br />
Research Programme, the Bureau of Minerals and<br />
Petroleum, Nuuk, <strong>Greenland</strong>, the Geological Institute<br />
of Aarhus University and the Geological Survey of Denmark<br />
and <strong>Greenland</strong> (GEUS). After completion of the<br />
NuussuaqSeis 2000 project, R/V Dana was used for a<br />
three-day coring project in Disko Bugt (see Kuijpers et<br />
al. 2001, this volume) before the ship returned to<br />
Denmark.<br />
Background<br />
Knowledge of the Nuussuaq Basin in central West<br />
<strong>Greenland</strong> (Fig. 1) has increased significantly since the<br />
discovery of extensive oil seeps on western Nuussuaq<br />
in 1992 (Bojesen-Koefoed et al. 1999). A number of<br />
geological and geophysical studies have been published<br />
and data from slim core drilling and exploration<br />
wells are also available. <strong>The</strong> existence of the oil seeps<br />
indicates that the Nuussuaq Basin is a petroleum basin<br />
in its own right, and not merely an accessible analogue<br />
to potential petroleum basins offshore (Bojesen-Koefoed<br />
et al. 1999). Seismic data acquired onshore in 1994<br />
(Christiansen et al. 1995), followed by a seismic and gravity<br />
survey in 1995 in the fjords south and north of<br />
Nuussuaq, have greatly improved the general understanding<br />
of the structure of the basin (Chalmers et al.<br />
1999a). Project NuussuaqSeis 2000 – acquisition of highresolution<br />
multichannel seismic data in the waters<br />
around Nuussuaq and Ubekendt Ejland – was designed<br />
to improve understanding of the shallow structure of<br />
the Nuussuaq Basin.<br />
<strong>The</strong> seismic survey<br />
Planning<br />
Experience during seismic acquisition in earlier years<br />
in the same waters has shown that use of a long streamer<br />
(e.g. 3000 m) is likely to be prevented by the large<br />
numbers of icebergs. While usage of a short streamer<br />
makes it impossible to remove seabed multiples by traditional<br />
methods (e.g. F/K filtering), the relatively large<br />
water depths in the area of interest – between 400 and<br />
800 m – make it possible to see up to 1.5 km of sediments<br />
before the first seabed multiple obscures the<br />
data. It was therefore decided to accept the limitations<br />
of a short streamer, and use high-resolution seismic<br />
equipment with a considerably smaller source but better<br />
resolution than conventional marine seismic equipment.<br />
Prior to initiation of the survey, all available bathymetric<br />
data were compiled and plotted together with<br />
the planned lines as overlays to the published charts<br />
from the area. This showed that the bathymetry of parts<br />
of the survey area was poorly known. <strong>The</strong> planned<br />
survey consisted of 2013 km of priority 1 lines in Vaigat<br />
and Uummannaq Fjord plus 290 km of priority 2 lines<br />
over the areas underlain by basalt west of Nuussuaq<br />
and Ubekendt Ejland.<br />
Seismic equipment<br />
<strong>The</strong> seismic acquisition system used for the survey is<br />
owned by the Geological Institute of Aarhus University.<br />
It includes a 96-group, 594 m long hydrophone streamer<br />
with a 6.25 m group interval and two Geometrics R48<br />
recording systems. <strong>The</strong> source consisted of a 4 x 40 in 3<br />
sleeve-gun cluster. Navigation was controlled by Navipac<br />
software, and positioning was provided by an Ashtech<br />
G12 GPS receiver (see Table 1 for details). A Ramesses<br />
quality-control system is integrated in the acquisition<br />
system to provide real-time processing and display<br />
34<br />
Geology of <strong>Greenland</strong> Survey Bulletin 189, 34–40 (2001) © GEUS, 2001
02<br />
Minor oil staining<br />
Intensive oil staining<br />
and seepage<br />
Eocene and younger<br />
sediments<br />
Palaeogene basalts<br />
Svartenhuk<br />
Halvø<br />
53°<br />
51°<br />
Inland Ice<br />
<strong>Greenland</strong><br />
Nuussuaq Basin<br />
13<br />
Maastrichtian–Paleocene<br />
sediments<br />
Albian–Campanian<br />
sediments<br />
Precambrian basement<br />
NuussuaqSeis 2000<br />
seismic lines<br />
Extensional fault<br />
Fault with lateral or<br />
alternating displacements<br />
GRO#3 well<br />
71°<br />
41<br />
13<br />
44<br />
49<br />
47<br />
51<br />
15<br />
45<br />
43<br />
09<br />
46<br />
50<br />
Ubekendt<br />
Ejland<br />
Fig. 5<br />
It<br />
17<br />
28<br />
31<br />
33<br />
38<br />
48<br />
19<br />
29<br />
40<br />
39<br />
36<br />
35<br />
25<br />
20<br />
23<br />
30<br />
32<br />
34<br />
37<br />
27<br />
21<br />
Up<br />
22<br />
16<br />
26<br />
Fig. 4<br />
24<br />
14<br />
Uummannaq Fjord<br />
18<br />
Ap<br />
Uummannaq<br />
71°<br />
Inland Ice<br />
Hareøen<br />
01<br />
42<br />
52<br />
11<br />
06<br />
10<br />
12<br />
08<br />
04<br />
Ma<br />
54<br />
56<br />
Nuussuaq<br />
53<br />
55<br />
07<br />
Fig. 3<br />
60<br />
70°<br />
61<br />
Vaigat<br />
57<br />
05<br />
58<br />
64<br />
59<br />
62<br />
Disko<br />
63<br />
03<br />
50 km<br />
Qeqertarsuaq<br />
(Godhavn)<br />
Disko Bugt<br />
66<br />
Ilulissat<br />
(Jakobshavn)<br />
69°<br />
55° 51°<br />
65<br />
Fig. 1. Simplified map of the Nuussuaq Basin showing the geology onshore (dark colour tones) and offshore (light colour tones),<br />
place names used in text and the seismic lines acquired during project NuussuaqSeis 2000. <strong>The</strong> prefix GEUS00- is omitted from all<br />
line numbers. Location of the seismic examples in Figs 3, 4 and 5 are shown. Ap: Appat Ø, It: Itilli fault, Ma: Maarrat, Up: Upernivik<br />
Ø. White areas are ice. Modified from Christiansen et al. (2000).<br />
35
Table 1. Acquisition equipment and parameters<br />
Source<br />
Spacing between individual guns<br />
Depth<br />
Pressure<br />
4 x 40 in 3 TI SG-I sleeve guns<br />
50 cm centre to centre<br />
3.5 m to centre of cluster<br />
120 bar<br />
Streamer<br />
HydroScience<br />
Length<br />
593.75 m (active section)<br />
Towing cable length<br />
90 m<br />
Number of groups 96<br />
Group interval<br />
6.25 m<br />
Group length<br />
3.125 m<br />
Streamer depth<br />
3 m<br />
Near offset<br />
53 m<br />
Shotpoint interval<br />
5 sec ≈ 12.5 m<br />
Recording system<br />
2 Geometrics R48<br />
Sample rate: 1 msec<br />
Record length<br />
3072 msec<br />
Delay<br />
0 msec<br />
Filters<br />
Low cut: 10 Hz slope 24 db/oct<br />
High cut: 300 Hz anti-aliasing<br />
Data format SEG-D 8048 revision 0<br />
Output media<br />
IBM 3490 cartridge<br />
Navigation<br />
Magnetometer<br />
Equipment / Parameters<br />
GPS - Ashtech G12 receiver<br />
Geometrics G866<br />
Echosounder Simrad EK 400<br />
facilities. Due to technical problems, magnetic data were<br />
recorded only from line GEUS00-18.<br />
A ProMax processing system from GEUS was installed<br />
on R/V Dana (Fig. 2); this system was used for test processing<br />
of the seismic data and hence gave valuable input<br />
for subsequent adjustments of the survey programme.<br />
Data acquisition<br />
A total of 2743 km of data were acquired during the<br />
18-day survey, which was 20% more than planned (Fig.<br />
1; Marcussen et al. 2001). During the entire cruise, the<br />
weather was effectively calm and therefore ideal for seismic<br />
acquisition. Icebergs, which were expected to be<br />
the main obstacles to seismic acquisition, were either<br />
relatively sparse, in which case it was possible to acquire<br />
data around them without significant problems other<br />
than the occasional move slightly off-line, or they were<br />
packed so densely that some areas were impossible to<br />
penetrate. <strong>The</strong> amount of time lost for equipment downtime<br />
was also small, a total of about 10 hours.<br />
Maintenance of equipment was mostly undertaken during<br />
extended line shifts.<br />
Data were acquired in three areas: (1) the Vaigat<br />
area south of Nuussuaq; (2) the area of Uummannaq<br />
Fjord and the strait between Ubekendt Ejland and<br />
Upernivik Ø; and (3) the areas west of Ubekendt Ejland<br />
and Nuussuaq where basalts are exposed on the seabed.<br />
A preliminary interpretation of the data was made<br />
onboard as it became available throughout the survey.<br />
<strong>The</strong> primary purposes of the interpretation were to provide<br />
information for any necessary alteration of survey<br />
plans, to judge the quality of data, to provide input to<br />
processing on ProMax, and to develop models for subsequent<br />
more detailed interpretation.<br />
Vaigat<br />
Chalmers et al. (1999a) divided the Vaigat area, the<br />
sound between Disko and Nuussuaq, into three distinct<br />
parts. West of about 54ºW, basalt is exposed at the<br />
seabed (Fig. 1). Between longitudes 54ºW and 53ºW,<br />
three large fault-blocks with thick, easterly dipping,<br />
Cretaceous sediments can be seen. <strong>The</strong> centre of the<br />
bathymetric channel is partly filled by flat-lying Holocene<br />
Fig. 2. <strong>The</strong> Danish research vessel R/V<br />
Dana in Uummannaq Fjord during<br />
project NuussuaqSeis 2000.<br />
36
NW<br />
SP<br />
6500<br />
6000 5500 5000<br />
SE<br />
GEUS00-03<br />
Glacial moraines or<br />
post-glacial slumps<br />
500<br />
Holocene sediments<br />
1000<br />
TWT (msec)<br />
Easterly dipping<br />
Cretaceous sediments<br />
5 km<br />
1500<br />
Fig. 3. Example of seismic data from Vaigat. Part of line GEUS00-03 showing easterly dipping Cretaceous sediments beneath flat-lying<br />
Holocene sediments with large glacial moraines or post-glacial slumps. Location shown in Fig. 1. SP: shot point.<br />
sediments (Fig. 3). <strong>The</strong> area east of 53ºW is complex,<br />
with both large glacial moraines or post-glacial slumps<br />
and sills at and beneath the seabed (Fig. 3).<br />
<strong>The</strong> first phase of the survey in Vaigat was carried<br />
out for the most part on the pre-planned lines. Since<br />
the iceberg density was low, the strategically most<br />
important data was acquired first over the known area<br />
of fault-blocks in western Vaigat. It became apparent<br />
during the acquisition of these first lines that the quality<br />
of the data was good to excellent in those areas<br />
without sills, large glacial moraines or post-glacial slumps<br />
at the seabed (Fig. 3).<br />
Preliminary interpretation of the lines acquired in<br />
western Vaigat showed that the interpretation shown<br />
in Chalmers et al. (1999a) was essentially correct, and<br />
in the second phase of the survey in this area a number<br />
of lines were planned to cross the western part of<br />
the fjord within each fault-block to provide horizon ties<br />
between the lines along the fjord.<br />
Eastern Vaigat has a complex structure, and the interpretation<br />
shown in Chalmers et al. (1999a) requires<br />
revisions. Additional lines were acquired to optimise new<br />
interpretations of the structure.<br />
A few lines were acquired in the area off Maarrat<br />
between Nuussuaq and Hareøen in order to test whether<br />
correlation of the onshore geology and the results of<br />
the GRO#3 exploration well to the offshore areas was<br />
possible.<br />
Uummannaq Fjord and the strait between<br />
Ubekendt Ejland and Upernivik Ø<br />
<strong>The</strong> area north of Nuussuaq is characterised by large<br />
fault-blocks with thick, easterly dipping, Cretaceous<br />
sediments (Chalmers et al. 1999a). <strong>The</strong> fault-blocks are<br />
divided by faults that throw down to the west and can<br />
be identified as offshore extensions of faults known<br />
onshore (Fig. 2). To the east Precambrian basement is<br />
exposed, whereas west of the offshore extension of<br />
the Itilli fault basalt is exposed at the seabed.<br />
Acquisition started in this area with line GEUS00-13,<br />
a long transect from west of Nuussuaq to basement<br />
outcrop west of Appat Ø. On the way into and across<br />
Uummannaq Fjord, it became apparent that there was<br />
a low density of icebergs in the outer fjord similar to<br />
that encountered in Vaigat, but icebergs were tightly<br />
37
W<br />
SP<br />
8500<br />
9000 9500<br />
E<br />
GEUS00-13<br />
Basement<br />
500<br />
Easterly dipping<br />
Cretaceous sediments<br />
1000<br />
TWT (msec)<br />
1500<br />
Fault<br />
Fault<br />
5 km<br />
Fig. 4. Example of seismic data from Uummannaq Fjord. Part of line GEUS00-13 showing easterly dipping Cretaceous sediments in<br />
fault-blocks with Precambrian basement outcrop at the eastern end. Location shown in Fig. 1. SP: shot point.<br />
packed in the inner part of the fjord around Uummannaq.<br />
Of two long transits (GEUS00-14 and -15) across<br />
Uummannaq Fjord to the basalt area and back, the eastern<br />
end of line GEUS00-15 was terminated early because<br />
of dense concentrations of icebergs. Further acquisition<br />
of planned lines east of 52º30′W had to be abandoned<br />
because of densely packed icebergs, and thus only a<br />
few crossings over the eastern margin of the basin were<br />
made. New lines were planned in the accessible part<br />
of the fjord. After finishing work in the southern part<br />
of Uummannaq Fjord, a transit to the north between<br />
Ubekendt Ejland and Upernivik Ø (GEUS00-22 and -27)<br />
was terminated by large concentrations of icebergs at<br />
71º27′N. It was not possible to proceed farther north,<br />
and the entire programme east of Svartenhuk Halvø in<br />
the northern part of the basin was abandoned.<br />
Good reflections were obtained on most of the lines<br />
acquired and only few areas of moraine or large sills<br />
were noted. <strong>The</strong> area comprises fault-blocks, and good<br />
images of many of the faults were obtained (Fig. 4).<br />
Along the eastern margin of the area, several crossings<br />
from Cretaceous sediments to Precambrian basement<br />
were achieved (Fig. 4), and many images were also<br />
obtained of the margin of the basalts, as well as reflections<br />
from below the top of the basalts.<br />
Areas west of Ubekendt Ejland and<br />
Nuussuaq where basalt is exposed at the<br />
seabed<br />
Acquisition of lines west of Nuussuaq and Ubekendt<br />
Ejland was only a second priority. However, the<br />
favourable weather conditions made it possible to<br />
expand the acquisition programme considerably in this<br />
structurally poorly known area. Additional lines were<br />
thus acquired where basalts are found near the seabed,<br />
and water depths were large enough to achieve significant<br />
penetration of the basalts above the first seabed<br />
multiple.<br />
Older seismic surveys in this area (GGU/1995 and<br />
Brandal/1971; Chalmers et al. 1999a) have shown that<br />
there are reflections from below the top basalt reflection.<br />
<strong>The</strong> significance of these reflections is, however,<br />
38
W<br />
SP<br />
GEUS00-48<br />
2000 1500<br />
E<br />
Holocene sediments<br />
Top basalt<br />
1000<br />
TWT (msec)<br />
1500<br />
3 km<br />
Fig. 5. Example of seismic data from the area north-west of Nuussuaq where basalts crop out at the seabed. Part of line GEUS00-48.<br />
<strong>The</strong> dipping reflections may come from syn-magmatic half-grabens or westward-dipping Cretaceous or lower Paleocene sediments<br />
(see text). Location shown in Fig. 1. SP: shot point.<br />
not well understood; the different interpretations of the<br />
area so far published (Whittaker 1995, 1996; Geoffroy<br />
et al. 1998; Chalmers et al. 1999b) have substantially different<br />
implications with respect to its <strong>prospect</strong>ivity. <strong>The</strong><br />
presence of a type IV AVO (amplitude versus offset)<br />
anomaly associated with a bright spot on some of the<br />
GGU/1995 lines (Skaarup & Chalmers 1998; Skaarup<br />
et al. 2000) has significance from the point of view of<br />
hydrocarbon <strong>prospect</strong>ivity.<br />
Approximately 710 km of data were acquired in a<br />
broad grid extending from the mouth of Vaigat in the<br />
south to Svartenhuk Halvø in the north during a 3.5-day<br />
period. Excellent reflections were received from up to<br />
and over 500 msec below the top of the basalts in many<br />
areas (Fig. 5). Some of these sub-top basalt reflections<br />
are undoubtedly from lithological variations within the<br />
basalt sequences and preliminary correlation of the<br />
magnetic and seismic data suggests that it may be possible<br />
to develop a detailed seismic and magneto-stratigraphy.<br />
Other reflections seem to come from<br />
half-grabens (Fig. 5). While it is possible that the latter<br />
are syn-magmatic, as discussed by Geoffroy et al. (1998),<br />
it is also possible that they derive from westward-dipping<br />
Cretaceous or lower Paleocene sediments beneath<br />
thin basalts west of Nuussuaq. Quantitative interpretation<br />
of the magnetic data may resolve this question.<br />
Processing<br />
As noted above, the seismic data processing was initiated<br />
during the survey on selected lines, both to check<br />
data quality and to contribute to adjustments in the survey<br />
programme. <strong>The</strong> possibilities of removing the seabottom<br />
multiple were carefully tested, but although it was<br />
possible to weaken the sea-bottom multiple substantially,<br />
it was still too strong to identify primaries below<br />
the multiple except in a few places. This problem was<br />
expected because of the source strength (160 in 3 in total)<br />
and in particular the streamer length (600 m). In order<br />
to avoid problems in migration, it was therefore decided<br />
not to migrate the data below the sea-bottom multiple.<br />
<strong>The</strong> relatively time-consuming Kirchoff migration algorithm<br />
has been used to ensure a proper migration of<br />
the steeply dipping features common in the survey<br />
area. <strong>The</strong> velocity analyses show very high velocities<br />
in general, not only in areas covered by basalt, but also<br />
in the sediments below the Quaternary cover in most<br />
of the survey area, and in particular in Vaigat.<br />
39
Summary<br />
<strong>The</strong> cruise was very successful. Due to very favourable<br />
weather and ice conditions, 2743 km of good quality<br />
data were acquired, nearly 20% more than originally<br />
planned. High concentrations of icebergs prevented<br />
acquisition of data in the eastern part of Uummannaq<br />
Fjord and east of Svartenhuk Halvø.<br />
Data from project NuussuaqSeis 2000 have increased<br />
considerably the seismic coverage in the region, and it<br />
is anticipated that the new data will have direct implications<br />
for the evaluation of the hydrocarbon potential.<br />
Acknowledgements<br />
Funding for the project was provided by the Danish Energy<br />
Research Programme (ENS J.nr. 1313/99-0024) and the Bureau<br />
of Minerals and Petroleum, Government of <strong>Greenland</strong>. Captain<br />
Peter Østrin and the crew of R/V Dana are thanked for their professionalism<br />
and cooperation during the cruise. <strong>The</strong> splendid<br />
and untiring efforts of our two technicians, Per Trinhammer<br />
(Aarhus University) and Egon Hansen, reduced technical downtime<br />
to a minimum.<br />
References<br />
Bojesen-Koefoed, J.A., Christiansen, F.G., Nytoft, H.P. & Pedersen,<br />
A.K. 1999: Oil seepage onshore west <strong>Greenland</strong>: evidence of<br />
multiple source rocks and oil mixing. In: Fleet, A.J. & Boldy,<br />
S.A.R. (eds): Petroleum geology of Northwest Europe: Proceedings<br />
of the 5th Conference, 305−314. London: Geological<br />
Society.<br />
Chalmers, J.A., Pulvertaft, T.C.R., Marcussen, C. & Pedersen, A.K.<br />
1999a: New insight into the structure of the Nuussuaq Basin,<br />
central West <strong>Greenland</strong>. Marine and Petroleum Geology 16(3),<br />
197−224.<br />
Chalmers, J.A., Whittaker, R.C., Skaarup, N., Pulvertaft, T.C.R.,<br />
Geoffroy, L., Skuce, A.G., Angelier, J., Gelard, J.P., Lepvrier,<br />
C. & Olivier, P. 1999b: <strong>The</strong> coastal flexure of Disko (West<br />
<strong>Greenland</strong>), onshore expression of the ‘oblique reflectors’:<br />
discussion and reply. Journal of the Geological Society (London)<br />
156(5), 1051−1055.<br />
Christiansen, F.G., Marcussen, C. & Chalmers, J.A. 1995:<br />
Geophysical and petroleum geological activities in the<br />
Nuussuaq – Svartenhuk Halvø area 1994: promising results for<br />
an onshore exploration potential. Rapport Grønlands Geologiske<br />
Undersøgelse 165, 32−41.<br />
Christiansen, F.G. et al. 2000: Petroleum geological activities in<br />
West <strong>Greenland</strong> in 1999. Geology of <strong>Greenland</strong> Survey Bulletin<br />
186, 88−96.<br />
Geoffroy, L., Gelard, J.P., Lepvier, C. & Olivier, P. 1998: <strong>The</strong> coastal<br />
flexure of Disko (West <strong>Greenland</strong>), onshore expression of the<br />
‘oblique reflectors’. Journal of the Geological Society (London)<br />
155(3), 463−473.<br />
Kuijpers, A., Lloyd, J.M., Jensen, J.B., Endler, R., Moros, M., Park,<br />
L.A., Schulz, B., Jensen, K.G. & Laier, T. 2001: Late Quaternary<br />
circulation changes and sedimentation in Disko Bugt and adjacent<br />
fjords, central West <strong>Greenland</strong>. Geology of <strong>Greenland</strong><br />
Survey Bulletin 189, 41–47 (this volume).<br />
Marcussen, C., Lykke Andersen, H., Chalmers, J.A., Rasmussen,<br />
R., Trinhammer, P. & Hansen, E. 2001: Seismic acquisition in<br />
the offshore part of the Nuussuaq basin during summer 2000.<br />
Cruise report. Danmarks og Grønlands Geologiske Undersøgelse<br />
Rapport 2001/18, 65 pp.<br />
Skaarup, N. & Chalmers, J.A. 1998: A possible new hydrocarbon<br />
play, offshore central West <strong>Greenland</strong>. Geology of <strong>Greenland</strong><br />
Survey Bulletin 180, 28−30.<br />
Skaarup, N., Chalmers, J.A. & White, D. 2000: An AVO study of<br />
a possible new hydrocarbon play, offshore central West<br />
<strong>Greenland</strong>. AAPG Bulletin 84(2), 174−182. Tulsa: American<br />
Association of Petroleum Geologists.<br />
Whittaker, R.C. 1995: A preliminary assessment of the structure,<br />
basin development and petroleum potential offshore central<br />
West <strong>Greenland</strong>. Open File Series Grønlands Geologiske<br />
Undersøgelse 95/9, 33 pp.<br />
Whittaker, R.C. 1996: A preliminary seismic interpretation of an<br />
area with extensive Tertiary basalts offshore central West<br />
<strong>Greenland</strong>. Bulletin Grønlands Geologiske Undersøgelse 172,<br />
28−31.<br />
Authors’ addresses<br />
C.M., J.A.C., R.R. & T.D.J., Geological Survey of Denmark and <strong>Greenland</strong>, Thoravej 8, DK-2400 Copenhagen NV, Denmark. E-mail:<br />
cma@geus.dk<br />
H.L.A., Geological Institute, Aarhus University, Finlandsgade 6−8, DK-8200 Aarhus N, Denmark.<br />
40
Late Quaternary circulation changes and sedimentation<br />
in Disko Bugt and adjacent fjords, central West <strong>Greenland</strong><br />
Antoon Kuijpers, Jerry M. Lloyd, Jørn B. Jensen, Rudolf Endler, Matthias Moros, Laura A. Park,<br />
Bernd Schulz, Karin Gutfelt Jensen and Troels Laier<br />
Several important outlets for meltwater and iceberg discharge<br />
occur along the margin of the <strong>Greenland</strong> Inland<br />
Ice. One of these is Disko Bugt in central West <strong>Greenland</strong><br />
(Fig. 1). Large-scale exchange processes between the<br />
deep ocean and atmosphere are highly sensitive with<br />
regard to meltwater fluxes and global climate change.<br />
<strong>The</strong> <strong>Greenland</strong> Sea and Labrador Sea (see Fig. 1) with<br />
adjacent waters are the only regions in the Northern<br />
Hemisphere where deep-water formation occurs. New<br />
evidence shows that this process appears to be highly<br />
variable (e.g. Sy et al. 1997). Thus, meltwater production<br />
and iceberg calving from the Inland Ice margin of<br />
West <strong>Greenland</strong> may play a crucial role in controlling<br />
deep-water formation, notably in the Labrador Sea.<br />
In order to examine the sensitivity of the Inland Ice<br />
margin to climate change, the UK Natural Environment<br />
Research Council (NERC) has since 1998 supported a<br />
project coordinated by Durham University. <strong>The</strong> project<br />
has included both land-based studies focusing on postglacial<br />
sea-level rise and the regional ice sheet history<br />
since the last glaciation as well as offshore investigations.<br />
While the Institute of Geography, University of<br />
Copenhagen, is a project partner for the onshore investigations,<br />
the Geological Survey of Denmark and<br />
<strong>Greenland</strong> (GEUS) has contributed with marine geological<br />
work and expertise. In summer 1999 a 10-day<br />
cruise was carried out with the R/V Porsild from the<br />
Arctic Station in Qeqertarsuaq/Godhavn. During this<br />
cruise short sediment cores and surface sediment were<br />
collected, and hydrographic measurements were also<br />
made (Lloyd et al. 1999). With financial support from the<br />
Danish Natural Science Research Council, a further cruise<br />
was carried out by the R/V Dana from 3 to 6 August 2000.<br />
<strong>The</strong> objective was to collect longer piston cores for the<br />
study of late Quaternary palaeo-oceanographic changes<br />
in the Disko Bugt area, in particular with respect to meltwater<br />
and iceberg fluxes from the Inland Ice. In addition,<br />
relevant high-resolution shallow seismic information<br />
was to be obtained. On this occasion, a 12 m piston<br />
coring system newly acquired by GEUS was successfully<br />
operated from R/V Dana for the first time.<br />
In this article the main results from the R/V Dana<br />
cruise are reported, as well as some of the previous findings<br />
from the 1999 cruise with R/V Porsild. In addition,<br />
some of the preliminary results from post-cruise laboratory<br />
work are referred to, amongst others that by the<br />
Baltic Sea Research Institute in Warnemünde, Germany.<br />
Regional setting and previous work<br />
Water depth in the western and eastern part of Disko<br />
Bugt is generally between 200 m and 400 m. This area<br />
has a generally very rugged sea floor, with frequent<br />
outcrops of Palaeogene rocks, hummocky glacial<br />
deposits, and widespread evidence of iceberg scouring<br />
(Brett & Zarudzki 1979). An up to 990 m deep valley<br />
(Egedesminde Dyb, see Fig. 1) extends across Disko Bugt<br />
from the area between Kronprinsen Ejland and Hunde<br />
Ejland to the shelf edge further to the south-west, where<br />
a fan system is found (Zarudzki 1980). Very little is<br />
known about the late Quaternary palaeo-oceanographic<br />
development of the area. During the last glaciation a<br />
major outlet glacier from the Inland Ice probably covered<br />
large parts of Disko Bugt (Ingólfsson et al. 1990;<br />
Bennike et al. 1994). Holocene sedimentary and hydrographic<br />
conditions in fjords at the west coast of Disko<br />
have recently been described by Gilbert et al. (1998)<br />
and Øhlenschlæger (2000). <strong>The</strong> latter demonstrated a<br />
climate warming at the beginning of the medieval period<br />
at around A.D. 1020. Hydrographic measurements in<br />
Disko Bugt show that relatively low (< 34‰) salinities<br />
prevail in the upper c. 150 m of the water column<br />
(Lloyd et al. 1999). A much thicker low-salinity surface<br />
layer due to meltwater discharge is found in the fjords<br />
around Disko Bugt (Fig. 2) .<br />
As raised beaches and archaeological sites of palaeo-<br />
Eskimo cultures are abundant around Disko Bugt, these<br />
Geology of <strong>Greenland</strong> Survey Bulletin 189, 41–47 (2001) © GEUS, 2001<br />
41
54˚<br />
01–06<br />
Sample location, R/V Porsild cruise 1999<br />
Core station 1–6, R/V Dana cruise 2000<br />
CHIRP tracks (code numbers SNF00-01–06), R/V Dana cruise 2000<br />
70˚<br />
52˚<br />
50˚<br />
70˚<br />
DISKO<br />
INLAND ICE<br />
Baffin Bay<br />
50 km<br />
GS<br />
<strong>Greenland</strong><br />
69˚<br />
Qeqertarsuaq/<br />
Godhavn<br />
Kronprinsen<br />
Ejland<br />
Egedesminde Dyb<br />
2<br />
02<br />
3<br />
Hunde<br />
Ejland<br />
Disko Bugt<br />
4<br />
5<br />
05<br />
1,6<br />
01<br />
03,04<br />
06<br />
5 4<br />
Ilulissat/<br />
Jakobshavn<br />
Kangersuneq<br />
J. Isfjord<br />
J. Isbræ<br />
69˚<br />
LS<br />
54˚<br />
52˚<br />
50˚<br />
Fig. 1. Location of the sediment coring stations and CHIRP sub-bottom profiling tracks in Disko Bugt 1999 and 2000. <strong>The</strong> tracks SNF00-<br />
01–SNF00-06 have been abbreviated to 01, 02, etc. <strong>The</strong> coring stations 1 to 6 (DA00_0 code omitted) are indicated by large red dots,<br />
while smaller, unlabelled dark blue dots show the position of the hydrographic and sediment sampling stations occupied during the<br />
cruise with R/V Porsild in 1999. Coring stations 4 and 5 are located in the fjord Kangersuneq, where hydrographic measurements and<br />
other work were carried out in 1999 (see Fig. 2). J. Isfjord: Jakobshavn Isfjord; J. Isbræ: Jakobshavn Isbræ; GS: <strong>Greenland</strong> Sea;<br />
LS: Labrador Sea. <strong>The</strong> labelled arrows indicate: (4) the location of the CHIRP record illustrated in Fig. 4; and (5) the position of the<br />
piston core DA00-06 of which GEOTEK logging profiles are shown in Fig. 5.<br />
onshore areas have been the subject of a large number<br />
of studies dealing with relative sea-level changes<br />
and glacio-isostatic adjustment. Moreover, Jakobshavn<br />
Isbræ, which is the fastest moving tidally controlled<br />
glacier in the world (Clarke & Echelmeyer 1996), has<br />
been the subject of numerous studies dealing with ice<br />
margin fluctuations since the last glaciation. It is generally<br />
believed that the ice sheet retreated from the<br />
shelf in two stages (Funder & Hansen 1996). After a first<br />
rapid retreat, the later deglaciation stage was much<br />
slower to reach its maximum position inland, i.e. > 15<br />
km behind the present margin, in mid-Holocene times<br />
(Weidick et al. 1990). At the beginning of the<br />
Neoglaciation, around 4000 B.P., the Inland Ice readvanced,<br />
and at the end of the Little Ice Age (LIA)<br />
Jakobshavn Isbræ attained its maximum extension with<br />
a frontal position about 25 km west of its present margin<br />
(Weidick 1992). Regional sea-level changes, possibly<br />
related to a crustal response to Neoglaciation, have<br />
been reported by Rasch & Jensen (1997) and Long et al.<br />
42
0<br />
0<br />
–50<br />
–50<br />
–100<br />
–100<br />
–150<br />
–150<br />
Depth (m)<br />
–200<br />
–200<br />
–250<br />
–250<br />
–300<br />
–300<br />
–350<br />
–350<br />
0 2 4 6 8 31.4 32.2 33 33.8 34.6<br />
Temperature (°C)<br />
(1999). Studies on the south-east coast of Disko have<br />
demonstrated 3–4 transgressional stages within the past<br />
2500 years, with the latest having occurred around the<br />
14th–15th and 16th–17th centuries (Rasch & Nielsen<br />
1995).<br />
Work at sea – R/V Dana<br />
Salinity (‰)<br />
Fig. 2. CTD (conductivity/temperature/depth) profile illustrating<br />
temperature and salinity (conductivity) in the fjord Kangersuneq<br />
near the site of the cores DA00-04 and -05. <strong>The</strong> profiles show<br />
the presence of a thick (c. 275 m) low-salinity meltwater layer<br />
overlying saline bottom waters from Disko Bugt. Each diagram<br />
displays two profiles showing minor, fine-scale differences in<br />
temperature and salinity measured by the probe on its way to<br />
and from the bottom.<br />
With ice-sheet dynamics and their relationship to ocean<br />
climate as underlying rationale, the present study primarily<br />
focuses on the eastern part of Disko Bugt. Prior<br />
to the 1999 Porsild cruise, archive seismic data from the<br />
Fig. 3. <strong>The</strong> outboard cradle on R/V Dana with the 12 m piston<br />
corer, near the coring site off Jakobshavn Isfjord. Photo: John<br />
Boserup.<br />
Westmar Project (Brett & Zarudzki 1979) had been studied<br />
for selecting potential (shallow) coring sites. From<br />
this pre-cruise archive study it appeared that relatively<br />
large accumulation areas of late glacial and Holocene<br />
sediments are mainly found in the easternmost part of<br />
Disko Bugt. One exception to this is the north-easterly<br />
extension of the Egedesminde Dyb in western Disko Bugt<br />
(Fig. 1). <strong>The</strong> archive seismic data indicate the presence<br />
of a > 200 ms TWT (Two-Way Travel Time) thick infill<br />
of presumed glaciomarine and younger sediments in<br />
the channel. Additional seabed data acquired with R/V<br />
Porsild in 1999 in the area off Jakobshavn Isfjord had<br />
yielded further evidence of a large sediment sheet or fan<br />
west and north of the mouth of this fjord. Preliminary<br />
results of accelerated mass-spectrometry (AMS) 14 C datings<br />
of the short cores from this location (J.M.L., unpublished<br />
data) indicate a clear decrease of the sedimentation<br />
43
N<br />
seabed<br />
S<br />
250 m<br />
Holocene<br />
275 m<br />
10 m<br />
100 m<br />
Fig. 4. CHIRP record from south-eastern Disko Bugt showing the northern, marginal zone of a large sedimentary basin, with an upper<br />
unit of presumed Holocene age divided into two parts by a reflector (blue line), overlying a thick, acoustically laminated sequence<br />
of late Pleistocene to early Holocene age. <strong>The</strong> top of the latter sequence is indicated by the yellow line, while the red line shows<br />
the top of the moraine. <strong>The</strong> location on line 05 is indicated by an arrow (4) in Fig. 1.<br />
rates in a direction away from the mouth of the fjord.<br />
During the same cruise in south-easternmost Disko Bugt<br />
and adjacent fjord system, indications of a large depositional<br />
fan and basin had been found.<br />
During the cruise of R/V Dana in 2000, first priority<br />
was given to collection of a long core from the immediate<br />
vicinity of the ice margin at the mouth of<br />
Jakobshavn Isfjord (Fig. 3) in order to obtain a sedimentary<br />
record of the history of Jakobshavn Isbræ. <strong>The</strong><br />
ice conditions in August 2000 were, however, less<br />
favourable than in 1999, and consequently the coring<br />
site (Fig. 1, station 1/6) had to be located somewhat<br />
further away from the mouth of the fjord. (Note that<br />
the station codes 1 to 6 on Fig. 1 refer to the full core<br />
numbers DA00-01 to DA00-06.) For coring, a newly<br />
acquired 12 m piston corer with an inner liner diameter<br />
of 9.8 cm was used. <strong>The</strong> corer (total weight nearly<br />
2 tons) was deployed with the help of a cradle along<br />
the port side of the vessel (Fig. 3), and coring was carried<br />
out using the port side trawl winch and its (20<br />
mm) steel cable. For surface sediment sampling a<br />
Jonasson box-corer developed at Gothenburg University,<br />
Sweden, was used. In total five stations were occupied<br />
(Fig. 1) and the piston cores collected had lengths ranging<br />
from 8.90 to 11.20 m. Due to the presence of coarse<br />
ice-rafted debris causing coring failure at the first attempt,<br />
the station off Jakobshavn Isfjord had to be occupied<br />
twice (station 1/6). Intensive degassing with sediment<br />
blowing out from the corer during retrieval demonstrated<br />
the presence of large amounts of shallow gas<br />
in sediments from the deep-water stations 2 and 3<br />
located in Egedesminde Dyb.<br />
In addition to coring, shallow seismic sub-bottom<br />
information was obtained with a Datasonics CHIRP<br />
(2–10 kHz) acoustic profiling system. <strong>The</strong> 38 kHz<br />
(Simrad) hull-mounted echo sounder of R/V Dana was<br />
used for analogue bathymetric recording. <strong>The</strong> CHIRP<br />
sub-bottom profiling tracks were run in all areas where<br />
cores were taken (Fig. 1), and in addition in the southeasternmost<br />
part of Disko Bugt. <strong>The</strong> CHIRP data from the<br />
latter area indicate the presence of a large sedimentary<br />
basin and provide acoustic evidence of marked changes<br />
in late Quaternary depositional conditions (Fig. 4). <strong>The</strong><br />
Holocene, assumed to be acoustically characterised by<br />
the uppermost, transparent unit shown on the CHIRP<br />
record, also yields evidence of a change in the sedimentary<br />
regime. This is concluded from the presence<br />
of a distinct reflector which divides the transparent unit<br />
into two parts. Moreover, in the adjacent area to the<br />
north, faulting in late Quaternary sediments indicates<br />
neotectonic activity possibly related to glacio-isostatic<br />
adjustment of the area.<br />
Post-cruise core studies and<br />
preliminary results<br />
Prior to opening of the cores, all core sections were<br />
logged using either a Bartington MS2 device for measuring<br />
magnetic susceptibility (cores DA00-02, -04), or<br />
the GEOTEK multi-sensor core-logger of the Baltic Sea<br />
Research Institute in Warnemünde, Germany. <strong>The</strong> latter<br />
instrument produces core logs for magnetic susceptibility<br />
(MS), GRAPE (gamma ray attenuation porosity<br />
44
C-dia.<br />
(cm)<br />
P-wave velocity (m/s) Gamma density (g/cm 3 ) Magnetic susceptibility (SI) RGB<br />
0.0<br />
8.5 9.0 1475 1500 1525 1.50 1.60 1.70 1.80 1.90 2.00 0 20 40 60 80 50 100 150<br />
1.0<br />
2.0<br />
3.0<br />
Depth in core (m)<br />
4.0<br />
5.0<br />
6.0<br />
7.0<br />
8.0<br />
9.0<br />
Core ID: DA00-06<br />
Fig. 5. GEOTEK logs for core DA00-06 taken off Jakobshavn Isfjord. Location is shown by arrow (5) in Fig. 1. <strong>The</strong> figure shows the<br />
down-core variation of P-wave velocity, GRAPE gamma-ray density, magnetic susceptibility and the RGB (Red/Green/Blue) colour<br />
scanning data. C-dia: Core diameter.<br />
evaluator) density, P-wave velocity, and the RGB<br />
(Red/Green/Blue) digital colour scale. <strong>The</strong> GEOTEK<br />
results for core DA00-06 are illustrated in Fig. 5. After<br />
logging, the cores were opened, visually inspected, and<br />
described. Subsampling was carried out for AMS 14 C dating,<br />
magnetic and mineralogical analyses, grain-size<br />
determination, and micropalaeontological studies including<br />
foraminifera (Durham University, UK), diatoms and<br />
dinoflagellates. Using the surface sediment samples<br />
from the 1999 R/V Porsild cruise, a reference base for<br />
palaeo-oceanographic reconstruction based on the actual<br />
microflora and fauna is about to be completed.<br />
<strong>The</strong> core data shown in Fig. 5 provide evidence for<br />
two major changes in the sedimentary environment off<br />
Jakobshavn Isfjord. <strong>The</strong>se occur at around 1.0 m depth,<br />
and more gradually between 6.5 m and 7.0 m core<br />
depth. From visual inspection of the core, only the distinct<br />
change at around 1.0 m depth is obvious. At this<br />
depth a transition is seen from more mottled and bioturbated<br />
(light) olive-grey sandy mud with coarse icerafted<br />
debris (gravel, pebbles) at the top of the core to<br />
mainly homogeneous grey mud with some silt and very<br />
fine sand below, notably without coarse ice-rafted<br />
debris. This lithological change can be interpreted to<br />
reflect the transition from mainly open water conditions<br />
during summer to a subglacial situation with a floating<br />
glacier over the site. Moreover, we assume that the<br />
latter conditions were characterised by a virtual absence<br />
of warmer, saline (Baffin Bay) bottom water (see Fig. 2),<br />
resulting in very low bottom melting rates and conse-<br />
45
quently almost no ice-rafting. This hypothesis will be<br />
tested by foraminiferal (L.A.P.) and diatom analyses currently<br />
being undertaken. <strong>The</strong> deeper level, more gradual<br />
change is illustrated by higher MS, density and<br />
P-wave velocity, and can probably be related to a general<br />
slight increase of grain size and/or different mineral<br />
input. This is tentatively attributed to the stronger<br />
influence of Jakobshavn Isbræ on near-bottom sediment<br />
transport and deposition, as would be expected<br />
with increased glacier thickness at an early deglaciation<br />
stage.<br />
<strong>The</strong> two cores DA00-04 and -05 taken in the fjord<br />
Kangersuneq in south-easternmost Disko Bugt (Fig. 1)<br />
demonstrate a marked difference in sedimentation rates<br />
between the two sites. This is not unexpected, as echo<br />
sounder profiling during the earlier R/V Porsild cruise<br />
in 1999 had revealed the presence of two sedimentary<br />
basins at different water depths, separated by an interpreted<br />
moraine ridge. <strong>The</strong> lithology of the easternmost<br />
core DA00-04 suggests sedimentation rates that are<br />
markedly lower than those found in core DA00-05. This<br />
conclusion is based on a change at mid-core depth in<br />
core DA00-04 which shows a transition from bioturbated<br />
(light) olive-grey silty mud to homogeneous, mainly<br />
grey silty mud with occasional sand stringers. <strong>The</strong> latter<br />
lithology is concluded to be indicative of a subglacial<br />
or proximal ice-margin environment with low<br />
bottom melting rates, as coarse ice-rafted material is<br />
virtually absent. <strong>The</strong> core DA00-05 contains bioturbated<br />
sediment throughout the core, and its sediment is comparable<br />
with the sediment type of the upper part of core<br />
DA00-04. This suggests a depositional environment with<br />
continuous advection of well-ventilated (saline) bottom<br />
water from Disko Bugt (Baffin Bay) and the absence<br />
of a permanent ice cover.<br />
<strong>The</strong> lithologies of the cores DA00-02 and -03 taken<br />
from Egedesminde Dyb show a non-oxic sub-bottom<br />
environment below an oxidised, 2–3 cm thick surface<br />
layer. This is in contrast to observations in the other cores,<br />
in which sediments appear to be oxic. <strong>The</strong> sediments<br />
retrieved from Egedesminde Dyb are mottled and burrowed<br />
silty clays. Noteworthy are 2–4 cm thick, rhythmically<br />
alternating lighter and darker coloured intervals<br />
particularly seen in the lower part of the cores. As noted<br />
above, a very high gas content was observed in the cores.<br />
Due to gas expansion during retrieval, the sediment<br />
column of core DA00-03 was disrupted and it shows<br />
large, up to 0.5 m long, void intervals. Otherwise, the<br />
sedimentary structures appear intact, and no disturbance<br />
due to the piston coring process was observed.<br />
Intact sedimentary structures suggest that gas hydrates<br />
are not likely to occur in the sediments cored; if present<br />
these would have caused disturbance of the internal<br />
sediment bedding.<br />
Prior to opening of core DA00-02, pore water and<br />
gas were sampled from the core with a syringe, and large<br />
intact sediment samples were taken for pore water and<br />
solid phase organic matter analyses. <strong>The</strong> analysis of the<br />
syringe gas sample shows the presence of shallow gas<br />
with an elevated (22.2%) methane content, and only<br />
traces (c. 1 ppm) of propane and pentane. <strong>The</strong> measured<br />
pore water chlorinity values deviate only little from<br />
that of normal marine sediment pore water, which confirms<br />
that significant volumes of gas hydrates are unlikely<br />
to occur at the surface or in shallow sub-seabed sediments<br />
of Egedesminde Dyb. Formation of significant<br />
amounts of gas hydrates alter pore-water chlorinity, as<br />
the water fixed in hydrates is less saline. Thus, the shallow<br />
gas may be formed either in situ from the accumulation<br />
of marine organic matter, or may originate<br />
from seepage from depths where conditions within the<br />
relatively thick (> 200 ms TWT) post-glacial sedimentary<br />
sequence may have been particularly favourable for<br />
gas formation. <strong>The</strong> results meanwhile obtained for the<br />
solid phase organic matter content of core DA00-02,<br />
which show organic carbon contents of about 2%, clearly<br />
point to in situ formation as a likely source of the gas.<br />
Concluding remarks<br />
It can be concluded that several cores collected during<br />
the R/V Dana cruise in 2000 have the potential to provide<br />
high-resolution records of Holocene palaeo-oceanographic<br />
changes in Disko Bugt (cores DA00-02, -03, -05).<br />
Moreover, core DA00-05 collected in the fjord Kangersuneq<br />
may also yield information on terrestrial environmental<br />
changes, as for example variations in<br />
freshwater discharge. In addition, diagenesis related to<br />
the formation of shallow gas is a specific issue which<br />
can be studied in cores from Egedesminde Dyb. Preliminary<br />
geochemical analyses suggest a mainly in situ<br />
origin of the gas found in the shallow sub-seabed sediments<br />
of this area. This finding does not, however,<br />
exclude the possible presence of gas hydrates at greater<br />
sub-seabed depth.<br />
<strong>The</strong> cores DA00-04 and DA00-06 both display a sedimentary<br />
record which appears to provide important<br />
information on the deglaciation history of the Inland<br />
Ice of West <strong>Greenland</strong>.<br />
<strong>The</strong> shallow seismic data obtained during the R/V<br />
Dana cruise, as well as the echo sounding and shal-<br />
46
low-core data from the 1999 R/V Porsild cruise, have<br />
shown that future collection of long piston cores at several<br />
other sites could further contribute to better understanding<br />
of the postglacial development of the area.<br />
Acknowledgements<br />
We acknowledge the Danish Natural Science Research Council<br />
who financed the project with R/V Dana. <strong>The</strong> participation of<br />
Durham University was financed through the (UK) National<br />
Environmental Research Council (NERC). We very much appreciate<br />
the excellent collaboration of Peter Østrin, Master of R/V<br />
Dana, and his crew. During this cruise a basic introduction to<br />
piston-corer handling was given by Jack Schilling of the<br />
Netherlands Institute for Sea Research (NIOZ), Texel. Successful<br />
coring would not have been possible without his expertise and<br />
skill, and was carried out together with John Boserup and the<br />
deck crew of R/V Dana. Egon Hansen is thanked for his contribution<br />
in acquiring shallow seismic data.<br />
References<br />
Bennike, O., Hansen, K.B., Knudsen, K.L., Penney, D.N. &<br />
Rasmussen, K.L. 1994: Quaternary marine stratigraphy and<br />
geochronology in central West <strong>Greenland</strong>. Boreas 23, 194–215<br />
Brett, C.P. & Zarudzki, E.F.K. 1979: Project Westmar. A shallow<br />
marine geophysical survey on the West <strong>Greenland</strong> continental<br />
shelf. Rapport Grønlands Geologiske Undersøgelse 87, 27<br />
pp.<br />
Clarke, T.S. & Echelmeyer, K. 1996: Seismic reflection evidence<br />
for a deep subglacial trough beneath Jakobshavn Isbrae, West<br />
<strong>Greenland</strong>. Journal of Glaciology 141(42), 219–232.<br />
Funder, S. & Hansen, L. 1996: <strong>The</strong> <strong>Greenland</strong> ice sheet – a model<br />
for its culmination and decay during and after the last glacial<br />
maximum. Bulletin of the Geological Society of Denmark 42,<br />
137–152.<br />
Gilbert, R., Nielsen, N., Desloges, J. & Rasch, M. 1998: Contrasting<br />
glaciomarine environments of two Arctic fjords on Disko, West<br />
<strong>Greenland</strong>. Marine Geology 147, 63–83.<br />
Ingólfsson, O., Frich, P., Funder, S. & Humlum, O. 1990:<br />
Paleoclimatic implications of an early Holocene glacier advance<br />
on Disko Island, West <strong>Greenland</strong>. Boreas 19, 297–311.<br />
Lloyd, J.M., Kuijpers, A. & Hansen, E. 1999: Marine geological<br />
investigations in Disko Bugt as part of the UK NERC ARCICE<br />
project Late Quaternary Ice Sheet Dynamics in West <strong>Greenland</strong>.<br />
Cruise Report R/V Porsild, 19–30 August 1999, 15 pp. Durham,<br />
UK: Durham University.<br />
Long, A.J., Roberts, D.H. & Wright, M. 1999: Isolation basin stratigraphy<br />
and Holocene relative sea-level change on Arveprinsen<br />
Ejland, Disko Bugt, West <strong>Greenland</strong>. Journal of Quaternary<br />
Science 14, 323–345.<br />
Øhlenschlæger, R. 2000: Recente foraminiferers fordeling og Sen-<br />
Holocæne klimavariationer fra fjordsystemer i det centrale<br />
Vestgrønland, 87 pp. Unpublished cand. scient. thesis,<br />
Geologisk Institut, Aarhus Universitet, Danmark.<br />
Rasch, M. & Jensen, J.F. 1997: Ancient Eskimo dwelling sites and<br />
Holocene relative sea-level changes in southern Disko Bugt,<br />
central West <strong>Greenland</strong>. Polar Research 16(2), 101–115.<br />
Rasch, M. & Nielsen, N. 1995: Coastal morpho-stratigraphy and<br />
Holocene relative sea level changes at Tuapaat, southeastern<br />
Disko Island, central West <strong>Greenland</strong>. Polar Research 14(3),<br />
277–289.<br />
Sy, A., Rhein, M., Lazier, J.R.N., Koltermann, K., Meincke, J.,<br />
Putzka, A. & Bersch, M. 1997: Surprisingly rapid spreading of<br />
newly formed intermediate waters across the North Atlantic<br />
Ocean. Nature 386, 675–679.<br />
Weidick, A. 1992: Jakobshavn Isbræ area during the climatic optimum.<br />
Rapport Grønlands Geologiske Undersøgelse 155, 67–72.<br />
Weidick, A., Oerter, H., Reeh, N., Thomsen, H.H. & Thorning, L.<br />
1990: <strong>The</strong> recession of the Inland Ice margin during the<br />
Holocene climatic optimum in the Jakobshavn Isfjord area of<br />
West <strong>Greenland</strong>. Palaeogeography, Palaeoclimatology,<br />
Palaeoecology 82, 389–399.<br />
Zarudzki, E.F.K. 1980: Interpretation of shallow seismic profiles<br />
over the continental shelf in West <strong>Greenland</strong> between latitudes<br />
64° and 69°30´N. Rapport Grønlands Geologiske Undersøgelse<br />
100, 58–61.<br />
Authors’ addresses<br />
A.K., J.B.J., K.G.J. & T.L., Geological Survey of Denmark and <strong>Greenland</strong>, Thoravej 8, DK-2400 Copenhagen NV, Denmark. E-mail:<br />
aku@geus.dk<br />
J.M.L. & L.A.P., Department of Geography, Durham University, Science Laboratories, <strong>South</strong> Road, Durham DH1 3LE, UK.<br />
R.E., M.M. & B.S., Institute for Baltic Sea Research, Seestrasse 15, D-18119 Warnemünde, Germany.<br />
47
Palaeolimnological investigation of atmospheric pollution<br />
in the Søndre Strømfjord region, southern West<br />
<strong>Greenland</strong>: accumulation rates and spatial patterns<br />
Richard Bindler, N. John Anderson, Ingemar Renberg and Carola Malmquist<br />
High-latitude ecosystems are inherently sensitive to natural<br />
environmental stress as a result of extreme seasonal<br />
variations in light and temperature, nutrient limitations,<br />
as well as other physical and chemical characteristics;<br />
consequently, these regions are quite vulnerable to the<br />
addition of pollutant stress. <strong>The</strong>re is a poor understanding<br />
of spatial and temporal patterns of atmospheric<br />
pollution in the Arctic, because of the lack of<br />
monitoring stations and networks for current and past<br />
atmospheric deposition. Today, however, the Arctic is<br />
recognised as an important focus for long-range transport<br />
of contaminants, particularly from strong air flows<br />
which carry airborne pollutants from industrial regions<br />
at lower latitudes, e.g. heavy metals and persistent<br />
organic pollutants (POPs). A diverse range of anthropogenic<br />
pollutants has been shown to be present across<br />
much of the region (Aarkrog et al. 1997; AMAP 1998).<br />
Of particular importance are compounds, such as mercury<br />
and POPs, which present a risk to native fauna and<br />
also inhabitants. It is hypothesised for some volatile<br />
organic compounds, as well as possibly for mercury,<br />
that there may be a latitudinal fractionation that contributes<br />
to the continued mobilisation of these compounds<br />
from warmer to colder climates, where they are<br />
ultimately deposited and stored (Wania & Mackay 1993).<br />
Experimental data and limited field research support this<br />
‘cold-condensation’ hypothesis, at least for some POPs<br />
(Blais et al. 1998).<br />
Many areas of the Arctic, especially <strong>Greenland</strong>, are<br />
poorly represented in the scattered sampling programs<br />
that have so far been undertaken. Time-series data are<br />
even more limited, resulting in great uncertainty over<br />
the temporal trends of environmental contamination. A<br />
specific gap identified in arctic research is the lack of<br />
60°<br />
56°<br />
52°<br />
48°<br />
44°<br />
40°<br />
53°<br />
52° 51° 50°<br />
200 km<br />
Sisimiut<br />
Søndre<br />
Strømfjord<br />
Inland<br />
Ice<br />
<strong>Greenland</strong><br />
Kangerlussuaq<br />
69°<br />
66°<br />
Sisimiut<br />
45–50<br />
55–67<br />
38–44<br />
B<br />
C<br />
A<br />
Kangerlussuaq 24–26 19–22<br />
D<br />
F E 31<br />
68–76<br />
G H 1–8<br />
16<br />
Søndre<br />
Strømfjord<br />
J<br />
K<br />
Inland<br />
Ice<br />
67°<br />
32<br />
63°<br />
51–54<br />
66°30′<br />
A<br />
Labrador<br />
Sea<br />
60°<br />
B<br />
0 50 km<br />
Fig. 1. A: Location of the Søndre Strømfjord region, southern West <strong>Greenland</strong>. B: <strong>The</strong> study lakes east and west of Kangerlussuaq<br />
cored in May 2000 are indicated by letters (A–H and J, K). Numbered lakes and groups of lakes refer to previously sampled lakes<br />
(Anderson et al. 1999), from which sediment samples were included in the analyses (• = individual lake; ■ = group of lakes).<br />
48<br />
Geology of <strong>Greenland</strong> Survey Bulletin 189, 48–53 (2001) © GEUS, 2001
long-term retrospective time trends. A particular weakness<br />
in studies of time trends is the general assumption<br />
that natural, non-polluted conditions existed prior<br />
to the mid-1800s. Analyses of lake sediments and peat<br />
deposits in Europe (Renberg et al. 1994, 2000; Shotyk<br />
et al. 1998; Brännvall et al. 1999) and <strong>Greenland</strong> ice cores<br />
(Hong et al. 1994) have revealed an approximately<br />
3500-year history for lead (Pb) pollution in the northern<br />
hemisphere, which contradicts the assumption of<br />
the mid-1800s representing ‘background’ levels.<br />
In <strong>Greenland</strong>, studies of pollutants in the ice-free<br />
terrestrial margin have focused largely on synoptic surveys<br />
to identify and quantify pollutants in the contemporary<br />
environment. Temporal changes in pollutant<br />
deposition and accumulation in the terrestrial environment<br />
are not well established. Lake sediments provide<br />
an ideal archive to examine many anthropogenic environmental<br />
pollutants, as well as to assess the range of<br />
natural variability of compounds or elements such as<br />
lead and mercury. <strong>The</strong> Søndre Strømfjord region (Fig. 1)<br />
offers excellent opportunities for palaeolimnological<br />
research because of the lack of cultural disturbance<br />
and, more importantly, because of the extensive availability<br />
of data from limnological and palaeolimnological<br />
research programs that have been carried out in the<br />
region since 1996 (Anderson et al. 1999).<br />
<strong>The</strong> long SW–NE-trending fjord around which this<br />
study is centred is known by both the Danish name,<br />
Søndre Strømfjord and the <strong>Greenland</strong>ic name,<br />
Kangerlussuaq. In this paper we follow the convention<br />
of using ‘Søndre Strømfjord’ for the fjord and<br />
‘Kangerlussuaq’ for the airport at the head of the fjord<br />
(Fig. 1).<br />
in lakes adjacent to the ice margin to assess the<br />
hypothesis of ‘cold condensation’, i.e. the progressive<br />
revolatilisation of organic pollutants from warmer<br />
to colder climates.<br />
4. Establish which persistent organic pollutants (POPs)<br />
are present in recent lake sediments and assess temporal<br />
changes in their accumulation.<br />
In the case of the first two aims, sediment samples<br />
collected in previous field campaigns during 1996–1999<br />
can be used. Field work in 2000 was initiated specifically<br />
to collect fresh sediment samples for POP analyses<br />
and to address the ‘cold condensation’ hypothesis.<br />
Temporal changes in atmospheric<br />
pollutants<br />
Analysis of lake sediment cores is a useful method of<br />
documenting the historical loading of atmospheric pollutants<br />
to remote areas, such as mercury, lead and<br />
organic pollutants. <strong>The</strong>se pollutants derive from the<br />
combined effects of direct deposition to the lake surface<br />
and run-off from the catchment area. Palaeolimnological<br />
researchers have used lake sediments to reconstruct<br />
site-specific as well as regional pollution histories in order<br />
to determine the onset of atmospheric pollution, the rates<br />
0<br />
Pb µg g -1 Hg ng g -1<br />
0 1 2 3 0 50 100 150 200<br />
5<br />
Main aims<br />
<strong>The</strong> aims of the present project in the Søndre Strømfjord<br />
region of southern West <strong>Greenland</strong> (Fig. 1) are to:<br />
1. Assess the onset of mercury and lead pollution and<br />
their accumulation rates in selected lake sediments.<br />
2. Assess the spatial patterns and enrichment rates of<br />
mercury and lead pollution in sediments of lakes<br />
along a west to east transect in the Søndre Strømfjord<br />
region employing surface and bottom samples from<br />
short cores of recent sediments (c. 15–35 cm in<br />
length).<br />
3. Supplement archived sediment samples with the collection<br />
of new lake sediment cores along an altitudinal<br />
transect (c. 150 to 950 m above sea level) and<br />
Sediment depth (cm)<br />
10<br />
15<br />
20<br />
25<br />
30<br />
conc.<br />
ratio<br />
1.2 1.3 1.4 1.5<br />
206<br />
Pb/ 207 Pb<br />
Fig. 2. Profiles of lead (Pb concentrations and 206 Pb/ 207 Pb) and<br />
mercury (Hg) in sediment cores from Lake 32 (Nunatak lake)<br />
(Bindler et al. 2001a, b).<br />
49
of increase of individual pollutants and spatial patterns<br />
of deposition. Landers et al. (1998) summarised the<br />
most reliable mercury reconstructions from lake sediment<br />
cores from arctic and boreal ecosystems to evaluate<br />
spatial patterns at high latitudes on a broad scale.<br />
Analyses of mercury and lead in 210 Pb-dated cores<br />
from a few lakes in the Søndre Strømfjord area (Lakes<br />
16, 32, 53 and 70) show patterns generally consistent<br />
with data from elsewhere in the Arctic and the boreal<br />
zones. Cores from all four lakes show clear evidence<br />
of pollution from industrial sources, with enhanced<br />
lead and mercury concentrations and accumulation<br />
rates in near surface sediments relative to deeper sediments<br />
(Fig. 2). In the case of mercury, analysed using<br />
cold vapour atomic fluorescence spectrometry (CVAFS),<br />
the sediment records indicate increased mercury accumulations<br />
of about two to three times that determined<br />
for background sediment layers (Bindler et al. 2001b).<br />
<strong>The</strong> current and historic mercury accumulation rates in<br />
the <strong>Greenland</strong> lakes are in the same range as those<br />
reported for lakes from the Canadian Arctic, where<br />
comparable lakes had mercury accumulation rates of<br />
1–5 µg m -2 yr -1 in deeper sediments, which increased<br />
to 5–8 µg m -2 yr -1 in surface sediments (Landers et al.<br />
1998). <strong>The</strong> <strong>Greenland</strong> sediments indicate an initial<br />
increase in the mercury accumulation rate during the<br />
mid-1800s (Bindler et al. 2001a), which is generally<br />
consistent with the onset of mercury pollution in North<br />
America and northern Europe. In one lake (Lake 32;<br />
Fig. 2), located on a nunatak c. 5 km within the ice margin,<br />
there is an indication of a slightly earlier mercury<br />
pollution signal, prior to 1800, based on extrapolation<br />
of the 210 Pb chronology (Bindler et al. 2001b).<br />
For lead, analyses of the sediment cores in lakes<br />
around Søndre Strømfjord also included stable lead isotopes<br />
( 204 Pb, 206 Pb, 207 Pb and 208 Pb). Lead isotopes make<br />
it possible to infer the provenance of the pollution lead<br />
in the environment, based on the fact that lead ores have<br />
characteristic lead isotopic compositions that are typically<br />
distinct from the isotopic compositions of soils<br />
and bedrock. Consequently, isotope analyses have<br />
become an effective method in environmental studies<br />
to quantify pollution lead contributions and to infer<br />
specific sources for the pollution lead. For the sediment<br />
cores from the Søndre Strømfjord region, there is<br />
a large decline in the 206 Pb/ 207 Pb ratio coincident with<br />
increased lead concentrations upwards in the cores<br />
(Fig. 2) clearly indicating that the increased concentrations<br />
are a direct result of an increasing input of pollution<br />
lead to these lakes (Bindler et al. 2001b). Based<br />
on an isotope mixing model, the lead pollution can be<br />
demonstrated to derive from western Europe and Russia,<br />
and not from North America (Bindler et al. 2001b).<br />
Spatial patterns of Hg and Pb pollution<br />
Analyses of sediment samples from earlier field campaigns<br />
in the Søndre Strømfjord region (individual lakes<br />
and lake groups numbered in Fig. 1) revealed some<br />
trends on the spatial pattern of atmospheric pollution.<br />
<strong>The</strong>se samples represented the top (0–1 cm) and bottom<br />
(a 1 cm interval at c. 15–35 cm depth) of gravity<br />
cores from lakes north of Søndre Strømfjord. As expected<br />
from the steep gradient for annual precipitation, with<br />
the highest annual precipitation at the coast and declining<br />
rates inland, the unsupported 210 Pb fluxes and inventories<br />
in the lake sediments were higher at the coast<br />
and lower inland (Bindler et al. 2001b). Predictably,<br />
pollution lead inventories followed a similar pattern:<br />
higher lead concentrations and a stronger influence on<br />
the isotope composition by pollution sources on the surface<br />
lake sediments nearer to the coast together with<br />
larger pollution lead inventories in whole cores (i.e.<br />
the total amount of pollution lead accumulated in the<br />
sediment core). <strong>The</strong> close relationship between the gradient<br />
for 210 Pb fluxes and pollution lead inventories<br />
supports the inference that the differences between<br />
sites is largely due to variations in rainfall.<br />
In contrast, the mercury analyses of the lake sediments,<br />
both cores and the top/bottom sample pairs,<br />
revealed an unexpected reverse trend. While the sediments<br />
generally revealed a two- to three-fold enrichment<br />
for mercury in surface sediments relative to the<br />
deeper sample, there was a tendency towards greater<br />
enrichments in the vicinity of the ice margin (Bindler<br />
et al. 2001a). <strong>The</strong> lakes within about 20 km of the icesheet<br />
margin had higher mercury concentration enrichments,<br />
from three to as much as ten times greater than<br />
the background concentration. This region corresponds<br />
approximately with the area most influenced by the<br />
meteorology of the ice margin, e.g. the katabatic winds<br />
that flow down off the ice and over the adjacent tundra,<br />
and suggests the possibility of a ‘cold condensation’<br />
effect on mercury contents.<br />
Field work in 2000<br />
During May 2000, sediment cores were collected from<br />
eleven lakes in two areas around Kangerlussuaq.<br />
Sediment cores were collected with a gravity corer. One<br />
50
Fig. 3. Sampling at Lake H in May 2000.<br />
<strong>The</strong> lake is at c. 150 m a.s.l., well below<br />
the snowline.<br />
area (Lakes A–H on Fig. 1; ~ 67º10′N, 57º30′W) constituted<br />
a 35 km long transect of eight lakes along an<br />
elevation gradient from c. 150 m to 950 m above sea<br />
level. A second group of three lakes (a new core from<br />
Lake 21 and new Lakes J and K) were each located<br />
within a few km of the ice-sheet margin, east of<br />
Kangerlussuaq. One lake (Lake K, 67º02.6′N, 50º09.9′W)<br />
is situated immediately above an ice tongue whose<br />
meltwater drains into the head of Søndre Strømfjord.<br />
At each lake, two to three short sediment cores were<br />
collected and sectioned in the field. One core was sectioned<br />
into 1 cm intervals and stored in glass containers<br />
for the analysis of persistent organic pollutants. A<br />
second core was sectioned into a surface sediment sample<br />
(0–1 cm), a bulk sample (9–10 cm), and a bottom<br />
2 cm interval taken near the base of the core (the cores<br />
were c. 20–30 cm in length). In most lakes a third core<br />
was collected and sectioned into 0.5 cm slices from<br />
0–10 cm, and 1 cm slices down to the base of the core,<br />
for detailed stratigraphic analyses of mercury and lead.<br />
To make assessments of bulk pollution, the background<br />
concentrations (the concentration at depth of the compound<br />
of interest, e.g. mercury) were subtracted from<br />
the concentrations in the surface and bulk samples.<br />
Mercury pollution inventories (mass per unit area) can<br />
then be compared between sites, and their differences<br />
assessed in light of the altitude of the lakes.<br />
<strong>The</strong> eight lakes west of Kangerlussuaq (A–H) were<br />
selected as an altitudinal substitution for a climatic gradient,<br />
and to limit regional variations in geology and<br />
precipitation as much as possible. <strong>The</strong> use of this altitude-for-climate<br />
substitution can be illustrated by the<br />
situation in May 2000; the snowline was at c. 500 m<br />
above sea level, such that one lake was situated at the<br />
snowline, two well above and the remaining five lakes<br />
below the snowline (Fig. 3). Two of the lower elevation<br />
lakes were found to have laminated sediments and<br />
high conductivities, similar to other studied lakes in the<br />
area at the head of the fjord (Anderson et al. 1999).<br />
<strong>The</strong> sediments from the second group of lakes (21,<br />
J and K) east of Kangerlussuaq were sampled to further<br />
assess the ‘ice-margin’ effect (Bindler et al. 2001a).<br />
Lake K is adjacent to the margin of the Inland Ice, while<br />
Lakes 21 and J are within 5 km. Studies of meteorological<br />
conditions at the Inland Ice margin during the <strong>Greenland</strong><br />
Ice Margin Experiment (GIMEX) in June and July 1991<br />
observed that the energy balance at the margin was<br />
strongly influenced by the radiative differences of the<br />
ice and the adjacent tundra (Fig. 4; Duynkerke & van<br />
den Broeke 1994). <strong>The</strong> temperature gradient from the<br />
ice to tundra in the summer produces strong katabatic<br />
winds that flow down off the ice sheet and out over<br />
the tundra. <strong>The</strong> region most strongly affected by this<br />
thermal forcing coincides geographically with the lakes<br />
that showed the highest mercury enrichments. Detailed<br />
stratigraphic analyses from the new study lakes will<br />
complement the analyses of archived samples.<br />
Initial results of high-resolution gas chromatography/mass<br />
spectrometry (HR GC/MS) analyses of the<br />
lake sediments indicate low concentrations for polychlorinated<br />
biphenyls (PCBs) (c. 0.5–3 nanogram g -1 for<br />
total PCBs; individual compounds are measured at<br />
picogram g -1 levels) that are consistent with other regions<br />
of the Arctic (e.g. northern Canada). However, analy-<br />
51
Fig. 4. <strong>The</strong> region along the ice margin (as here north-west of Kangerlussuaq) is strongly affected by the radiative differences of the<br />
glacier and the adjacent tundra (Duynkerke & van den Broeke 1994), which may influence processes that affect mercury accumulation<br />
and retention in lakes in this region. Air temperatures above the surface of the Inland Ice in the background of the photograph are<br />
just above freezing in the summer, whereas temperatures above the adjacent tundra (foreground) may reach 15ºC. It is this temperature<br />
gradient that periodically gives rise to strong katabatic winds flowing from east (the ice) to west (the land). As described in the text,<br />
these strong environmental (temperature, radiation) gradients from ice to land may influence mercury accumulation and retention in<br />
the lakes on the tundra. <strong>The</strong> lake in the middle foreground is c. 250 m across.<br />
ses of some sediments, particularly from the lakes with<br />
laminated sediments and high-water conductivities,<br />
have been complicated by the high sulphur contents<br />
which necessitated pre-treatments. Additional improvements<br />
in these procedures have contributed to a lowering<br />
of the detection limit for persistent organic<br />
pollutants in sediment samples and reductions in sample<br />
size, which permits better temporal resolution in sediment<br />
cores. Assessment of analyses of the samples<br />
collected in May 2000 are in progress, which includes<br />
estimations of accumulation rates and cumulative inventories<br />
of PCBs and polybrominated diphenyl ethers<br />
(PBDEs), a class of widely used flame retardants. <strong>The</strong><br />
results of the sampling in <strong>Greenland</strong> in May 2000 will<br />
be compared with those of a similar project using lake<br />
sediment cores taken in the northern Swedish mountains.<br />
Conclusions<br />
Ongoing research on the limnology and palaeolimnology<br />
of lakes in the Søndre Strømfjord region, which is<br />
focused largely on aspects related to climate change,<br />
has provided a solid foundation for additional studies<br />
on environmental change, such as assessments of pollution<br />
inputs. In addition to contributing to the general<br />
understanding of the distribution of pollutants in the<br />
Arctic, both in terms of the rates of deposition and their<br />
spatial distribution, analyses of lake sediments in the<br />
Søndre Strømfjord region also provide a potential for<br />
assessing climatic processes that may interact with pollutant<br />
deposition and accumulation; such as the ‘cold<br />
condensation’ hypothesis, which contributes to the<br />
continued mobilisation of volatile compounds to the<br />
Arctic.<br />
Acknowledgements<br />
<strong>The</strong> Danish and Swedish Natural Science Research Councils are<br />
gratefully acknowledged for financial support. For other help we<br />
would like to thank Simon Patrick (University College London, UK),<br />
Melanie Leng (Natural Environment Research Council, UK), Peter<br />
Appleby (Environmental Radioactivity Research Centre, University<br />
of Liverpool, UK), Ove Emteryd (Department of Forest Ecology,<br />
Swedish University of Agricultural Sciences, Umeå, Sweden), Mats<br />
Tysklind (Department of Environmental Chemistry, Umeå University,<br />
Sweden), John Munthe and Elsemarie Lord (Swedish Environmental<br />
Research Institute, Gothenberg, Sweden) and the Kangerlussuaq<br />
International Science Support (KISS) facility.<br />
52
References<br />
Aarkrog, A. et al. 1997: AMAP <strong>Greenland</strong> 1994–1996, 788 pp.<br />
Copenhagen: Ministry of Environment and Energy, Danish<br />
Environmental Protection Agency (Arctic Monitoring and<br />
Assessment Programme).<br />
AMAP 1998: Arctic pollution issues, AMAP assessment report,<br />
859 pp. Oslo: Arctic Monitoring and Assessment Programme.<br />
Anderson, N.J., Bennike, O., Christoffersen, K., Jeppesen, E.,<br />
Markager, S., Miller, G. & Renberg, I. 1999: Limnological and<br />
palaeolimnological studies of lakes in south-western <strong>Greenland</strong>.<br />
Geology of <strong>Greenland</strong> Survey Bulletin 183, 68–74.<br />
Bindler, R., Renberg, I., Appleby, P.B., Anderson, N.J. & Rose, N.L.<br />
in 2001a: Mercury accumulation rates and spatial patterns in<br />
lake sediments from West <strong>Greenland</strong>: a coast to ice margin<br />
transect. Environmental Science and Technology 35, 1736–1741.<br />
Bindler, R., Renberg, I., Anderson, N.J., Appleby, P.G., Emteryd,<br />
O. & Boyle, J. 2001b: Pb isotope ratios of lake sediments in<br />
West <strong>Greenland</strong>: inferences on pollution sources. Atmospheric<br />
Environment 35, 4675–4685.<br />
Blais, J.M., Schindler, D.W., Muir, D.C.G., Kimpe, L.E., Donald,<br />
D.B. & Rosenberg, B. 1998: Accumulation of persistent<br />
organochlorine compounds in mountains of western Canada.<br />
Nature 395, 585–588.<br />
Brännvall, M.-L., Bindler, R., Renberg, I., Emteryd, O., Bartnicki,<br />
J. & Billström, K. 1999: <strong>The</strong> Medieval metal industry was the<br />
cradle of modern large-scale atmospheric lead pollution in<br />
northern Europe. Environmental Science and Technology 33,<br />
4391–4395.<br />
Duynkerke, P.G. & van den Broeke, M.R. 1994: Surface energy<br />
balance and katabatic flow over glacier and tundra during<br />
GIMEX-91. Global & Planetary Change 9, 17–28.<br />
Hong, S.M., Candelone, J.P., Patterson, C.C. & Boutron, C.F. 1994:<br />
<strong>Greenland</strong> ice evidence of hemispheric lead pollution 2 millennia<br />
ago by Greek and Roman civilizations. Science 265,<br />
1841–1843.<br />
Landers, D.H., Gubala, C., Verta, M., Lucotte, M., Johansson, K.,<br />
Vlasova, T. & Lockhart, W.L. 1998: Using lake sediment mercury<br />
flux ratios to evaluate the regional and continental dimensions<br />
of mercury deposition in Arctic and boreal ecosystems.<br />
Atmospheric Environment 32, 919–928.<br />
Renberg, I., Wik-Persson, M. & Emteryd, O. 1994: Pre-industrial<br />
atmospheric lead contamination detected in Swedish lake sediments.<br />
Nature 368, 323–326.<br />
Renberg, I., Brännvall, M.-L., Bindler, R. & Emteryd, O. 2000:<br />
Atmospheric lead pollution history during four millennia (2000<br />
BC to 2000 AD) in Sweden. Ambio 29, 150–156.<br />
Shotyk, W., Weiss, D., Appleby, P.G., Cheburkin, A.K., Frei, R.,<br />
Gloor, M., Kramers, J.D., Reese, S. & van der Kamp, W.O. 1998:<br />
History of atmospheric lead deposition since 12,370 14 C yr BP<br />
from a peat bog, Jura mountains, Switzerland. Science 281,<br />
1635–1640.<br />
Wania, F. & Mackay, D. 1993: Global fractionation and cold condensation<br />
of low volatility organochlorine compounds in polar<br />
regions. Ambio 22, 10–18.<br />
Authors’ addresses<br />
R.B., I.R. & C.M., Department of Ecology and Environmental Science, Umeå University, SE-901 87 Umeå, Sweden. E-mail:<br />
rich.bindler@eg.umu.se<br />
N.J.A., Institute of Geography, University of Copenhagen, Øster Voldgade 10, DK-1350 Copenhagen K, Denmark.<br />
53
Determining the date of ice-melt for low Arctic lakes<br />
along Søndre Strømfjord, southern West <strong>Greenland</strong><br />
N. John Anderson and Klaus P. Brodersen<br />
<strong>The</strong> length of ice cover has considerable influence on<br />
the functioning of lake ecosystems, particularly so in<br />
continental and high-latitude regions where lakes freeze<br />
annually. Long-term trends in the length of ice cover<br />
and the date of ice break-up can be related to regional<br />
weather patterns, such as the North Atlantic Oscillation.<br />
It is this relationship to weather patterns that has generated<br />
considerable interest in the use of long-term icerecords<br />
as climate proxies. Although it is reasonable to<br />
assume a relationship between the length of the icefree<br />
period and lake productivity, it is unclear if this relationship<br />
influences the sedimentary record. Whether<br />
these ice-climate interactions can be identified in the<br />
sediment record is important for distinguishing long-term<br />
palaeoclimatic trends from variations in the sediment<br />
record (Anderson et al. 2000).<br />
In the high Arctic, ice cover is often nearly permanent<br />
from year to year and the extent of moating is<br />
important for biological processes. An ice remnant on<br />
a lake during one summer can increase water temperatures<br />
the following spring (Doran et al. 1996). This<br />
increased spring temperature is caused by the remnant<br />
ice trapping heat in the lake together with reduced convective<br />
cooling. As a consequence, this process reduces<br />
the likelihood of two consecutive years with residual<br />
ice. In the low Arctic, where low-altitude lakes are normally<br />
completely ice-free every summer, it is the timing<br />
of the spring ice-melt period and the total length<br />
of the ice-free period that can be important for biogeochemical<br />
processes. For example, the break-up of<br />
the ice is associated with emergence of chironomids and<br />
their mating (Brodersen et al. 2001, this volume) while<br />
prolonged ice-cover and anoxia will influence internal<br />
biogeochemical cycling of nutrients and alkalinity generation.<br />
<strong>The</strong> length of the ice cover period, coupled with<br />
the rapid development of thermal stratification is one<br />
60°<br />
56°<br />
52°<br />
48°<br />
44°<br />
40°<br />
53°<br />
52° 51° 50°<br />
200 km<br />
Sisimiut<br />
Søndre<br />
Strømfjord<br />
Inland<br />
Ice<br />
<strong>Greenland</strong><br />
Kangerlussuaq<br />
69°<br />
66°<br />
Sisimiut<br />
Weather<br />
station<br />
Cameras<br />
74–76<br />
Søndre<br />
Kangerlussuaq<br />
Strømfjord<br />
21<br />
Brayasø and Lake 85<br />
Inland<br />
Ice<br />
67°<br />
63°<br />
78<br />
66°30′<br />
A<br />
Labrador<br />
Sea<br />
60°<br />
B<br />
Weather station<br />
and camera<br />
0 50 km<br />
Fig. 1. A: <strong>The</strong> study area in southern West <strong>Greenland</strong>. B: <strong>The</strong> study area with location of cameras, automatic weather stations and<br />
lakes with thermistor chains. ■ = group of lakes; • = individual lake. Modified from Brodersen & Anderson (2000).<br />
54<br />
Geology of <strong>Greenland</strong> Survey Bulletin 189, 54–58 (2001) © GEUS, 2001
of the reasons why so many lakes in southern West<br />
<strong>Greenland</strong> have laminated sediments (Anderson et al.<br />
2000). At the regional scale the main factors governing<br />
the timing of ice-melt and the length of the ice-free<br />
period are radiation input and air temperature, altitude,<br />
lake area and volume.<br />
<strong>The</strong>re is considerable geographic and inter-annual<br />
variability in the length of ice-free period in lakes (freeze<br />
and break-up date). An analysis of all available data for<br />
time series over 100 years in length from lakes throughout<br />
the world has revealed a trend for freeze dates to<br />
have occurred 5.8 days later per 100 years and breakup<br />
date 6.5 days earlier per 100 years (Magnuson et al.<br />
2000). Determining the date of ice break-up has traditionally<br />
been based on continuous field observations,<br />
some of which cover hundreds of years (e.g. Lake Suwa,<br />
Japan), recorded for cultural or religious as well as scientific<br />
reasons (Magnuson et al. 2000). However, there<br />
are very few data on ice-melt dates for remote lakes,<br />
such as the many thousands in the ice-free area of<br />
southern West <strong>Greenland</strong>. In this project, we follow<br />
the process of ice-melt to the date of final disappearance<br />
of ice (ice-out).<br />
Recent sporadic field observations along Søndre<br />
Strømfjord by the authors indicate that ice-melt occurs<br />
earlier in those lakes closest to the head of the fjord,<br />
largely reflecting the climate gradient in this area (Hasholt<br />
& Søgaard 1976). At the coast, where the summers are<br />
cooler and fog banks reduce radiation input, lakes can<br />
still be completely ice covered with minimal moating,<br />
when ice-melt on the lakes close to the airport at<br />
Kangerlussuaq (Fig. 1) is nearly complete. Previous<br />
field work in this area (Anderson et al. 1999) also indicates<br />
substantial variation from year to year. For example,<br />
in 1998 lakes around the head of the fjord were<br />
largely ice-free by mid-June. <strong>The</strong> following year, 1999,<br />
when mean April–May temperatures were ~ 2ºC lower<br />
than in 1998, ice-melt was still not complete by 1 July.<br />
In this paper, and on Fig. 1, we follow the convention<br />
of referring to the fjord as Søndre Strømfjord and<br />
the airport at the head of the fjord as Kangerlussuaq;<br />
the fjord is also known by its <strong>Greenland</strong>ic name<br />
Kangerlussuaq.<br />
Use of satellite imagery is useful and can cover large<br />
numbers of lakes, but its application can be limited by<br />
cloud cover, resolution – not all the smaller lakes in a<br />
given area are easily visible (Wynne et al. 1996) – and<br />
temporal coverage. As much palaeoclimate work is<br />
based on sediment records from small lake basins, this<br />
lack of information for smaller lakes can be problematical.<br />
It was decided, therefore, to attempt an alternative<br />
approach using automatic cameras and lake-water<br />
temperature dataloggers.<br />
Field activities in 2000<br />
<strong>The</strong> aim of field work in 2000 was to establish local monitoring<br />
systems that could be used to record the date<br />
of ice-out at locations along the climate gradient from<br />
the Inland Ice margin to the coast south of Sisimiut<br />
(Fig. 1). It was hoped that by assembling information<br />
Fig. 2. Downloading data from the<br />
automatic weather station near Lake 78 on<br />
29 August 2000. For location, see Fig. 1B.<br />
55
A<br />
B<br />
B<br />
Fig. 3. Remote-controlled camera overlooking Lakes 74 (A), 75 (B)<br />
and 76 (C). <strong>The</strong> height of the camera and tripod is about 1.4 m.<br />
C<br />
about the date of ice-out and local meteorological conditions<br />
it would be possible to generate a simple empirical<br />
model that could be used to predict future ice-out<br />
dates.<br />
<strong>The</strong> study sites are spread along the climatic gradient<br />
(continental to more maritime) from the Inland Ice<br />
margin to the coast south of Sisimiut. Two lakes close<br />
to the head of the Søndre Strømfjord were sampled<br />
(Lake 4 = Brayasø and Lake 85) together with Lakes 75<br />
and 76, approximately half way along the fjord. <strong>The</strong> most<br />
easterly site was Lake 21, and the most westerly, Lake<br />
78 (Fig. 1B). <strong>The</strong> lakes cover an altitude range from 45<br />
m to 470 m and vary in area from < 10 ha to ~ 140 ha.<br />
Maximum depths range from 14 to 50 m.<br />
<strong>The</strong> main field work in 2000 took place between 23<br />
April and 6 May and consisted of the deployment of<br />
thermistor chains (Brodersen & Anderson 2000), automatic<br />
weather stations and cameras. At five lakes (Lakes<br />
4 = Brayasø, 22, 75, 76, 78; Fig. 1B) chains of thermistors<br />
were deployed (10–12 per lake depending on the<br />
maximum depth). <strong>The</strong>rmistors were set to record water<br />
temperature at hourly intervals. <strong>The</strong>y were attached to<br />
steel wires to reduce the possibility of the ice cutting<br />
them and dropped through a hole cut in the ice. <strong>The</strong><br />
automatic weather station (AWS) between Lakes 75 and<br />
76 was upgraded (to measure solar radiation), and a<br />
similar system was erected adjacent to Lake 78 near<br />
the coast (Fig. 2). At three sites (Fig. 1B), an automatic<br />
digital camera was set up overlooking an individual<br />
lake (i.e. Lake 78) or groups of lakes (i.e. close to<br />
Brayasø and Lake 85, and overlooking Lakes 74–76;<br />
Fig. 3). Standard digital cameras were placed in a waterproof<br />
housing, and the cameras were set to take a picture<br />
at noon every day using an attached electronic<br />
timer (Fig. 3). All systems were in operation by 6 May.<br />
With this monitoring system, it was hoped that it would<br />
be possible to correlate exactly the date of ice-out<br />
(derived from photographs) with changing water temperature<br />
and local meteorological data.<br />
A return visit to the study sites was made in August<br />
and AWS data and the camera images were downloaded<br />
in the field (Fig. 2). At the same time the thermistor chains<br />
were changed, and then returned to the lakes. Although<br />
the intention of the project was to record data over two<br />
ice-melt periods, this late summer visit meant that if the<br />
lake-water temperature thermistor chains were lost during<br />
the winter of 2000–2001, data for the first ice-melt<br />
period was secure. Unfortunately, it was found that one<br />
camera had failed to record any images and another took<br />
only random images.<br />
<strong>The</strong> photographic sequence at Lakes 75 and 76<br />
showed that the final break-up of the ice is very rapid.<br />
<strong>The</strong> water temperature record derived from the thermistors<br />
indicates that there is a rapid increase in temperature<br />
(c. 5ºC over a few hours) associated with the<br />
final break-up of the ice (Fig. 4B). This temperature rise<br />
is, presumably, due to the mixing of the water column<br />
and transfer of ‘warmer’ water (c. 4–5ºC) from depth.<br />
Over the ~ 10 days prior to the final break-up of the<br />
ice there is a gradual warming of the surface water<br />
under the ice due to either radiative heating as the ice<br />
thins (and day length increases) and/or the transfer of<br />
warmer water from the littoral moats. Using the rapid<br />
rise in temperature as an indication of ice break-up we<br />
were able to estimate the dates of ice-out at the other<br />
lakes. <strong>The</strong> earliest lake to be ice-free in 2000 was Brayasø<br />
(Lake 4) on 6 June. This lake was followed closely by<br />
Lake 85 (which drains into Brayasø) on 7 June and<br />
Lake 76 on 9 June. Lake 75, although immediately adjacent<br />
to Lake 76 is much larger (144 ha versus 8.6 ha)<br />
56
Fig. 4. A: Overlooking Lakes 75 (still icecovered)<br />
and 76 showing the effect of<br />
lake area and depth on ice break-up.<br />
Camera on hill top (arrow) and camp<br />
site (arrow) between lakes with an interdistance<br />
of 1.56 km (15 June 2000). For<br />
location, see Fig. 1B. B: Plots of surfacewater<br />
temperature for all lakes showing<br />
the very clear rise in temperature<br />
associated with the final break-up of the<br />
ice and mixing of the water column.<br />
Lake 4 = Brayasø.<br />
Lake 75<br />
Lake 76<br />
A<br />
Surface-water temperature (°C)<br />
20<br />
18<br />
16<br />
14<br />
12<br />
10<br />
8<br />
6<br />
4<br />
Lake 4<br />
Lake 75<br />
Lake 76<br />
Lake 78<br />
Lake 85<br />
B<br />
2<br />
0<br />
6/6 9/6 18/6 25/6<br />
14/5 12/7<br />
Observation period<br />
and as a result ice-out was delayed by nearly 10 days<br />
(18 June 2000; Fig. 4A). Finally, as with our previous<br />
field experience, the coastal site (Lake 78) was the last<br />
to be ice-free on 25 June 2000. We were not able to<br />
retrieve the thermistor string from Lake 21 during our<br />
late August field trip and so the ice-out date there is<br />
unknown. <strong>The</strong> lake lies close to the Inland Ice margin<br />
and it remains to be seen whether there is a pronounced<br />
effect associated with the strong meteorological gradient<br />
in this area (Hasholt & Søgaard 1976).<br />
One of us (K.P.B.; see Brodersen et al. 2001, this volume)<br />
was present in the field at the time of the breakup<br />
of the ice on Lake 76 and field observations confirm<br />
the rapidity and timing of the ice break-up at this lake<br />
(Fig. 4A). Although only one lake, these field observations<br />
lend support to the reliability of the camera results.<br />
<strong>The</strong> use of remote-controlled cameras offers a relatively<br />
cheap means of tracking environmental change visually<br />
on a seasonal basis.<br />
Conclusion<br />
Understanding ice phenology in West <strong>Greenland</strong> is vital<br />
to our understanding of long-term lake-climate interactions<br />
and interpretation of the sediment record.<br />
Sediment coring at lakes around Søndre Strømfjord indicates<br />
considerable variability in both lake biota and<br />
physical properties. Some of the long-term trends will<br />
be related to soil and landscape development as well<br />
as climatic change during the Holocene. However, much<br />
of the finer, short-term variability is presumably related<br />
to factors such as length of ice cover and processes controlling<br />
transfer of nutrients from catchment to lake.<br />
Finally, modelling of earlier climate-lake interactions<br />
using lake energy balance models requires a fuller<br />
understanding of present-day relationships between ice<br />
cover period, water temperature and regional meteorological<br />
conditions. <strong>The</strong> different automatic monitoring<br />
equipment used in the present study (digital cameras,<br />
57
temperature thermistors and AWS) represents a reasonably<br />
cost effective way of acquiring important sitespecific<br />
field data on the process of ice-melt in remote<br />
lakes.<br />
Acknowledgements<br />
<strong>The</strong> field work was undertaken with financial support from the<br />
Danish Natural Science Research Council. K.P.B. was supported<br />
by a post-doctoral fellowship from the Carlsberg Foundation.<br />
Assistance in the field was provided by Kate Hold (University of<br />
Copenhagen), Richard Bindler (Department of Ecology and<br />
Environmental Science, Umeå University, Sweden), Melanie Leng<br />
(Natural Environment Research Council, UK) and Simon Patrick<br />
(University College London, UK).<br />
References<br />
Anderson, N.J., Bennike, O., Christoffersen, K., Jeppesen, E.,<br />
Markager, S., Miller, G. & Renberg, I. 1999: Limnological and<br />
palaeolimnological studies of lakes in south-western <strong>Greenland</strong>.<br />
Geology of <strong>Greenland</strong> Survey Bulletin 183, 68–74.<br />
Anderson, N.J., Clarke, A., Juhler, R.K., McGowan, S. & Renberg,<br />
I. 2000: Coring of laminated lake sediments for pigment and<br />
mineral magnetic analyses, Søndre Strømfjord, southern West<br />
<strong>Greenland</strong>. Geology of <strong>Greenland</strong> Survey Bulletin 186, 83–87.<br />
Brodersen, K.P. & Anderson, N.J. 2000: Subfossil insect remains<br />
(Chironomidae) and lake-water temperature inference in the<br />
Sisimiut–Kangerlussuaq region, southern West <strong>Greenland</strong>.<br />
Geology of <strong>Greenland</strong> Survey Bulletin 186, 78–82.<br />
Brodersen, K.P., Lindegaard, C. & Anderson, N.J. 2001: Holocene<br />
temperature and environmental reconstruction from lake sediments<br />
in the Søndre Strømfjord region, southern West<br />
<strong>Greenland</strong>. Geology of <strong>Greenland</strong> Survey Bulletin 189, 59–64<br />
(this volume).<br />
Doran, P.T., McKay, C.P., Adams, W.P., English, M.C., Wharton,<br />
R.A., Jr. & Meyer, M.A. 1996: Climate forcing and thermal feedback<br />
of residual lake-ice covers in the high Arctic. Limnology<br />
and Oceanography 41, 839–848.<br />
Hasholt, B. & Søgaard, H. 1976: Et forsøg på en klimatisk-hydrologisk<br />
regionsinddeling af Holsteinsborg Kommune (Sisimiut).<br />
Geografisk Tidsskrift 77, 72–92.<br />
Magnuson, J.J. et al. 2000: Historical trends in lake and river ice<br />
cover in the Northern Hemisphere. Science 289, 1743–1746.<br />
Wynne, R.H., Magnuson, J.J., Clayton, M.K., Lillesand, T.M. &<br />
Rodman, D.C. 1996: Determinants of temporal coherence in<br />
the satellite-derived 1987–1994 ice breakup dates of lakes on<br />
the Laurentian Shield. Limnology and Oceanography 41,<br />
832–838.<br />
Authors’ addresses<br />
N.J.A., Institute of Geography, University of Copenhagen, Øster Voldgade 10, DK-1350 Copenhagen K, Denmark. E-mail: nja@geogr.ku.dk<br />
K.P.B., Geological Survey of Denmark and <strong>Greenland</strong>, Thoravej 8, DK-2400 Copenhagen NV, Denmark. Present address: Freshwater<br />
Biological Laboratory, University of Copenhagen, Helsingørsgade 51, DK-3400 Hillerød, Denmark.<br />
58
Holocene temperature and environmental<br />
reconstruction from lake sediments in the Søndre<br />
Strømfjord region, southern West <strong>Greenland</strong><br />
Klaus P. Brodersen, Claus Lindegaard and N. John Anderson<br />
Instrumental temperature records indicate that the mean<br />
annual surface-air temperature of the Earth has risen<br />
approximately 0.6°C since 1860 (IPCC 2001). Increased<br />
global warming can have considerable influence at high<br />
latitudes, and among the major concerns are the effects<br />
on the sensitive arctic ecosystems and the possible<br />
reduction in the diversity of regional flora and fauna.<br />
Arctic organisms are highly adapted to extreme environmental<br />
conditions and have difficulties coping with<br />
any additional stresses or disturbances.<br />
In the ongoing palaeolimnological projects in West<br />
<strong>Greenland</strong> (Anderson & Bennike 1997; Brodersen &<br />
Anderson 2000) we address to what extent climate variation<br />
has influenced the low-arctic West <strong>Greenland</strong><br />
lakes during the Holocene. Palaeolimnological data<br />
provide independent information on the recent warming,<br />
and also place the 19th to 20th century (instrumental<br />
temperature records) warming in a long-term<br />
context. <strong>The</strong> sedimentary records allow us to look at<br />
the lake-specific ecological response to regional temperature<br />
fluctuations over the last several centuries to<br />
millennia. This perspective is an important capability<br />
in any aim to predict the possible outcome of late 20th<br />
century global warming. An important prerequisite,<br />
however, is to have good knowledge of the present lakeecological<br />
conditions and the regional climate variability<br />
in southern West <strong>Greenland</strong>, keeping in mind that<br />
West <strong>Greenland</strong> regionally has experienced a decline<br />
in average temperature in the second half of the 20th<br />
century (Heide-Jørgensen & Johnsen 1998; see also<br />
Mikkelsen et al. 2001, this volume).<br />
Recent limnology and palaeolimnology<br />
Most groups of plants and animals respond more or less<br />
directly to the ambient temperature and climate conditions.<br />
<strong>The</strong> non-biting midges (Diptera: Chironomidae)<br />
60°<br />
56°<br />
52°<br />
48°<br />
44°<br />
40°<br />
53°<br />
52° 51° 50°<br />
200 km<br />
Sisimiut<br />
Søndre<br />
Strømfjord<br />
Inland<br />
Ice<br />
<strong>Greenland</strong><br />
Kangerlussuaq<br />
69°<br />
66°<br />
Søndre<br />
Kangerlussuaq<br />
1–5, 85<br />
68–76<br />
EX03–07<br />
Strømfjord<br />
19–22<br />
EX14–18<br />
17<br />
Inland<br />
Ice<br />
67°<br />
32<br />
63°<br />
66°30′<br />
A<br />
Labrador<br />
Sea<br />
60°<br />
B<br />
0 50 km<br />
Fig. 1. A: Map of southern <strong>Greenland</strong> showing the location of the study area. B: Map of the area at the head of Søndre Strømfjord<br />
showing the location of lakes and ponds mentioned in the text and in Table 1. Modified from Anderson et al. (2000).<br />
Geology of <strong>Greenland</strong> Survey Bulletin 189, 59–64 (2001) © GEUS, 2001<br />
59
Table 1. Lakes and ponds sampled for chironomid exuviae from 14–24 June 2000<br />
Lake N lat. W long. Lake Conductivity Total nitrogen Altitude<br />
code type (µS cm -1 ) (mg l -1 ) (m)<br />
SS05 66°59.400′ 51°05.300′ B 4072 0.77 175<br />
SS03 66°59.900′ 51°01.700′ B 3601 0.80 175<br />
SS17 66°59.400′ 50°35.900′ B 2798 1.26 215<br />
SS04 66°59.300′ 51°02.800′ B 2636 0.96 170<br />
SS71 66°57.600′ 51°31.950′ B 1465 1.86 240<br />
SS85 66°58.900′ 51°03.400′ B 616 1.12 178<br />
SS75 66°56.390′ 51°33.330′ B 226 0.05 340<br />
SS70 66°57.260′ 51°34.950′ D 2443 0.40 235<br />
SS68 66°56.730′ 51°35.070′ D 376 0.35 240<br />
SS76 66°56.300′ 51°33.300′ D 346 0.36 345<br />
SS72 66°57.802′ 51°31.860′ D 311 0.37 255<br />
SS73 66°57.920′ 51°29.810′ D 268 0.13 270<br />
SS74 66°56.360′ 51°34.510′ D 234 0.00 330<br />
SS02 66°59.800′ 50°58.200′ C 321 0.65 185<br />
SS69 66°56.950′ 51°35.930′ C 211 0.63 230<br />
SS21 67°09.500′ 50°20.400′ C 148 0.37 470<br />
SS01 66°59.200′ 50°55.700′ C 128 0.75 120<br />
SS22 67°10.000′ 50°19.900′ C 113 0.26 470<br />
SS20 67°09.100′ 50°19.500′ C 107 0.41 445<br />
SS19 67°08.500′ 50°18.300′ C 85 0.45 470<br />
EX14 67°10.004′ 50°19.735′ C * * 450<br />
EX04 66°56.539′ 51°33.938′ A 423 * 318<br />
EX03 66°56.605′ 51°33.800′ A 398 * 318<br />
EX05 66°57.052′ 51°31.676′ A * * 381<br />
EX06 66°56.828′ 51°33.532′ A * * 321<br />
EX07 66°56.631′ 51°31.020′ A * * 380<br />
EX17 67°10.116′ 50°20.432′ A * * 479<br />
EX18 67°09.950′ 50°20.929′ A * * 472<br />
Lakes are arranged according to lake type and decreasing conductivity. Lake types are defined from the ordination of species compositions in<br />
Fig. 4. SS-lakes are lakes included in the surface sediment sampling program. EX-ponds are additional ponds only sampled for exuviae in June<br />
2000.<br />
* Water chemistry data are not available for the shallow ponds.<br />
A<br />
B<br />
10 mm<br />
Fig. 2. A: Large numbers of floating chironomid exuviae (pale-coloured patches) along the shore of a shallow pond (EX05). For location,<br />
see Fig. 1. B: Close-up of exuviae, primarily Chironomus sp. 3 and Procladius sp. 1.<br />
60
are now accepted as being one of the best biological<br />
palaeoclimate proxies (Walker et al. 1991; Lotter et al.<br />
1999; Olander et al. 1999; Battarbee 2000; Brooks & Birks<br />
2000). Subfossil chironomid head capsules are well preserved<br />
in lake sediments and by numerical modelling<br />
of the relationship between recently deposited subfossil<br />
assemblages and the contemporary lake conditions<br />
(physics, chemistry and biology) it is possible to quantitatively<br />
infer palaeotemperature and to reconstruct<br />
past climate variation in the region (Brodersen &<br />
Anderson 2000).<br />
Chironomid exuviae<br />
In June 2000, surface sediments were sampled, lake<br />
temperature and conductivity profiles were measured<br />
and chironomid exuviae collected from 20 of the study<br />
lakes initially sampled by Anderson et al. (1999) and<br />
from eight additional shallow ponds (Fig. 1; Table 1).<br />
Exuviae are the cast skins left from the pupae when the<br />
aquatic larvae metamorphose into the terrestrial winged<br />
adult stage. <strong>The</strong> exuviae are collected from the lake<br />
shores and can sometimes be found in very large numbers<br />
when a synchronised mass swarming has occurred,<br />
often during or immediately after ice-melt (Fig. 2). <strong>The</strong><br />
chironomid exuviae can be identified to genera<br />
(Wiederholm 1986) and many Palaearctic taxa can be<br />
identified to species level (Langton 1991). <strong>The</strong> knowledge<br />
gained from identification of recent exuviae<br />
improves our ability to correctly identify the subfossil<br />
larval remains from the lake sediments (Fig. 3).<br />
Twenty-two chironomid taxa were registered (Table<br />
2), and several appear to be intermediate types between<br />
Palaearctic and Nearctic species. Collected and described<br />
material from <strong>Greenland</strong> is still scarce and the application<br />
of West Palaearctic identification literature is<br />
problematical.<br />
A1<br />
B1<br />
100 µm<br />
100 µm<br />
A2<br />
B2<br />
200 µm<br />
200 µm<br />
Fig. 3. A1: Posterior abdominal segment of Chironomus sp. 1 pupae (from pond EX18); A2: Larval head capsule of subfossil Chironomus<br />
sp. (from Lake SS32). B1: Abdominal segments of Micropsecta brundini (from Lake SS19); B2: Larval head capsule of subfossil<br />
Micropsectra sp. (from Lake SS32). A1 and B1 are light micrographs; A2 and B2 are scanning electron micrographs. For lake locations,<br />
see Fig. 1 and Table 1.<br />
61
Taxon<br />
Table 2. Chironomid exuviae collected in West<br />
<strong>Greenland</strong> lakes and ponds from 14–24 June 2000<br />
Number<br />
of lakes<br />
Lake<br />
type<br />
Ablabesmyia pulchripennis (Lundbeck 1898) 4 B<br />
Arctopelopia melanosoma (Goetghebuer 1933) 1 B<br />
Procladius sp. 1 7 A<br />
Procladius sp. 2 7 B<br />
Chaetocladius sp. 1 D<br />
Corynoneura arctica Kieffer 1923 12 BC<br />
Heterotrissocladius sp. 7 CD<br />
Psectrocladius barbimanus (Edwards 1929) 14 ABC<br />
Psectrocladius limbatellus (Holmgren 1869) 3 DC<br />
Psectrocladius octomaculatus Wülker 1956 1 C<br />
Orthocladius olivaceus Kieffer 1911 1 C<br />
Chironomus sp. 1 8 AB<br />
Chironomus sp. 2 6 AB<br />
Chironomus sp. 3 3 AB<br />
Dicrotendipes modestus (Say 1823) 8 AB<br />
Micropsectra brundini Säwedal 1979 13 CD<br />
Micropsectra groenlandica Andersen 1937 1 C<br />
Micropsectra lindrothi Goetghebuer 1931 1 D<br />
Paratanytarsus laccophilus (Edwards 1929) 1 A<br />
Tanytarsus gracilentus (Holmgren 1883) 7 BC<br />
Tanytarsus norvegicus (Kieffer 1924) 1 C<br />
Tanytarsus sp. 2 1 C<br />
Non-metric multidimensional scaling (NMDS; Clarke<br />
& Warwick 1994) based on similarities in species composition<br />
in the 28 lakes and ponds clearly demonstrates<br />
the value of chironomids as environmental indicators<br />
(Fig. 4). Lakes (and ponds) that group close together<br />
in the ordination diagram have high similarity in chironomid<br />
assemblages and the preference lake types<br />
for the 22 taxa are given in Table 2. <strong>The</strong> ponds (group<br />
A) and the ‘oligosaline nutrient-rich’ lakes (group B) were<br />
characterised by warm-water species that inhabit shallow<br />
lakes or the littoral zone of deep lakes (Chironomus<br />
sp., Ablabesmyia pulchripennis, Procladius spp.,<br />
Dicrotendipes modestus). <strong>The</strong> meromictic oligosaline<br />
lakes (group B) are almost permanently stratified<br />
(Brodersen & Anderson 2000) and species that characterise<br />
the deep profundal zone are absent in these<br />
lakes due to low oxygen levels (Anderson et al. 1999).<br />
<strong>The</strong> dilute lakes (groups C and D) are relatively nutrient-poor<br />
and less productive and characteristic species<br />
are Heterotrissocladius sp. and Micropsectra spp. <strong>The</strong><br />
oligotrophic Lake SS75 was misclassified because a few<br />
exuviae of Chironomus sp. 3 were found in the sample.<br />
Two different non-named species of Procladius<br />
appear to show significantly different lake type preference,<br />
suggesting that subfossil Procladius head capsules<br />
should be carefully identified and separated in<br />
SS01<br />
C<br />
dilute<br />
nutrient rich<br />
SS70<br />
A<br />
shallow ponds<br />
SS22<br />
SS02<br />
SS04<br />
SS69<br />
SS20<br />
SS17<br />
EX17<br />
EX06<br />
EX04<br />
EX05<br />
EX07<br />
EX03<br />
EX14<br />
SS19<br />
palaeolimnological analysis, which is still not possible.<br />
In contrast, three species of Chironomus did not differentiate<br />
significantly in this preliminary numerical<br />
analysis.<br />
Subfossil chironomids<br />
Lake surface sediments were collected from a range of<br />
lakes and the training set with subfossil chironomid<br />
data now constitutes 48 lakes and 28 taxa. High-resolution<br />
water temperature data are available for 21 of the<br />
lakes and there is a good correlation between the chironomid<br />
assemblages and the mean July surface-water<br />
temperature (r = 0.80, Fig. 5). However, even though<br />
temperature is the strongest variable to describe the<br />
chironomid distribution, both lake total-nitrogen concentration<br />
(TN) and maximum lake depth are also strong<br />
environmental parameters (r = 0.69 and r = 0.66, respectively;<br />
authors’ unpublished data).<br />
SS03<br />
SS71<br />
EX18<br />
SS74<br />
SS21<br />
SS05<br />
SS85<br />
SS73<br />
SS68<br />
SS75<br />
D<br />
dilute<br />
nutrient poor<br />
SS72<br />
SS76<br />
B<br />
oligosaline<br />
nutrient rich<br />
Fig. 4. Non-metric multidimensional scaling (NMDS) of 28 chironomid<br />
exuviae samples from southern West <strong>Greenland</strong>. Lakes<br />
in the ordination diagram are plotted along arbitrary axes according<br />
to their similarity in species composition. High proximity<br />
reflects high species similarity. Lakes (dots) are coloured according<br />
to lake groups. For lake locations, see Fig. 1 and Table 1.<br />
62
Holocene climate reconstruction<br />
A dated Holocene sediment core from a lake near the<br />
harbour at Kangerlussuaq has been analysed and clear<br />
stratigraphic signals are recorded (unpublished data).<br />
Quantitative temperature reconstructions using the preliminary<br />
21-lake model reveal the same patterns in<br />
Holocene cold/warm fluctuations as interpreted through<br />
ice cores from the <strong>Greenland</strong> Inland Ice. <strong>The</strong> rapid cold<br />
event at 8200 ice core years B.P. (Alley et al. 1997;<br />
Willemse & Törnqvist 1999) is clearly reflected in the<br />
sediment core by extreme low chironomid diversity<br />
and by dominance of the cold-water indicator<br />
Micropsectra (Fig. 3). <strong>The</strong> warmer periods around 2500<br />
B.P. and 3500 B.P. are characterised by warm-water<br />
genera such as Chironomus (Fig. 3). <strong>The</strong> sediment cores<br />
from West <strong>Greenland</strong> have been studied by a multiproxy<br />
approach that includes diatom-inferred conductivity,<br />
plant pigments, zooplankton, stable isotopes and macrofossils<br />
(Anderson et al. 2000) and the preliminary results<br />
show good agreement between the different proxies.<br />
This approach allows assessment of lake ontogeny<br />
along environmental gradients other than temperature.<br />
By addressing the same question simultaneously with<br />
different proxies it is possible to identify artifacts of<br />
each of them, and the aim of reaching a reasonable ecological<br />
reconstruction is more conceivable. A common<br />
problem in palaeolimnological temperature reconstruction<br />
is to partial out the effect of inter-relation<br />
between lake temperature and lake productivity. <strong>The</strong><br />
low productive, oligotrophic lakes are usually also cold,<br />
high altitude and deep lakes with small catchment areas,<br />
whereas the warm lakes are nutrient-rich and productive<br />
lowland lakes often with high organic sediment<br />
content (cf. Lotter et al. 1997; Müller et al. 1998; Olander<br />
et al. 1999). In the West <strong>Greenland</strong> data set, strong secondary<br />
environmental gradients are also found (TN and<br />
lake depth) and one of the aims of this project is to highlight<br />
and include these variables in the inference models<br />
rather than to discard them.<br />
Long-term lake monitoring<br />
and assessment<br />
Compared to the ongoing intensive lake monitoring<br />
programs in European countries (Kristensen & Hansen<br />
1994), collection of limnological and environmental<br />
data from the sensitive and pristine low-arctic West<br />
<strong>Greenland</strong> lakes must be considered as limited. However,<br />
biological remains (i.e. chironomid head capsules and<br />
Mean July temp (°C)<br />
18<br />
16<br />
14<br />
12<br />
10<br />
8<br />
6<br />
0 1 2 3<br />
Fig. 5. Correlation between subfossil chironomid assemblages<br />
and the mean July surface-water temperature (°C) from 21 lakes.<br />
Chironomid assemblages are expressed as the axis one scores of<br />
a detrended correspondence analysis (DCA; Hill & Gauch 1980).<br />
exuviae) from the lake sediments and surface waters<br />
integrate information on lake conditions over years and<br />
decades and can therefore be used as a long-term monitoring<br />
tool in these remote areas where frequent data<br />
registration is difficult and where existing environmental<br />
records do not exist (Smol 1992). <strong>The</strong> data collected during<br />
this project can thus provide a standard of reference<br />
in future evaluation of changes in lake conditions<br />
and typology on decadal time scales (Brodersen et al.<br />
1998). <strong>The</strong> studies of collected exuviae samples from<br />
West <strong>Greenland</strong>, presented here for the first time, are also<br />
valuable for verification of identified subfossil material.<br />
Future work<br />
DCA axis I<br />
r = 0.80<br />
In future field seasons we intend to expand the calibration<br />
data set in the low end of the temperature gradient<br />
by including glacier-near lakes (late-glacial<br />
analogues) and also lakes at higher altitudes, although<br />
the latter might introduce new ecological assumptions<br />
that need to be taken into account. <strong>The</strong> ecological<br />
responses gained from the lake sediments in southern<br />
West <strong>Greenland</strong> can be compared to ice core data from<br />
the <strong>Greenland</strong> Inland Ice more readily than results from<br />
lakes elsewhere. Analyses of Holocene sediment cores<br />
from closely located lakes, but with different typology<br />
(e.g. salinity and productivity; Fig. 4), will give an idea<br />
of similarities in inter-lake overall climate impact as<br />
compared to the differences in in-lake dynamic<br />
processes. <strong>The</strong> long time-series provided by the palae-<br />
63
olimnological data therefore not only give an independent<br />
idea of past environmental and climate conditions,<br />
but also help to assess the natural variability of<br />
the biotic and abiotic systems.<br />
Acknowledgements<br />
<strong>The</strong> Commission for Scientific Research in <strong>Greenland</strong>, Copenhagen,<br />
is gratefully acknowledged for financial assistance. We thank<br />
Kate Hold (University of Copenhagen) for field assistance and<br />
Charlotte Appel for help with SEM photographs. K.P.B. was supported<br />
by a post-doctoral fellowship from the Carlsberg Foundation.<br />
References<br />
Alley, R.B., Mayewski, P.A., Sowers, T., Stuiver, M., Taylor, K.C.<br />
& Clark, P.U. 1997: Holocene climate instability: a prominent,<br />
widespread event 8200 yr ago. Geology 25, 483–486.<br />
Anderson, N.J. & Bennike, O. 1997: Holocene lake sediments in<br />
West <strong>Greenland</strong> and their palaeoclimatic and palaeoecological<br />
implications. Geology of <strong>Greenland</strong> Survey Bulletin 176, 89–94.<br />
Anderson, N.J., Bennike, O., Christoffersen, K., Jeppesen, E.,<br />
Markager, S., Miller, G. & Renberg, I. 1999: Limnological and<br />
palaeolimnological studies of lakes in south-western <strong>Greenland</strong>.<br />
Geology of <strong>Greenland</strong> Survey Bulletin 183, 68–74.<br />
Anderson, N.J., Clark, A., Juhler, R.K., McGowan, S. & Renberg,<br />
I. 2000: Coring of laminated lake sediments for pigment and<br />
mineral magnetic analyses, Søndre Strømfjord, southern West<br />
<strong>Greenland</strong>. Geology of <strong>Greenland</strong> Survey Bulletin 186, 83–87.<br />
Battarbee, R.W. 2000: Palaeolimnological approaches to climate<br />
change, with special regard to the biological record. Quaternary<br />
Science Reviews 19, 107–124.<br />
Brodersen, K.P. & Anderson, N.J. 2000: Subfossil insect remains<br />
(Chironomidae) and lake-water temperature inference in the<br />
Sisimiut–Kangerlussuaq region, southern West <strong>Greenland</strong>.<br />
Geology of <strong>Greenland</strong> Survey Bulletin 186, 78–82.<br />
Brodersen, K.P., Whiteside M.C. & Lindegaard, C. 1998:<br />
Reconstruction of trophic state in Danish lakes using subfossil<br />
Chydorid (Cladocera) assemblages. Canadian Journal of<br />
Fisheries and Aquatic Sciences 55, 1093–1103.<br />
Brooks, S.J. & Birks, H.J.B. 2000: Chironomid-inferred lateglacial<br />
and early-Holocene mean July air temperatures for<br />
Kråkenes Lake, western Norway. Journal of Paleolimnology<br />
23, 77–89.<br />
Clarke, K.R. & Warwick, R.M. 1994: Change in marine communities:<br />
an approach to statistical analysis and interpretation,<br />
144 pp. Plymouth, UK: Natural Environmental Research Council.<br />
Heide-Jørgensen, H.S. & Johnsen, I. 1998: Ecosystem vulnerability<br />
to climate change in <strong>Greenland</strong> and the Faroe Islands. Danish<br />
Environmental Protection Agency, Environment News 33, 266<br />
pp. Copenhagen: Ministry of Environment and Energy.<br />
Hill, M.O. & Gauch, H.G. 1980: Detrended correspondence analysis:<br />
an improved ordination technique. Vegetatio 42, 47–58.<br />
IPCC 2001: Intergovernmental Panel on Climate Change, Working<br />
Group 1, third assessment report ‘Climate change 2001: the<br />
scientific basis’. Summaries for policymakers, 20 pp. Geneva,<br />
Switzerland: IPCC secretariat.<br />
Kristensen, P. & Hansen, H.O. 1994: European rivers and lakes<br />
– assessment of their environmental state. Environmental<br />
Monographs 1, 122 pp. Copenhagen, Denmark: European<br />
Environment Agency.<br />
Langton, P.H. 1991: A key to pupal exuviae of West Palaearctic<br />
Chironomidae, 386 pp. Huntingdon, Cambridgeshire, UK: P.H.<br />
Langton.<br />
Lotter, A.F., Birks, H.J.B., Hofmann, W. & Marchetto A. 1997:<br />
Modern diatom, cladocera, chironomid, and chrysophyte cyst<br />
assemblages as quantitative indicators for the reconstruction<br />
of past environmental conditions in the Alps. I. Climate. Journal<br />
of Paleolimnology 18, 395–420.<br />
Lotter, A.F., Walker, I.R., Brooks, S.J. & Hofmann, W. 1999: An<br />
intercontinental comparison of chironomid palaeotemperature<br />
inference models: Europe vs North America. Quaternary<br />
Science Reviews 18, 717–735.<br />
Mikkelsen, N., Kuijpers, A., Lassen, S. & Vedel, J. 2001: Marine and<br />
terrestrial investigations in the Norse Eastern Settlement, <strong>South</strong><br />
<strong>Greenland</strong>. Geology of <strong>Greenland</strong> Survey Bulletin 189, 65–69<br />
(this volume).<br />
Müller, B., Lotter, A.F., Sturm, M. & Ammann, A. 1998: Influence<br />
of catchment quality and altitude on the water and sediment<br />
composition of 68 small lakes in central Europe. Aquatic<br />
Sciences 60, 316–337.<br />
Olander, H., Birks, H.J.B., Korhola, A. & Blom, T. 1999: An<br />
expanded calibration model for inferring lakewater and air temperatures<br />
from fossil chironomid assemblages in northern<br />
Fennoscandia. <strong>The</strong> Holocene 9, 279–294.<br />
Smol, J.P. 1992: Paleolimnology: an important tool for effective ecosystem<br />
management. Journal of Aquatic Ecosystem Health 1, 49–58.<br />
Walker, I.R., Smol, J.P., Engstrom, D.R. & Birks, H.J.B. 1991: An<br />
assessment of Chironomidae as quantitative indicators of past<br />
climatic changes. Canadian Journal of Fisheries and Aquatic<br />
Sciences 48, 975–987.<br />
Wiederholm, T. 1986: Chironomidae of the Holarctic region. Keys<br />
and diagnoses. Part 2. Pupae. Entomologica Scandinavica<br />
Supplement 28, 482 pp.<br />
Willemse, N.W. & Törnqvist, T.E. 1999: Holocene century-scale<br />
temperature variability from West <strong>Greenland</strong> lake records.<br />
Geology 27, 580–584.<br />
Authors’ addresses<br />
K.P.B., Geological Survey of Denmark and <strong>Greenland</strong>, Thoravej 8, DK-2400 Copenhagen NV, Denmark. Present address: Freshwater<br />
Biological Laboratory, University of Copenhagen, Helsingørsgade 51, DK-3400 Hillerød, Denmark. E-mail: kpbrodersen@zi.ku.dk<br />
C.L., Freshwater Biological Laboratory, University of Copenhagen, Helsingørsgade 51, DK-3400 Hillerød, Denmark.<br />
N.J.A., Institute of Geography, University of Copenhagen, Øster Voldgade 10, DK-1350 Copenhagen K, Denmark.<br />
64
Marine and terrestrial investigations in the Norse Eastern<br />
Settlement, <strong>South</strong> <strong>Greenland</strong><br />
Naja Mikkelsen,Antoon Kuijpers, Susanne Lassen and Jesper Vedel<br />
During the Middle Ages the Norse settlements in<br />
<strong>Greenland</strong> were the most northerly outpost of European<br />
Christianity and civilisation in the Northern Hemisphere.<br />
<strong>The</strong> climate was relatively stable and mild around A.D.<br />
985 when Eric the Red founded the Eastern Settlement<br />
in the fjords of <strong>South</strong> <strong>Greenland</strong>. <strong>The</strong> Norse lived in<br />
<strong>Greenland</strong> for almost 500 years, but disappeared in the<br />
14th century. Letters in Iceland report on a Norse marriage<br />
in A.D. 1408 in Hvalsey church of the Eastern<br />
Settlement, but after this account all written sources<br />
remain silent. Although there have been numerous studies<br />
and much speculation, the fate of the Norse settlements<br />
in <strong>Greenland</strong> remains an essentially unsolved<br />
question.<br />
Previous and ongoing investigations<br />
<strong>The</strong> main objective of the field work in the summer of<br />
2000 was to continue the marine geological and hydrographic<br />
survey undertaken in 1998 and 1999 in the fjord<br />
complex of the Eastern Settlement (Kuijpers et al. 1999).<br />
In addition, the studies aimed to provide input to a collaborative<br />
archaeological project with the National<br />
Museum of Denmark, investigating environmental<br />
changes affecting the descendants of the Norse settlers<br />
in <strong>Greenland</strong> (e.g. Arneborg et al. 1999).<br />
<strong>The</strong> focus of the investigations was directed towards<br />
a detailed survey of Sandhavn, the supposed ‘Atlantic<br />
Harbour’ of the Norse settlers of <strong>South</strong> <strong>Greenland</strong>.<br />
Sandhavn is close to the major Norse homestead and<br />
church of Herjolfsnæs, where archaeological investigations<br />
in 1921 provided much insight into the life of<br />
the Norse at a late stage of their presence in <strong>Greenland</strong><br />
(Nørlund 1924). A hydrographic survey of the sheltered<br />
bay of Sandhavn was undertaken by the Royal Danish<br />
Administration for Navigation and Hydrography,<br />
Copenhagen, using the survey vessel SKA 12 (Fig. 1),<br />
and included detailed depth recordings and side-scan<br />
sonar data acquisition. <strong>The</strong> field investigations also<br />
included acoustic investigations of possible targets<br />
located in 1998 during shallow-water side-scan sonar<br />
investigations off Igaliku, the site of the Norse episcopal<br />
church Gardar in Igaliku Fjord (Fig. 2). A brief investigation<br />
of soil profiles was conducted in Søndre Igaliku,<br />
a once prosperous Norse settlement that is now partly<br />
covered by sand dunes.<br />
Field observations and preliminary<br />
results<br />
Sandhavn<br />
Sandhavn is a sheltered bay that extends from the coast<br />
north-north-west for approximately 1.5 km (Fig. 2). <strong>The</strong><br />
entrance faces south-east and it is exposed to waves<br />
and swells from the storms sweeping in from the Atlantic<br />
around Kap Farvel, the south point of <strong>Greenland</strong>. A narrow<br />
entrance shelters the bay itself, and a wide sandy<br />
beach, a feature that is rarely seen in <strong>Greenland</strong>, borders<br />
the inner harbour.<br />
Fig. 1. <strong>The</strong> survey vessel SKA 12 of the Royal Danish Administration<br />
for Navigation and Hydrography in Sandhavn; ‘Warehouse Cliff’<br />
is in the background.<br />
Geology of <strong>Greenland</strong> Survey Bulletin 189, 65–69 (2001) © GEUS, 2001<br />
65
46° 45°<br />
Brattahlid<br />
Eastern Settlement (E)<br />
Norse farm<br />
Norse church<br />
Town<br />
Core<br />
61°<br />
61°<br />
Narsaq<br />
Tunulliarfik<br />
Igaliku/Gardar<br />
Søndre Igaliku<br />
Qaqortoq/<br />
Julianehåb<br />
Hvalsey<br />
Igaliku Fjord<br />
PO 243-451<br />
60°30´<br />
60°30´<br />
Tasermiutsiaat<br />
50 km<br />
60°<br />
56°<br />
52°<br />
48°<br />
44°<br />
<strong>Greenland</strong><br />
40°<br />
66°<br />
Nanortalik<br />
W<br />
Inland<br />
Ice<br />
63°<br />
Sandhavn<br />
Herjolfsnæs<br />
60°<br />
M<br />
300 km<br />
E<br />
Kap Farvel<br />
60°<br />
45°<br />
66
44°48'<br />
Depth contours<br />
0 m<br />
W<br />
10 m<br />
60°00'<br />
60°00'<br />
20 m<br />
30 m<br />
40 m<br />
50 m<br />
60 m<br />
70 m<br />
44°48'<br />
Fig. 3. Depth survey of Sandhavn by the Royal Danish<br />
Administration for Navigation and Hydrography showing the narrow<br />
entrance to the harbour. <strong>The</strong> bay offers favourable docking<br />
opportunities, in particular at the site here called ‘Warehouse<br />
Cliff’ (W).<br />
80 m<br />
Fig. 4. Soil profile from the Norse settlement of Søndre Igaliku,<br />
showing alternating layers of aeolian sand and darker horizons.<br />
Notebook 18 cm long for scale.<br />
Facing page<br />
Fig. 2. Descendants of the Nordic Vikings established the Eastern<br />
Settlement in <strong>South</strong> <strong>Greenland</strong> around A.D. 1000 during the<br />
Medieval Climatic Optimum. <strong>The</strong> locations of the study areas<br />
(Igaliku/Gardar, Søndre Igaliku, Sandhavn/Herjolfsnæs) and core<br />
PO 243-451 discussed in the text are indicated. Ruins of Norse<br />
farms are marked by black dots and the location of churches<br />
and monasteries by red crosses (modified after Krogh 1982).<br />
<strong>The</strong> index map shows the location of the Norse Eastern Settlement<br />
(E), the Western Settlement (W) and the less important Middle<br />
Settlement (M).<br />
<strong>The</strong> bottom of Sandhavn gently deepens towards<br />
the harbour entrance (Fig. 3). It is relatively deep in the<br />
vicinity of the 5 m high and steep ‘Warehouse Cliff’ on<br />
which the ruin of a massive Norse stone building is<br />
perched. This building is considered most likely to have<br />
been a warehouse used by traders, although one might<br />
speculate that it had been a chapel serving the seagoing<br />
Norse. Taking into account the relative sea-level<br />
rise of c. 3 m since the Norse lived in the area 1000<br />
years ago (Kuijpers et al. 1999), the harbour must have<br />
had a different outline and smaller size during the Norse<br />
period. Such a bathymetric setting inferred for c. A.D.<br />
1000 would favour the location of the ‘Warehouse Cliff’<br />
as an important docking position for loading and unloading<br />
cargo vessels bound to and from Norway and<br />
Iceland.<br />
Søndre Igaliku<br />
Pilot studies were undertaken of soil profiles containing<br />
aeolian sand layers close to Norse farms in Søndre<br />
Igaliku (Fig. 4). It has been suggested that the extensive<br />
sand horizons in the area are the result of soil erosion<br />
linked to Norse farming activities (Fredskild 1978;<br />
Jakobsen 1991; Sandgren & Fredskild 1991). However,<br />
the aeolian deposits are likely to be a result of increased<br />
storm activity recorded around A.D. 1300, for which evidence<br />
is seen in the marine core PO 243-451 (Lassen<br />
et al. 2000) taken in nearby Igaliku Fjord (Fig. 2). <strong>The</strong><br />
profiles show rhythmic alternations of sand and darker<br />
horizons, whose age will need to be verified by dating.<br />
<strong>The</strong> bay off the Søndre Igaliku settlement is today<br />
dry at low tide over a large area, but covered by 1–2.5<br />
m of water at high tide. As noted above, previous work<br />
in the area (Kuijpers et al. 1999) has demonstrated a<br />
rise in the relative sea level of at least 3 m during the<br />
last 1000 years. It can therefore not be excluded that<br />
this vast area was once fertile lowland utilised by the<br />
Norse for production of winter hay for cattle. Field<br />
investigations in the summer of 2001 will address this<br />
problem.<br />
67
Fig. 5. Sonograph from Igaliku Fjord<br />
showing the slope of the delta off Søndre<br />
Igaliku with large sand beds concentrated<br />
along the northern side of the<br />
fjord. Bedforms have a wavelength of<br />
10–15 m, and are up to 3 m high, and<br />
were probably generated by sediment<br />
deposition from meltwater discharge in a<br />
tidal current domain.<br />
10 m<br />
10 m<br />
A side-scan sonar survey off this tidewater delta<br />
showed a spectacular asymmetry in the fjord sedimentation.<br />
Whereas high sedimentation rates and large sand<br />
waves characterised the relatively shallow seabed along<br />
the northern fjord bank (Fig. 5), outcropping bedrock<br />
and a much greater water depth indicate mainly nondeposition<br />
along the southern fjord bank. This marked<br />
difference clearly reflects an estuarine circulation pattern,<br />
with a marked Coriolis-force induced asymmetry<br />
of sediment-loaded meltwater outflow concentrated<br />
along the northern side of the fjord.<br />
Discussion and conclusion<br />
It has been debated whether Sandhavn is the Norse<br />
‘Atlantic Harbour’ where the Norse landed after an often<br />
stormy crossing of the Atlantic. <strong>The</strong> Norwegian priest<br />
Ivar Bardarson (in Jónsson 1930) describes in his sailing<br />
directions from c. A.D. 1300 that, after crossing the<br />
Atlantic, ships would see a tall mountain on a peninsula<br />
called Herjolfsnæs, and close by a harbour called<br />
‘Sand’, regularly used by merchant ships. <strong>The</strong> area today<br />
known as Sandhavn is about 5 km west-north-west of<br />
Herjolfsnæs, the site where well-preserved medieval<br />
clothing was discovered in the permafrost of the church<br />
yard (Nørlund 1924). In the bay area of Sandhavn<br />
numerous Norse ruins have been located (Berglund<br />
1988). It is anticipated that the new bathymetric investigations,<br />
together with further work planned by the<br />
National Museum of Denmark in the summer of 2001,<br />
will increase the plausibility of the Sandhavn area being<br />
identified as the Norse harbour ‘Sand’.<br />
It has been argued that Norse farmers had a major<br />
impact on the fragile arctic environment through cultivation<br />
of areas around the fjords, and that associated<br />
substantial soil erosion was the ultimate cause of the<br />
decline and extinction of the Norse culture (Fredskild<br />
1978; Jakobsen 1991; Sandgren & Fredskild 1991). Today<br />
intensive sheep farming and cultivation of hay is taking<br />
place in some of the same areas that were used by<br />
the Norse, and concern has therefore been expressed<br />
as to whether these activities might have an adverse<br />
environmental impact – comparable to the postulated<br />
impact of the former Norse activities. However, preliminary<br />
studies of the marine cores and onshore soil<br />
profiles indicate that the soil erosion was not a consequence<br />
of Norse farming. A more likely scenario is that<br />
there is a link between soil erosion and a pronounced<br />
increase in the wind stress over <strong>South</strong> <strong>Greenland</strong> and<br />
the Igaliku Fjord region at the transition from the<br />
Medieval Climatic Optimum to the Little Ice Age (Lassen<br />
et al. 2000). Concern as to the impact of modern farming<br />
on the environment is therefore less serious than<br />
some have feared.<br />
Field investigations in collaboration with the National<br />
Museum of Denmark will continue in 2001 with detailed<br />
geomorphological and soil-profile analyses in the vicinity<br />
of Søndre Igaliku, while marine investigations will<br />
include studies and coring operations off Søndre Igaliku.<br />
To gain additional data and information on the life<br />
and gradual change of the natural environment of the<br />
Norse in <strong>Greenland</strong>, a coring programme is planned in<br />
2002 for the inner parts of the Godthåbsfjord system in<br />
the Western Settlement (Fig. 2).<br />
68
Acknowledgements<br />
We greatly acknowledge financial support for the field work provided<br />
by the <strong>Greenland</strong> Home Rule Government and by the Danish<br />
Natural Science Research Council. <strong>The</strong> support of Rear Admiral Axel<br />
Fiedler and his colleagues of the <strong>Greenland</strong> Command, Grønnedal,<br />
and the Royal Danish Administration for Navigation and Hydrography,<br />
Copenhagen, with respect to the hydrographic survey, is<br />
greatly appreciated.<br />
References<br />
Arneborg, J., Heinemeier, J., Lynnerup, N., Nielsen, H.L., Rud, N.<br />
& Sveinsbjörnsdóttir, A.E. 1999: Change of diet of the <strong>Greenland</strong><br />
Vikings determined from stable carbon isotope analysis and<br />
C-14 dating of their bones. Radiocarbon 41(2), 157–168.<br />
Berglund, J. 1988: Herjolfsnæs – Kirken ved havet, Nanortalik<br />
Kommune, 72 pp. Qaqortoq, <strong>Greenland</strong>: Qaqortoq Kommunes<br />
Forlag.<br />
Fredskild, B. 1978: Paleobotanical investigations of some peat<br />
deposits of Norse age at Qagssiarssuk, <strong>South</strong> <strong>Greenland</strong>.<br />
Meddelelser om Grønland 204(5), 41 pp.<br />
Jakobsen, B.H. 1991: Soil erosion in the Norse Settlement area<br />
of Østerbygden in southern <strong>Greenland</strong>. Acta Borealia 8, 56–68.<br />
Jónsson, F. 1930: Ivar Bardarson – Det gamle Grønlands<br />
Beskrivelse. Udgivet efter håndskrifterne af Finnur Jónsson,<br />
75 pp. København, Danmark: Levin og Munksgaards Forlag.<br />
Krogh, K.J. 1982: Erik den Rødes Grønland, 266 pp. København,<br />
Danmark: Nationalmuseets Forlag.<br />
Kuijpers, A. et al. 1999: Climate change and the Viking-age fjord<br />
environment of the Eastern Settlement, <strong>South</strong> <strong>Greenland</strong>.<br />
Geology of <strong>Greenland</strong> Survey Bulletin 183, 61–67.<br />
Lassen, S., Jensen, K.G., Kuijpers, A., Kunzendorf, H., Heinemeier,<br />
J. & Konradi, P. 2000: Late Holocene climate signals in <strong>South</strong><br />
<strong>Greenland</strong> waters – preliminary results from Igaliku Fjord.<br />
Nordic Arctic Research Program, Danish Meteorological<br />
Institute, 13–14 April 2000. Symposium ‘Rapid Oceanographic<br />
Changes in the Arctic: Causes and Effects’. Abstracts volume,<br />
9 only.<br />
Nørlund, P. 1924: Buried Norsemen at Herjolfsnes. An archaeological<br />
and historical study. Meddelelser om Grønland 67(1),<br />
270 pp.<br />
Sandgren, P. & Fredskild, B. 1991: Magnetic measurements recording<br />
late Holocene man-induced erosion in <strong>South</strong> <strong>Greenland</strong>.<br />
Boreas 20, 315–331.<br />
Authors’ addresses<br />
N.M., A.K. & S.L., Geological Survey of Denmark and <strong>Greenland</strong>, Thoravej 8, DK-2400 Copenhagen NV, Denmark. E-mail: nm@geus.dk<br />
J.V., Royal Danish Administration for Navigation and Hydrography, Over Gaden oven Vandet 62B, DK-1401 Copenhagen SV, Denmark.<br />
69
<strong>The</strong> <strong>Nalunaq</strong> <strong>gold</strong> <strong>prospect</strong>, <strong>South</strong> <strong>Greenland</strong>:<br />
test mining for feasibility studies<br />
Mogens Lind, Lotte Kludt and Brian Ballou<br />
<strong>The</strong> <strong>Nalunaq</strong> narrow-vein <strong>gold</strong> <strong>prospect</strong> is situated 40<br />
km north-east of Nanortalik, the southernmost town in<br />
<strong>Greenland</strong>, 6 km inland from the fjord Saqqaa (Fig. 1).<br />
<strong>The</strong> exploration licence is held by <strong>Nalunaq</strong> I/S, a company<br />
jointly owned by Crew Development Corporation,<br />
Canada (67%) and NunaMinerals A/S, <strong>Greenland</strong> (33%).<br />
A pre-feasibility study of March 1999 by an independent<br />
mining consulting company commented positively<br />
on the <strong>Nalunaq</strong> <strong>prospect</strong> (<strong>Nalunaq</strong> I/S, personal<br />
communication 1999). However, assessment of the sample<br />
database demonstrated considerable variation in<br />
grade estimates depending on the use of drillcores,<br />
chip or saw-cut samples as well as the capping levels<br />
(reducing the highest assay values to a fixed value). To<br />
advance this project to the feasibility level, the pre-feasibility<br />
study stressed the need for improved grade verification<br />
and demonstration of grade continuity.<br />
In preparation for a feasibility study, a Can$ 9 million<br />
underground test mining and bulk sampling programme<br />
was executed during the summer 2000 field<br />
season. Strathcona Mineral Services Limited (Canada)<br />
designed the programme in conjunction with <strong>Nalunaq</strong><br />
personnel. This report focuses on the field aspects of<br />
the programme; processing of field and laboratory data<br />
is still in progress (January 2001).<br />
Nanortalik<br />
10 km<br />
Sermersooq<br />
45°<br />
S<br />
<strong>Nalunaq</strong><br />
Canada<br />
Inland<br />
Ice<br />
60°30'<br />
<strong>Greenland</strong><br />
Fig. 1. Map of the Nanortalik region showing the location of the<br />
<strong>Nalunaq</strong> <strong>prospect</strong>. <strong>The</strong> framed area is the exploration licence outline.<br />
S: Saqqaa; T: Tasermiut.<br />
T<br />
Geological setting and previous<br />
investigations<br />
<strong>The</strong> <strong>Nalunaq</strong> <strong>gold</strong> <strong>prospect</strong> (see Kaltoft et al. 2000 and<br />
references therein) is hosted by a Palaeoproterozoic<br />
sequence of mafic metavolcanics and dolerite sills metamorphosed<br />
under amphibolite facies conditions. <strong>The</strong><br />
mineralisation is located in a shear zone, and consists<br />
of a system of quartz veins associated with calc-silicate<br />
alteration referred to as the ‘Main Vein’ (MV; Fig. 2). Gold<br />
occurs mainly in native form with grain size ranging from<br />
1 micron to 4 mm (Fig. 3). <strong>The</strong> mineralised zone has a<br />
strike of c. 50° and dips at 25°–55° to the south-east.<br />
Two major dextral faults divide the MV into the ‘<strong>South</strong>ern<br />
Block’, ‘Target Block’ and ‘Upper Block’ (Fig. 2). Since<br />
1992 the MV has been mapped and sampled for a distance<br />
of c. 2000 m on surface outcrops. Diamond drilling,<br />
totalling 11 452 m of core from 78 holes, has focused<br />
on the ‘Target Block’ and adjacent parts of the ‘Upper<br />
Block’ and ‘<strong>South</strong>ern Block’. In 1998 a 288 m exploration<br />
adit at level 400 m above sea level was excavated<br />
in the MV for 205 m along strike within the ‘Target<br />
Block’. In addition, two upwards-directed shafts (raises)<br />
totalling 39 m were excavated in the MV up-dip direction.<br />
Significant grade variations on a metre scale were<br />
70<br />
Geology of <strong>Greenland</strong> Survey Bulletin 189, 70–75 (2001) © GEUS, 2001
Fig. 2. <strong>The</strong> east face of <strong>Nalunaq</strong> mountain.<br />
<strong>The</strong> <strong>gold</strong>-bearing ‘Main Vein’ (MV)<br />
is traced in yellow (not to scale). Full<br />
yellow line indicates outcropping MV<br />
while the dashed yellow line indicates<br />
continuation of the MV trace below the<br />
talus as interpreted from core drilling.<br />
Two dextral faults (dashed white lines)<br />
divide the MV into the ‘<strong>South</strong>ern Block’,<br />
‘Target Block’ and ‘Upper Block’. <strong>The</strong><br />
winding road provides access to the adit<br />
portals at levels 350 m, 400 m and 450<br />
m. Mountain summit is c. 1100 m above<br />
the mining camp on the valley floor.<br />
Photo: Hans Christian Langager.<br />
Level 350<br />
Level 450<br />
Target<br />
Block<br />
Upper<br />
Block<br />
Level 400<br />
<strong>South</strong>ern<br />
Block<br />
Fig. 3. Visible <strong>gold</strong> in a sample from the<br />
‘Main Vein’ surface exposure between<br />
the portal at level 450 m and the<br />
snowdrift seen on Fig. 2. Grains, such as<br />
that on the left side of the photograph,<br />
are important contributors to the value of<br />
the deposit. Sample GGU 445683. Photo:<br />
Jakob Lautrup.<br />
3 mm<br />
71
documented by chip and saw-cut channel sampling.<br />
Grades as high as 5240 g/t over 0.8 m were recorded<br />
from a saw-cut sample. At the current stage of exploration,<br />
indicated plus inferred <strong>gold</strong> resources of 425 000<br />
troy ounces (~ 13.2 tonnes) with an average grade of<br />
32 g/t are estimated. Taking into account a proposed<br />
mining method comparable to that used at a similar<br />
deposit, and including the losses due to extraction and<br />
dilution, the pre-feasibility study estimated a mill-feed<br />
grade of 27 g/t.<br />
A geological exploration target of about 1.8 million<br />
ounces of <strong>gold</strong> (~ 56 t) is currently envisaged from the<br />
mineralised structure. This figure includes the indicated<br />
and inferred <strong>gold</strong> resources, plus an order-of-magnitude<br />
estimate based on geological modelling.<br />
Programme objective<br />
<strong>The</strong> prime focus of the summer 2000 programme was<br />
to investigate a section of the existing mineralised area<br />
in order to establish resources that would meet bankfinancing<br />
requirements. <strong>The</strong> target amount of resources<br />
was based on the capital and operating costs detailed<br />
in the pre-feasibility study that would support a 500<br />
tonnes-per-day (tpd) operation. Furthermore, the project<br />
needed to establish a strike length of at least 400 m<br />
in order to obtain the 500-tpd scenario of the pre-feasibility<br />
study.<br />
To test the continuity of mineable <strong>gold</strong> grade (approximately<br />
25 g/t over the mining width including waste<br />
dilution) the MV was exposed through the excavation<br />
of adits at three levels and construction of raises in the<br />
MV up-dip direction. This was combined with a rigorous<br />
scheme for geological mapping and sampling. <strong>The</strong><br />
adit/raise design was set up to outline 80 × 80 m blocks<br />
within the MV plane (Fig. 4). <strong>The</strong> blocks were exposed<br />
and sampled on three or four sides, depending on their<br />
position in relation to the underground workings and<br />
the surface outcrops. Most blocks also included drillhole<br />
intersections. <strong>The</strong> adits were advanced to expose<br />
the vein for a strike length of 400 m.<br />
Grade verification was approached by extensive bulk<br />
sampling. This is a recommended industry practice for<br />
<strong>gold</strong> deposits with a significant nugget effect (John &<br />
Thalenhorst 1991). Each bulk sample was processed separately<br />
through a crushing/screening/sampling plant<br />
situated on the valley floor (see Fig. 6). To address the<br />
well-known problem of obtaining representative samples<br />
from broken ore, this part of the programme was<br />
based on sampling theory as formulated by Gy (1982)<br />
and extended by François-Bongarçon (1998). <strong>The</strong> purpose<br />
was to minimise the ‘Fundamental Sampling Error’<br />
(FSE) occurring at each sample reduction step. To obtain<br />
calibration data for designing the sampling programme,<br />
Lakefield Research Limited (Canada) conducted benchscale<br />
metallurgical tests on a number of existing MV samples.<br />
<strong>The</strong> overall FSE for an expected 20 000 t of <strong>Nalunaq</strong><br />
bulk sample material at an average <strong>gold</strong> grade of 25<br />
g/t was calculated to ± 2.5% (equivalent to ± 0.6 g/t).<br />
It should be noted that the 23 000 t actually mined to<br />
achieve the programme objective constitutes about 5%<br />
of the indicated plus inferred resources.<br />
Underground work<br />
Underground development totalled c. 1900 m of adits<br />
and raises (Fig. 4). <strong>The</strong> 1998 adit at the 400 m level was<br />
extended to a length of 400 m and two new adits were<br />
excavated at the 350 m and 450 m levels to lengths of<br />
c. 400 m each. In addition 13 raises were driven in the<br />
MV plane up-dip to lengths of up to 80 m. For practical<br />
reasons each advance of an adit heading (a ‘round’)<br />
was carried out by full-face blasting. <strong>The</strong> vein was deliberately<br />
kept in the middle of the advancing face for systematic<br />
geological sampling of both the hanging wall and<br />
foot wall structure (Fig. 5). In an actual mining operation<br />
the mineralised vein would be carried high up in<br />
the working face to allow the use of a mining technique<br />
(resuing) whereby the foot wall waste-rock of each<br />
‘round’ is blasted and removed before blasting of the MV<br />
material.<br />
A number of minor faults with dextral displacement<br />
were encountered during excavation of the adits. This<br />
necessitated offsetting the adits to the right to regain<br />
contact with the MV (the kinks on the adit outlines in<br />
Fig. 4). Some of the faults could be traced between the<br />
levels, and on occasions a raise was stopped prematurely<br />
in waste after intersecting the fault plane.<br />
A 10 × 10 m test stope was mined to obtain information<br />
which will facilitate the choice of an optimal mining<br />
method of the MV between the sublevels. <strong>The</strong> aim<br />
was to test the minimum practical mining width to be<br />
achieved at conditions reflecting production mining. It<br />
would also allow observations on the rock mechanical<br />
properties of the hanging wall in particular, as this will<br />
influence the selection of stope dimensions during mine<br />
planning.<br />
<strong>The</strong> excavated material (c. 70 t) from each adit ‘round’<br />
was treated as a separate bulk sample. In contrast, four<br />
raise ‘rounds’ were combined to one bulk sample (a<br />
72
Fig. 4. Longitudinal section drawn in the<br />
plane of the ‘Main Vein’ (MV), which has<br />
a strike of 050° and is inclined at 40° to<br />
the south-east (average MV dip),<br />
showing adits and raises (r, 1998; R,<br />
2000). Black lines indicate development<br />
in waste to access the MV; red lines<br />
indicate development in ore. <strong>The</strong> red<br />
ribbed pattern in the test stope<br />
illustrates mining of the ore by segments<br />
between the two short raises. <strong>The</strong><br />
dashed lines mark the trace of minor<br />
dextral faults with metre-scale offsets.<br />
Open red circles indicate positions of<br />
drill-hole intersections with the MV.<br />
Yellow stars are MV outcrops. E is the<br />
end of the 1998 adit, and P the adit<br />
portal (visible on Fig. 2).<br />
SW<br />
Level 450 adit<br />
Level 400 adit<br />
Level 350 adit<br />
R<br />
R<br />
R<br />
E<br />
R<br />
R<br />
R<br />
R<br />
R<br />
R<br />
P<br />
r<br />
R<br />
r<br />
R<br />
‘Main Vein’<br />
outcrops<br />
P<br />
Test<br />
stope<br />
R<br />
R<br />
NE<br />
100 m<br />
P<br />
Fig. 5. Face for round 44 at level 450<br />
(face limits shown by white frame with<br />
white label at the bottom of the face).<br />
<strong>The</strong> mapping and sampling routine is<br />
described in the text. Green lines<br />
indicate limits of calc-silicate alteration<br />
(cs). Other abbreviations – fg: finegrained;<br />
FW: foot wall; HW: hanging<br />
wall; MV: ‘Main Vein’. <strong>The</strong> red lines<br />
show the positions of the channel<br />
samples – 114131: HW sample; 114132:<br />
alteration zone; 114133: MV sample<br />
(material from the three channels across<br />
the MV is combined to one sample);<br />
114134: FW sample; Q110983: ‘quick’<br />
sample (chip) for immediate analysis<br />
(obtained parallel to the centre MV<br />
sample). Bars on the ranging rod are 20<br />
cm long.<br />
weakly altered<br />
fg lava<br />
weakly altered<br />
fg lava<br />
MV<br />
cs<br />
cs<br />
114131<br />
fg lava<br />
fg lava<br />
114133<br />
cs<br />
cs<br />
FW alteration<br />
450-44<br />
114132<br />
HW alteration<br />
Q110983<br />
cs<br />
moderately altered fg lava<br />
114134<br />
MV<br />
‘raise segment’) of about the same weight as one adit<br />
‘round’. Much attention was paid to recovery of all broken<br />
rock at the adit headings and below the raises.<br />
Temporary stockpiling during haulage was on a ‘roundby-round’<br />
basis on numbered concrete pads. Each time<br />
a bulk sample was moved, the pad was thoroughly<br />
cleaned, and the recovered fines added to the sample<br />
in order not to lose <strong>gold</strong> grains liberated during blasting<br />
and haulage of the broken rock.<br />
Each face was geologically mapped and sampled. <strong>The</strong><br />
face map for ‘round’ 44 at the 450 m level is illustrated<br />
in Fig. 5. <strong>The</strong> position and outline of each face was surveyed<br />
in relation to the mine grid. ‘Main Vein’, alteration<br />
halo, shearing and other features were traced in<br />
73
High grade<br />
tower rejects<br />
Sample<br />
tower<br />
Crushing<br />
circuit<br />
Coarse rock<br />
pads<br />
Reference<br />
samples<br />
Low grade<br />
tower rejects<br />
‘Fine ore’<br />
pads<br />
Fig. 6. Crushing and sampling plant at the valley floor below the ‘<strong>Nalunaq</strong>’ mountain (c. 500 m south of the camp in Fig. 2). See text<br />
for description of sample flow. Note the front-end-loader beside the sample tower and the person near centre of photograph for scale.<br />
Photo: Hans Christian Langager.<br />
detail and the presence of visible <strong>gold</strong> noted. <strong>The</strong> layout<br />
for the saw-cut channel samples (2–4 kg) is shown<br />
on Fig. 5. Three samples were taken across the MV<br />
extending a few cm into the wall-rock to include <strong>gold</strong><br />
located at the MV/wall-rock contact. <strong>The</strong> material from<br />
the three MV samples was combined to one sample.<br />
Depending on the width of the alteration zone, this<br />
phase was sometimes sampled independently in continuation<br />
of one of the MV samples. Samples were also<br />
obtained from the hanging wall (HW) and the foot wall<br />
(FW). A supplementary chip sample was taken parallel<br />
to the centre MV sample for immediate analysis.<br />
Raises were chip-sampled only, due to practical considerations.<br />
All map and sample information was digitised<br />
and saved together with a digital photograph of<br />
the face as individual layers in MapInfo (Geographical<br />
Information System). <strong>The</strong> area of the map units (MV,<br />
alteration zone, HW and FW) was determined for each<br />
face as part of the digital processing.<br />
All the face samples were analysed by XRAL Laboratories<br />
(Canada) by the Screen Fire Assay method.<br />
When assay data become available, the corresponding<br />
sample grade will be assigned to each of the geological<br />
map units together with a specific gravity from the<br />
calibration tests on <strong>Nalunaq</strong> reference samples by Lakefield<br />
Research Limited. <strong>The</strong> grade of each face will then<br />
be estimated by weighting grades by area and specific<br />
gravity. <strong>The</strong> estimated grade of a ‘round’ is the average<br />
of the two enclosing faces and will be compared to the<br />
grade of the corresponding bulk sample.<br />
Bulk sample processing<br />
<strong>The</strong> crushing and sampling plant is shown in Fig. 6. A<br />
total of 388 bulk samples were processed. A front-end<br />
loader feeds coarse blasted rock from one of the pads<br />
to a two-stage crushing circuit for reduction to less than<br />
20 mm (‘fine ore’). This material is hauled to one of the<br />
‘fine ore’ bins.<br />
‘Fine ore’ is fed to the top of the sample tower (Fig.<br />
6) by a conveyor belt. On its way down the tower the<br />
‘fine ore’ is passed through three consecutive sample<br />
splitters. A roll crusher is positioned between the second<br />
and third splitter for further reduction of the sampled<br />
‘fine ore’ to less than 6 mm. <strong>The</strong> sample material<br />
from the third splitter is manually fed through a riffle<br />
splitter, until the field sample of c. 35 kg is obtained.<br />
This is equivalent to 0.05% of the 70 t tower feed from<br />
a typical adit ‘round’ or ‘raise segment’.<br />
<strong>The</strong> rejects from the two first splitters are discharged<br />
to a pile beside the tower. Rejects from the two last splitters<br />
are collected in a numbered tote bag. After weighing<br />
(0.8–1 t) the tote bag is stored as reference material.<br />
74
<strong>The</strong> tower rejects were hauled to either the ‘high grade’<br />
or ‘low grade’ rejects pile (Fig. 6). This distinction is based<br />
on the geological face mapping, where observations of<br />
visible <strong>gold</strong> in the corresponding face automatically<br />
classify a bulk sample as ‘high grade’.<br />
<strong>The</strong> field samples were shipped to Lakefield Research<br />
Limited for laboratory treatment. At the laboratory, <strong>gold</strong><br />
was determined by the Screen Fire Assay method following<br />
several stages of screening/crushing/splitting.<br />
Implications for mining<br />
With respect to adding tonnage to the resource, the<br />
400 m and 450 m levels are encouraging, as they were<br />
both advanced beyond the innermost drill section, and<br />
thus tested new ground (Fig. 4). Grade data are not yet<br />
available, but repeated observations of visible <strong>gold</strong> are<br />
a positive indicator.<br />
<strong>The</strong> bulk sampling results from the adits and raises<br />
cannot be taken as a direct prediction of a production<br />
mill-feed grade, because the full-face advance would<br />
include a substantial amount of waste, compared to<br />
the resuing method to be applied during production mining.<br />
However, the grade of the bulk sample can be calculated<br />
over the width of the MV due to the detailed<br />
measurements of face size and MV size during the<br />
development. <strong>The</strong> bulk sampling results will provide a<br />
reliable estimate of the amount of <strong>gold</strong> contained in the<br />
excavated material. As this information is available on<br />
a ‘round-by-round’ basis, these numbers can be used<br />
both to test the continuity of <strong>gold</strong> mineralisation and<br />
to outline patterns in <strong>gold</strong> distribution in strike and dip<br />
directions. <strong>The</strong>se figures can be compared to the calculated<br />
grades from the face samples, to ascertain how<br />
channel/chip sampling can be used to predict grades.<br />
This will also allow selection of capping levels based<br />
on the specific conditions of the deposit, rather than<br />
using standard statistical techniques.<br />
<strong>The</strong> geological mapping programme provides information<br />
for detailed mine planning. <strong>The</strong> pre-feasibility<br />
study suggested mining by development of sublevels<br />
using the resuing technique. Extraction of the blocks<br />
between the sublevels would then be undertaken by<br />
long-hole stoping. A detailed control on fault geometry<br />
will be essential for stope layout. <strong>The</strong> acute angle<br />
of intersection observed between some of the faults<br />
and the MV (Fig. 4) indicates that a fault may influence<br />
a substantial part of a stope block, and this will have<br />
to be taken into account during stope design. <strong>The</strong> work<br />
in 2000 also demonstrated that much of the waste development<br />
required to access the vein for mining in the<br />
‘Target Block’, as proposed in the pre-feasibility study,<br />
will not be required as the mineralised material can be<br />
brought to the surface and taken down to the process<br />
plant. Furthermore, observations from the raises showed<br />
the vein to be much straighter than anticipated between<br />
the levels, which should allow for longer dimensions<br />
between the sublevels thereby reducing the required<br />
access development.<br />
If a mine is established, then the existing adits can<br />
be incorporated as sublevels in the mine. Furthermore,<br />
the 23 000 t of tower rejects will constitute a measured<br />
resource.<br />
Acknowledgements<br />
We thank <strong>Nalunaq</strong> I/S for generous permission to use unpublished<br />
exploration information. M.L. wishes to thank <strong>Nalunaq</strong> I/S<br />
and the Bureau of Minerals and Petroleum, Government of<br />
<strong>Greenland</strong>, for the invitation to visit the project site, and Henrik<br />
Thalenhorst, Strathcona Mineral Services Limited, Canada, for his<br />
thorough introduction to bulk sampling practice.<br />
References<br />
François-Bongarçon, D. 1998: Extensions to the demonstration<br />
of Gy’s formula. Exploration and Mining Geology 7(1–2),<br />
149–154.<br />
Gy, P.M. 1982: Sampling of particulate materials, theory and practice,<br />
431 pp. Amsterdam: Elsevier.<br />
John, M. & Thalenhorst, H. 1991: Don’t lose your shirt, take a<br />
bulk sample. In: Lawton, S.E. (ed.): Sampling and ore reserves,<br />
11–22. Toronto: Prospectors and Developers Association of<br />
Canada.<br />
Kaltoft, K., Schlatter, D.M. & Kludt, L. 2000: Geology and genesis<br />
of <strong>Nalunaq</strong> Palaeoproterozoic shear zone-hosted <strong>gold</strong><br />
deposit, <strong>South</strong> <strong>Greenland</strong>. In: Stendal, H. (compiler):<br />
Exploration in <strong>Greenland</strong>: discoveries of the 1990s. Transactions<br />
of the Institution of Mining and Metallurgy, section B, Applied<br />
earth science 109(January–April), B23–33.<br />
Authors’ addresses<br />
M.L., Geological Survey of Denmark and <strong>Greenland</strong>, Thoravej 8, DK-2400 Copenhagen NV, Denmark. E-mail: mli@geus.dk<br />
L.K.* & B.B., Crew Development Corporation, O.H. Bangsvei 54–58, N-1363 Høvik, Norway. * Present address: Mærsk Olie & Gas A/S,<br />
Esplanaden 50, DK-1263 Copenhagen K, Denmark.<br />
75
Reconnaissance for noble metals in Precambrian and<br />
Palaeogene rocks, Amdrup Fjord, southern East<br />
<strong>Greenland</strong><br />
Bjørn Thomassen and Johan Ditlev Krebs<br />
A zone of hydrothermal veins in the Kangerlussuaq<br />
region, southern East <strong>Greenland</strong>, is the focus of a oneyear<br />
project by the Geological Survey of Denmark and<br />
<strong>Greenland</strong> (GEUS). <strong>The</strong> project aims to localise, map,<br />
sample and analyse silver-<strong>gold</strong>-bearing veins in a selected<br />
area of Precambrian and Palaeogene rocks north of<br />
Amdrup Fjord (Figs 1, 2). This report describes the field<br />
work and presents some preliminary results.<br />
<strong>The</strong> study area comprises a c. 3 km wide and 10 km<br />
long ridge between Amdrup Fjord and Søndre<br />
Syenitgletscher, centred on the 938 m high mountain<br />
Flammefjeld (Figs 2, 3). <strong>The</strong> area is of alpine character<br />
with small glaciers and with extensive snow cover most<br />
of the year. <strong>The</strong> field programme was chosen to coincide<br />
with the time of minimum snow cover, from 25<br />
July – 23 August. During this period, the major part of<br />
the area was investigated on daily foot traverses from<br />
four fly camps, helped by helicopter lifts on two occasions.<br />
Logistically, the work was part of a larger expedition<br />
to East <strong>Greenland</strong> – EG 2000 – organised by the<br />
Danish Lithosphere Centre and GEUS, which is reported<br />
on elsewhere (Nielsen et al. 2001, this volume). A temporary<br />
field base in Sødalen, some 50 km east of Amdrup<br />
Fjord, supported the expedition’s Ecureuil AS 350 helicopter<br />
and provided services for the field teams of the<br />
various activities attached to EG 2000. Air connections<br />
with Iceland were maintained by Twin Otter aircraft<br />
operating from a gravel landing strip in Sødalen (Fig. 1).<br />
Geological setting<br />
<strong>The</strong> Kangerlussuaq region of southern East <strong>Greenland</strong><br />
is underlain by a Precambrian crystalline basement<br />
33°W<br />
S<br />
Palaeogene<br />
Ice<br />
Satellite intrusions<br />
Kangerdlugssuaq alkaline intrusion<br />
Lavas, gabbros and ultramafics<br />
Precambrian crystalline basement<br />
Kangerlussuaq<br />
68°15'N<br />
5 km<br />
Amdrup<br />
Fjord<br />
Bagnæsset<br />
Fig. 1. Simplified geological map of the<br />
Kangerdlugssuaq complex with the<br />
investigated area framed and shown in<br />
Fig. 2. On inset map arrow shows<br />
location of the study area and S: Sødalen.<br />
Modified from Nielsen (1987).<br />
76<br />
Geology of <strong>Greenland</strong> Survey Bulletin 189, 76–82 (2001) © GEUS, 2001
32°20'<br />
Søndre Syenitgletscher<br />
?<br />
68°15'<br />
0.3/-<br />
-/65<br />
1.0/-<br />
D<br />
1.4/191<br />
-/309<br />
1.5/127<br />
A<br />
Flammefjeld<br />
B<br />
1.0/1193<br />
?<br />
?<br />
?<br />
C<br />
68°15'<br />
0.6/-<br />
6.0/104<br />
0.3/56<br />
-/55<br />
E -/169 -/58<br />
0.2/-<br />
0.9/-<br />
Amdrup Fjord / Atterteq<br />
0<br />
32°20'<br />
2.2/213<br />
1<br />
2 km<br />
?<br />
7.5/70<br />
?<br />
Vein-type mineralisation with strike<br />
direction indicated<br />
0.1/75 Max. ppm Au/Ag<br />
Glacier<br />
Palaeogene Flammefjeld complex<br />
Palaeogene Kangerdlugssuaq complex<br />
Archaean crystalline basement<br />
?<br />
?<br />
Contour interval 100 m<br />
Fig. 2. Simplified geological map of the Amdrup Fjord area, showing occurrences of in situ vein-type mineralisation and localities<br />
A–E. Maximum <strong>gold</strong> and silver values are shown where Au > 0.1 ppm and Ag > 50 ppm. Bedrock geology based on Kempe et al.<br />
(1970), Geyti & Thomassen (1983) and Myers (1988).<br />
intruded by magmatic rocks generated during the continental<br />
break-up of the North Atlantic in the Early<br />
Palaeogene (Wager 1934; Brooks & Nielsen 1982). <strong>The</strong><br />
crystalline basement consists predominantly of quartzofeldspathic<br />
gneisses formed during a major late Archaean<br />
episode of sialic crust formation between 3.0 and 2.8<br />
Ga ago (Taylor et al. 1992).<br />
<strong>The</strong> Palaeogene magmatic rocks include extensive<br />
plateau basalts, several felsic and mafic alkaline intrusions<br />
and a major coast-parallel dyke swarm. <strong>The</strong> largest<br />
of the intrusions is the Kangerdlugssuaq complex located<br />
on the west side of the fjord Kangerlussuaq (formerly<br />
‘Kangerdlugssuaq’). This consists of the c. 50 Ma<br />
Kangerdlugssuaq alkaline intrusion and a number of both<br />
older and younger satellite intrusions (Fig. 1; Kempe et<br />
al. 1970; Brooks & Gill 1982; Nielsen 1987). <strong>The</strong> c. 700<br />
km 2 Kangerdlugssuaq alkaline intrusion consists of concentric<br />
zones with gradational contacts of quartz syenite<br />
at the outside through syenite to nepheline syenite<br />
at the centre. <strong>The</strong> satellite intrusions include a variety<br />
of syenites and granites. <strong>The</strong> presumed youngest intrusive<br />
rocks comprise the 500 x 800 m sub-volcanic<br />
Flammefjeld complex which is intruded into quartz syenites<br />
at the contact between the Kangerdlugssuaq alkaline<br />
intrusion and younger satellite intrusions (Fig. 3). <strong>The</strong><br />
Flammefjeld complex comprises a breccia pipe intruded<br />
by quartz porphyries and surrounded by a halo of<br />
hydrothermal alteration displaying vivid yellow and red<br />
oxidation colours; the name Flammefjeld translates as<br />
‘flame mountain’ (Geyti & Thomassen 1984).<br />
Mineral exploration by Nordisk Mineselskab A/S in<br />
1970 and 1982 east and north of Flammefjeld revealed<br />
a number of base metal-bearing hydrothermal veins<br />
with enhanced silver and <strong>gold</strong> concentrations as well<br />
as stockwork-type molybdenum mineralisation in granitic<br />
breccia fragments of the Flammefjeld breccia pipe<br />
(Brooks 1971; Thomassen 1971; Geyti & Thomassen<br />
1983, 1984; Brooks et al. 1987). <strong>The</strong> existence of a blind<br />
‘Climax-type’ porphyry molybdenum deposit at 300–500<br />
m a.s.l. below Flammefjeld, and 1–2 km below the<br />
palaeosurface, has been suggested (Geyti & Thomassen<br />
1983; Stenstrop 1987). Hydrothermal veins of quartz-<br />
77
Fig. 3. View to the west of ‘Tågegang’<br />
(locality B) with Flammefjeld in the<br />
background to the left. For scale, note<br />
person clad in red (arrowed) collecting<br />
chip samples (GGU 456522, 23) over part<br />
of the c. 30 m wide vein structure.<br />
carbonate cemented breccia are widespread in the<br />
Kangerlussuaq region, but tend to be barren outside the<br />
Amdrup Fjord area (Brooks 1972; Geyti & Thomassen<br />
1983; Brooks et al. 1987).<br />
Subsequently, the ‘Ujarassiorit’ annual minerals hunt<br />
programme managed by the Bureau of Minerals and<br />
Petroleum, Nuuk, <strong>Greenland</strong>, has received a number<br />
of <strong>gold</strong>-bearing rock samples from the area (Dunnells<br />
1995). <strong>The</strong>se samples are described as pyrite-bearing<br />
vein quartz with up to 24 ppm Au, often hosted by a<br />
basaltic wall rock; unfortunately, the precise sample<br />
localities are not known.<br />
Preliminary results<br />
During the field work all outcrops with visible in situ<br />
mineralisation were investigated and sampled. Where<br />
possible, 2–4 kg chip samples were collected across a<br />
mineralised structure; otherwise composite or selected<br />
grab samples were taken. Loose blocks with sulphides<br />
from either scree cones or local moraines were also sampled,<br />
and stream sediment samples and panned heavy<br />
mineral concentrates were collected from water courses.<br />
All samples were analysed for 49 elements by a combination<br />
of instrumental neutron activation and induc-<br />
Table 1. Summary of selected elements for mineralised rock samples, Amdrup Fjord area<br />
Type Vein / in situ Vein / float Disseminated / in situ & float<br />
82 samples / 40 localities 49 samples / 36 localities 22 samples / 18 localities<br />
Range Average Median Range Average Median Range Average Median<br />
Au ppb < 2–7540 390 35 < 2–38400 1842 35 < 2–3430 186 15<br />
Ag ppm < 1–1193 59 6 < 1–687 55 10 < 1–47 4 < 1<br />
Cu ppm 2–46670 1901 70 < 1–35150 1160 74 6–145 43 28<br />
Pb ppm < 3–431400 18786 1331 63–447200 32538 1773 < 3–10010 1082 125<br />
Zn ppm 7–65510 6249 914 16–34220 4711 1506 11–5043 750 173<br />
Bi ppm < 2–628 47 5 < 2–91 7 < 2 < 2–121 10 3<br />
Mo ppm < 1–410 21 4 < 1–1430 69 4 < 1–31 7 5<br />
As ppm 1–26700 1200 95 2–27500 979 149 2–1030 104 49<br />
Sb ppm < 1–4350 246 6 < 1–722 70 11 < 1–17 2 1<br />
Mn ppm 55–> 100000 18877 4716 14–> 100000 24110 13430 26–11260 2949 1703<br />
S % 0.01–25.73 4.00 1.39 0.02–16.93 3.32 1.74 0.29–12.09 2.98 2.01<br />
Analyses by Activation Laboratories Ltd., Ontario, Canada.<br />
Analytical methods:<br />
Inductively coupled plasma emission spectrometry: Ag, Cu, Pb, Zn, Mo, Bi, S.<br />
Instrumental neutron activation: Au, As, Sb, Mn (Fe).<br />
Fire assay: Au > 100 ppb, Ag > 100 ppm and Pb > 2 pct.<br />
78
tively coupled plasma emission spectrometry. Samples<br />
with > 0.1 ppm Au, > 100 ppm Ag, or > 2% Pb were<br />
subsequently assayed for these elements. <strong>The</strong> description<br />
below is based on field observations and analytical<br />
results.<br />
Two types of mineralisation were observed and examined:<br />
(1) disseminated mineralisation, and (2) vein<br />
mineralisation. <strong>The</strong> known porphyry molybdenum mineralisation<br />
at Flammefjeld was not re-investigated during<br />
the 2000 field work.<br />
1. Disseminated mineralisation<br />
This type of mineralisation consists of pyrite disseminated<br />
in syenites; it is spatially and genetically related<br />
to the Flammefjeld intrusive complex which owes its<br />
conspicuous coloration to the oxidation of pyrite. <strong>The</strong><br />
intensity of pyritisation diminishes away from the complex,<br />
and at about 1 km distance only isolated patches<br />
of pyrite-bearing syenite occur. Minor amounts of galena<br />
were noted in a few samples. Analytical results, summarised<br />
in Table 1, indicate that base metals and silver<br />
are low in this mineralisation type and only four samples<br />
returned more than 0.1 ppm Au. Of these, two samples<br />
with 3.4 ppm and 0.1 ppm Au respectively, stem<br />
from a > 10 m rusty outcrop west of Flammefjeld, near<br />
locality D (Fig. 2).<br />
2. Vein mineralisation<br />
Hydrothermal vein zones are widespread in both the<br />
syenitic and gneissic parts of the area within a distance<br />
of 5 km from Flammefjeld; some 40 in situ localities with<br />
this type of mineralisation were observed and sampled.<br />
Red-brown weathering colours of carbonates, black<br />
staining of manganese oxide and the intersection of<br />
brittle structures are useful guides to mineralisation. In<br />
the syenite area, mineralisation is nearly always located<br />
in cross-cutting dolerite dykes. <strong>The</strong>se dykes are finegrained,<br />
typically 1–3 m wide and steeply dipping with<br />
mainly NNW to NW trends.<br />
<strong>The</strong> mineralised veins generally have widths in the<br />
cm–dm range. However, a few vein systems have widths<br />
in the metre range, and can be followed over distances<br />
of several hundreds of metres. <strong>The</strong> veins are typically<br />
developed as breccia fillings and crustifications of<br />
epithermal character, often displaying vuggy and colloform<br />
structures (cockade structures) (Fig. 4). Gangue<br />
minerals are quartz, calcite, Fe-Mn-Mg-carbonates and<br />
occasionally fluorite and barite. Galena is the most common<br />
ore mineral, followed by pyrite and sphalerite.<br />
Copper minerals (chalcopyrite and tetrahedrite-tennantite)<br />
are less common and arsenopyrite occurs sporadically.<br />
<strong>The</strong> sulphides occur as massive lenses and<br />
irregular seams of cm-thickness, and disseminated. Total<br />
sulphide concentrations rarely exceed 1% over the full<br />
width of the veins. <strong>The</strong> wall rocks exhibit silicification,<br />
carbonatisation, kaolinisation and phyllic alteration,<br />
with propylitic alteration of the mafic dykes.<br />
<strong>The</strong> processes of brecciation, alteration and invasion<br />
of quartz, carbonates and sulphides affect the doleritic,<br />
syenitic or gneissic wall rocks to various degrees. <strong>The</strong><br />
dolerites are typically asymmetrically mineralised, i.e.<br />
they are only mineralised on one side along the contact<br />
with unaltered syenite, and the ratios between fissure<br />
veins, cemented dyke rock breccias and unaffected<br />
dolerite wall rock are very variable. At some localities<br />
the entire width of a dyke is altered and mineralised;<br />
this is typically the case at the intersection of two or<br />
more dykes.<br />
Vein mineralisation types and their metal<br />
concentrations<br />
<strong>The</strong> vein mineralisation can be grouped into three types<br />
according to their dominant sulphides (Fig. 4):<br />
1. Pyrite-bearing veins with typical widths in the cm–dm<br />
range. <strong>The</strong>se predominate along the coast. <strong>The</strong> <strong>gold</strong>bearing<br />
‘Ujarassiorit’ samples (mentioned above)<br />
seem to be of this type.<br />
2. Galena-sphalerite-pyrite veins. This is the most common<br />
type, and the largest outcrop encountered is the<br />
30 × 200+ m ‘Tågegang’ of Geyti & Thomassen (1983;<br />
locality B, Figs 2, 3). <strong>The</strong> metal contents of two chip<br />
samples from locality B are given in Table 2, which<br />
also shows values from two other localities of this<br />
type (localities C, D).<br />
3. Chalcopyrite-tetrahedrite-tennantite-pyrite ± galena<br />
± sphalerite veins. <strong>The</strong>se are only known from three<br />
outcrops and two boulder finds. <strong>The</strong> most prominent<br />
example is the ‘Yellow Zone’ of Geyti & Thomassen<br />
(1983), located at the northern margin of the<br />
Flammefjeld breccia pipe (locality A). This comprises<br />
a 50 × 200+ m vein swarm with individual vein thickness<br />
in the metre range (see Frontispiece of this volume,<br />
p. 3). Examples of chip sample values from this<br />
locality are given in Table 2.<br />
Metal contents for 130 samples of vein-type mineralisation<br />
are summarised in Table 1. Gold concentrations<br />
above 0.1 ppm were recorded in 28% of these samples,<br />
79
A<br />
B<br />
C<br />
2 cm<br />
D<br />
Fig. 4. Four hand-specimens showing typical vein mineralisation. A: Weathered surface of quartz-carbonate gangue displaying colloform<br />
structures. B: Cut surface of type (1) vein showing dolerite invaded by vein quartz and pyrite with 0.6 ppm Au and 37 ppm Ag.<br />
C: Cut surface of type (2) vein with brecciated structures (bluish chalcedony fragment to the left, bands of sulphides in the centre)<br />
and containing 14.4% Pb, 4.9% Zn and 309 ppm Ag. D: Cut surface of type (3) vein with seam of pyrite-chalcopyrite-tetrahedrite in<br />
quartz-carbonate gangue displaying colloform and vuggy structures, and with 1.5 ppm Au, 104 ppm Ag, 0.6% Cu, 0.5% Pb and 0.6%<br />
Zn. <strong>The</strong> scale bar is 2 cm. Photo: Jakob Lautrup.<br />
while concentrations above 1 ppm were recorded in<br />
12% with two maximum values of 38 ppm Au. Enhanced<br />
<strong>gold</strong> values are most common in vein types (1) and (3),<br />
and are often associated with copper, arsenic and bismuth,<br />
but rarely with silver. <strong>The</strong> Ag/Au ratio has a<br />
median of 200 for samples with > 0.1 ppm Au and/or<br />
> 50 ppm Ag. <strong>The</strong> overall distribution of <strong>gold</strong> and silver<br />
concentrations indicates that elevated values occur<br />
within a distance of 3–4 km from Flammefjeld, whereas<br />
low values characterise the gneisses to the east and the<br />
nepheline syenites to the west (Fig. 2).<br />
<strong>The</strong> highest in situ <strong>gold</strong> values (up to 7.5 ppm) stem<br />
from vein types (1) and (3) along the coast south and<br />
south-east of Flammefjeld. <strong>The</strong> one maximum <strong>gold</strong><br />
value of 38 ppm stems from a pyrite-arsenopyrite-bearing<br />
float collected near the coast 3 km south-west of<br />
Flammefjeld (locality E, Fig. 2). Together with other<br />
nearby auriferous type (1) floats and veinlets, the gentle<br />
slopes of this area constitute a worthwhile <strong>gold</strong><br />
exploration target. <strong>The</strong> other maximum <strong>gold</strong> value stems<br />
from a strongly oxidised type (3) float collected on the<br />
glacier east of Flammefjeld just north-west of locality<br />
B. Two other nearby float samples returned 28 ppm and<br />
2 ppm Au, respectively. Distinct vein structures occur<br />
in a steep cliff above the collection sites.<br />
Silver concentrations above 50 ppm occur in 25% of<br />
the samples, values above 100 ppm in 15% and above<br />
200 ppm in 8%; the maximum value recorded is 1193<br />
ppm Ag. Silver correlates well with lead and is most<br />
common in vein types (2) and (3). <strong>The</strong> sample with 1193<br />
ppm Ag stems from locality B (‘Tågegang’). Locality B<br />
and floats just north-west of locality B account for seven<br />
of the eight samples which yielded silver values above<br />
250 ppm. <strong>The</strong> eighth sample comes from locality D.<br />
Outcrop samples and float from a vein system 1 km east<br />
of locality E yielded 222 ppm, 169 ppm and 55 ppm<br />
Ag, whereas the previously reported high silver concentrations<br />
at locality C (‘Wild Willys Vein’, Brooks<br />
1971) could not be confirmed (Table 2).<br />
Average and median values in Table 1 indicate that<br />
Pb > Zn > Cu and thereby confirm the field observations.<br />
Lead values above 1% were returned from 25%<br />
80
Table 2. Analytical values of selected chip samples, Amdrup Fjord area<br />
Locality A A B C D<br />
GGU sample no. 456531 456538 456522–23 456401 456463<br />
Length in m 5 4 10 5 1<br />
Au ppm 1.03 0.34 0.21 0.05 0.05<br />
Ag ppm 96 127 157 36 256<br />
Ag/Au 93 374 748 720 5120<br />
Cu% 1.51 0.78 0.03 0.02 0.03<br />
Pb% 0.51 1.36 10.23 1.73 7.45<br />
Zn% 0.57 3.23 0.98 0.08 1.66<br />
Bi ppm 121 30 22 14 < 2<br />
Mo ppm 245 108 2 7 5<br />
Fe% 14.37 4.36 9.20 6.58 6.85<br />
As% 0.26 0.19 0.01 0.01 0.02<br />
Sb% 0.21 0.32 0.02 < 0.01 0.02<br />
S% 13.79 5.73 2.44 0.29 2.39<br />
Mn% 3.73 0.47 6.85 1.64 0.85<br />
Analyses: details as for Table 1. Localities are shown on Fig. 2.<br />
of the samples, zinc values above 1% were returned from<br />
17%, and copper values above 1% were returned from<br />
5%. <strong>The</strong> vein-type mineralisation is also characterised<br />
by relative high manganese concentrations, and occasionally<br />
elevated arsenic, antimony, molybdenum and<br />
bismuth (see Table 1).<br />
Concluding remarks<br />
Prior to the field work in 2000, five hydrothermal vein<br />
systems were known from the Amdrup Fjord area; during<br />
the summer an additional 35 veins, albeit mostly of<br />
modest size, were found. We assume that several more<br />
could have been found given more time, and we conclude<br />
that mineralisation is surprisingly widespread<br />
around Flammefjeld.<br />
<strong>The</strong> vein-type mineralisation centred on Flammefjeld<br />
is confined to brittle structures and shows similarities<br />
with epithermal <strong>gold</strong>-silver veins of low-sulphidation<br />
type generated at shallow depths, i.e. within c. 1.5 km<br />
of the Earth’s surface (see e.g. Sillitoe 1993). Porphyrytype<br />
deposits, like that proposed below Flammefjeld (see<br />
above), are often accompanied by distal base metal<br />
veins enriched in precious metals, as is the case in the<br />
investigated area, and a genetic relationship between<br />
the two is likely. No distinct hydrothermal zoning centred<br />
on Flammefjeld was observed for the vein-type<br />
mineralisation, but proximal copper – distal lead is indicated,<br />
and the predominance of pyrite over galena<br />
along the shore of Amdrup Fjord also suggests a vertical<br />
pyrite-galena zonation. No obvious preferred orientation<br />
of the mineralised veins could be identified,<br />
but an ongoing structural study based on LANDSAT<br />
images and aerial photographs aims to investigate this<br />
issue further. <strong>The</strong> vein-type mineralisation which was<br />
encountered is unlikely to yield economic base metal<br />
deposits, but does have a potential for <strong>gold</strong> and silver.<br />
Among the proposed targets for further exploration are<br />
the coast south-east of Flammefjeld and the sub-areas<br />
designed as A, B, D and E on Fig. 2.<br />
<strong>The</strong> reconnaissance project centred on the Amdrup<br />
Fjord region and Flammefjeld will be concluded with<br />
a report including sample descriptions, locality maps<br />
and chemical analyses. <strong>The</strong> results from this project<br />
will be incorporated in the Survey’s assessment of the<br />
regional ore potential in the Palaeogene igneous<br />
province of East <strong>Greenland</strong>.<br />
References<br />
Brooks, C.K. 1971: Report covering the <strong>prospect</strong>ing activities of<br />
Group 5 during the summer of 1970 in the area of<br />
Kangerdlugssuaq, East <strong>Greenland</strong>, ca. 68º north latitude, 29<br />
pp. Unpublished report, Nordisk Mineselskab A/S, Copenhagen<br />
(in archives of Geological Survey of Denmark and <strong>Greenland</strong>,<br />
GEUS Report File 20903).<br />
Brooks, C.K. 1972: Report on the <strong>prospect</strong>ing of Group 5 in the<br />
<strong>South</strong>ern Concession Area (Kangerdlugssuaq), 35 pp.<br />
Unpublished report, Nordisk Mineselskab A/S, Copenhagen<br />
(in archives of Geological Survey of Denmark and <strong>Greenland</strong>,<br />
GEUS Report File 20907).<br />
81
Brooks, C.K. & Gill, C.O. 1982: Compositional variation in the<br />
pyroxenes and amphiboles of the Kangerdlugssuaq intrusion,<br />
East <strong>Greenland</strong>: further evidence for crustal contamination of<br />
syenite magma. Mineralogical Magazine 45, 1–9.<br />
Brooks, C.K. & Nielsen, T.F.D. 1982: <strong>The</strong> Phanerozoic development<br />
of the Kangerdlugssuaq area, East <strong>Greenland</strong>. Meddelelser<br />
om Grønland Geoscience 9, 30 pp.<br />
Brooks, C.K., Schønwandt, H.K. & Stenstrop, G. 1987: Reconnaissance<br />
for economic minerals in the Kangerdlugssuaq area,<br />
East <strong>Greenland</strong>. Rapport Grønlands Geologiske Undersøgelse<br />
135, 66–68.<br />
Dunnells, D. 1995: Ujarassiorit: 1989 to 1994. A summary report<br />
of years 1–6, 41 pp. Unpublished report, Nunaoil A/S, Nuuk,<br />
<strong>Greenland</strong> (in archives of Geological Survey of Denmark and<br />
<strong>Greenland</strong>, GEUS Report File 21421).<br />
Geyti, A. & Thomassen, B. 1983: Exploration for molybdenum<br />
and precious metals at Flammefjeld, <strong>South</strong>-East <strong>Greenland</strong>, 51<br />
pp. Unpublished report, Nordisk Mineselskab A/S, Copenhagen<br />
(in archives of Geological Survey of Denmark and <strong>Greenland</strong>,<br />
GEUS Report File 20774).<br />
Geyti, A. & Thomassen, B. 1984: Molybdenum and precious metal<br />
mineralization at Flammefjeld, <strong>South</strong>east <strong>Greenland</strong>. Economic<br />
Geology 79, 1921–1929.<br />
Kempe, D.R.C., Deer, W.A. & Wager, L.R. 1970: Geological investigations<br />
in East <strong>Greenland</strong>. Part VIII. <strong>The</strong> petrology of the<br />
Kangerdlugssuaq intrusion, East <strong>Greenland</strong>. Meddelelser om<br />
Grønland 190(2), 49 pp.<br />
Myers, J.S. 1988: Geological map of <strong>Greenland</strong>, 1:500 000,<br />
Kangerdlugssuaq, sheet 13. Copenhagen: Geological Survey<br />
of <strong>Greenland</strong>.<br />
Nielsen T.F.D. 1987: Tertiary alkaline magmatism in East <strong>Greenland</strong>:<br />
a review. In: Fitton, J.G. & Upton, B.G.J. (eds): Alkaline igneous<br />
rocks. Geological Society Special Publication (London) 30,<br />
489–515.<br />
Nielsen, T.F.D., Hansen, H., Brooks, C.K., Lesher, C.E. & field parties<br />
2001: <strong>The</strong> East <strong>Greenland</strong> continental margin, the Prinsen<br />
af Wales Bjerge and new Skaergaard intrusion initiatives.<br />
Geology of <strong>Greenland</strong> Survey Bulletin 189, 83–98 (this volume).<br />
Sillitoe, R.H. 1993: Epithermal models: genetic types, geometrical<br />
controls and shallow features. In: Kirkham, R.V. et al. (eds):<br />
Mineral deposit modelling. Geological Association of Canada<br />
Special Paper 40, 403–417.<br />
Stenstrop, G. 1987: New field investigations of the porphyry<br />
molybdenum and vein-type mineralizations at Flammefjeld,<br />
southern East <strong>Greenland</strong>, 37 pp. Unpublished report, Geological<br />
Survey of <strong>Greenland</strong>, Copenhagen.<br />
Taylor, P.N., Kalsbeek, F. & Bridgwater, D. 1992: Discrepancies<br />
between neodymium, lead and strontium model ages from the<br />
Precambrian of southern East <strong>Greenland</strong>: Evidence for a<br />
Proterozoic granulite-facies event affecting Archaean gneisses.<br />
Chemical Geology (Isotope Geoscience section) 94, 281–291.<br />
Thomassen, B. 1971: Prospektering i Østgrønland. Grønland<br />
1971(12), 365–374. Charlottenlund, Denmark: Det Grønlandske<br />
Selskab.<br />
Wager, L.R. 1934: Geological investigations in East <strong>Greenland</strong>. Part<br />
I. General geology from Angmagsalik to Kap Dalton.<br />
Meddelelser om Grønland 105(2), 46 pp.<br />
Authors’ addresses<br />
B.T., Geological Survey of Denmark and <strong>Greenland</strong>, Thoravej 8, DK-2400 Copenhagen NV, Denmark. E-mail: bth@geus.dk<br />
J.D.K., Geological Institute, University of Copenhagen, Øster Voldgade 10, DK-1350 Copenhagen K, Denmark.<br />
82
<strong>The</strong> East <strong>Greenland</strong> continental margin, the Prinsen af<br />
Wales Bjerge and new Skaergaard intrusion initiatives<br />
Troels F.D. Nielsen, Henriette Hansen, C. Kent Brooks, Charles E. Lesher and field parties<br />
<strong>The</strong> rifted volcanic margin of East <strong>Greenland</strong> has<br />
remained a major area for field studies and the development<br />
of models for the dynamics of plume-related<br />
continental break-up since the start of the Danish<br />
Lithosphere Centre (DLC) in 1994. <strong>The</strong> studies cover a<br />
range of disciplines and geological processes from the<br />
early development of pre-break-up basin formation and<br />
sedimentation over the main phase of basaltic magmatism<br />
to the late stages of alkaline magmatism and<br />
structural re-equilibration.<br />
<strong>The</strong> East <strong>Greenland</strong> field activities in the summer of<br />
2000, collectively referred to as EG 2000, were facilitated<br />
by a logistic platform provided by support from<br />
Statens Naturvidenskabelige Forskningsråd (SNF, the<br />
Danish Natural Science Research Council) and the<br />
Bureau of Minerals and Petroleum (BMP) in Nuuk,<br />
<strong>Greenland</strong> for the retrieval of 6 km of drillcore from the<br />
Skaergaard intrusion. During 1989 and 1990 mineral<br />
exploration had resulted in drilling of more than 15 km<br />
of core through the classic layered gabbros. <strong>The</strong> logistic<br />
platform also provided support for DLC and<br />
Geological Survey of Denmark and <strong>Greenland</strong> (GEUS)<br />
field work and projects throughout the Kangerlussuaq<br />
region and on the Blosseville Kyst (Fig. 1), as well as<br />
mineral exploration and petroleum company activities.<br />
Study region, field parties and logistics<br />
EG 2000 operated from 19 July to 28 August 2000 out<br />
of a base in Sødalen (Fig. 1), where a 600 m long STOL<br />
air strip and base facilities, including two huts, had<br />
been established between 1982 and 1990. During the<br />
first week of the operation a four-man team packed and<br />
air-freighted Skaergaard drillcore to Iceland. Return<br />
flights to <strong>Greenland</strong> were used for the transport of<br />
equipment, and from 25 July and onwards for field parties.<br />
<strong>The</strong> field operations were supported by an Aerospatial<br />
AS350 B2 helicopter and additional transport<br />
was provided by a wooden boat and a rubber dinghy.<br />
<strong>The</strong> personnel involved in EG 2000 and their affiliations<br />
are listed in Table 1. <strong>The</strong> main areas of activity<br />
(Fig. 1) included:<br />
1. Studies of plateau basalt successions (C.E.L., C.T.,<br />
L.H., J.S., see Table 1), the Borgtinderne syenite intrusions<br />
(P.K., S.B.), the newly discovered ultramafic<br />
Ejnar Mikkelsen intrusion (P.K., S.B.), and a regional<br />
swarm of lamprophyre dykes with mantle nodules<br />
in the area between Savary Fjord and Wiedemann<br />
Fjord on the central part of Blosseville Kyst and<br />
inland as far as Borgtinderne (P.K., S.B.).<br />
2. Studies of inland plateau basalt successions in Prinsen<br />
af Wales Bjerge (H.H., A.K.), and at Tjældebjerget<br />
(H.H., A.K., L.H., C.E.L.).<br />
3. Studies of the pre-basaltic sedimentary basin between<br />
Sødalen, inland and along Christian IV Gletscher<br />
(M.L., M.B., S.O., T.N.; see also Larsen et al. 2001,<br />
this volume).<br />
4. Correlation of plateau basalt formations across Nansen<br />
Fjord and towards Kangerlussuaq in the coastal area<br />
between Nansen Fjord and Miki Fjord (M.G., L.H.,<br />
C.E.L.).<br />
5. Systematic sampling of profiles and field investigations<br />
in the Skaergaard intrusion on the eastern shore<br />
of Kangerlussuaq (C.E.L., P.T., C.T., A.F., J.J., J.S.) and<br />
a reconnaissance gravimetry programme over the<br />
intrusion (C.K.B., M.K.).<br />
6. Regional sampling of the Kangerdlugssuaq alkaline<br />
intrusion and the Astrophyllite Bay complex on the<br />
western side of Kangerlussuaq (C.K.B., D.W.P., M.S.R.).<br />
7. Investigation and sampling of disseminated and veinrelated<br />
Au-Ag mineralisations in the Amdrup Fjord<br />
– Søndre Syenite Gletscher area on the west side of<br />
Kangerlussuaq (B.T., J.D.K.; see also Thomassen &<br />
Krebs 2001, this volume).<br />
Geology of <strong>Greenland</strong> Survey Bulletin 189, 83–98 (2001) © GEUS, 2001<br />
83
I<br />
I<br />
I<br />
I<br />
I<br />
I I<br />
I<br />
40°<br />
32°<br />
24°<br />
16°<br />
75°<br />
Palaeogene basalt<br />
I<br />
Shannon Ø<br />
75°<br />
<strong>Greenland</strong><br />
D<br />
I<br />
Cretaceous/Palaeogene sediments<br />
pre-Cretaceous<br />
Palaeogene intrusive centre<br />
Major fault<br />
I I<br />
I<br />
Daneborg<br />
I<br />
I<br />
K<br />
N<br />
A<br />
K<br />
100 km<br />
I I<br />
I<br />
I<br />
I<br />
I I I I I<br />
Hold with Hope<br />
Myggbukta<br />
Kap Parry<br />
72°<br />
Kap Simpson<br />
I<br />
72°<br />
Werner Bjerge<br />
16°<br />
Inland Ice<br />
Hjørnedal<br />
S c o r e s b y<br />
S und<br />
Illoqqortoormiit/<br />
Scoresbysund<br />
69°<br />
Ejnar Mikkelsen Fjeld<br />
Kronborg Gletscher<br />
Tjældebjerget<br />
Prinsen af Wales Bjerge<br />
Borgtinderne<br />
Sortebræ<br />
Kap Dalton<br />
Barclay Bugt<br />
69°<br />
Christian IV Gletscher<br />
Gardiner complex<br />
Kangerlussuaq<br />
Kangerdlugssuaq intrusion<br />
Amdrup Fjord<br />
Kap Daussy<br />
Savary Fjord<br />
Wiedemann Fjord<br />
Lilloise intrusion<br />
Nansen Fjord<br />
J.A.D. Jensen Fjord<br />
Sødalen<br />
Miki Fjord<br />
Skaergaard intrusion<br />
Kap Edvard Holm<br />
Blosseville Kyst<br />
66°<br />
Nugalik/Kruuse Fjord<br />
Imilik/Kialineq<br />
Kap Gustav Holm<br />
Sulugssut complex<br />
D e n m a r k S t r a i t<br />
Isafjördur<br />
Iceland<br />
66°<br />
40°<br />
Ammassalik<br />
32° 24 °<br />
Fig. 1. Map of the Palaeogene East <strong>Greenland</strong> igneous province. ‘Astrophyllite Bay’ is located on the north shore of outer Amdrup<br />
Fjord. Insert map abbreviations – A: Ammassalik; D: Danmarkshavn; K: Kassortoq; N: Narsarsuaq and K : Kangerlussuaq / Søndre<br />
Strømfjord. Modified after Brooks & field parties (1996).<br />
84
8. Establishment of seismic stations in Sødalen, Hjørnedal<br />
in the inner Scoresby Sund fjord system (70°N) and<br />
in Singertat intrusion in Kassortoq fjord c. 300 km<br />
south of Ammassalik (O.G.).<br />
9. Selection, packing and transport of 16 tons of research<br />
core and 4 tons of exploration core from the<br />
Skaergaard intrusion to the Geological Museum in<br />
Copenhagen and to the BMP core library in Kangerlussuaq<br />
/ Søndre Strømfjord, West <strong>Greenland</strong> (T.F.D.N.,<br />
J.G., C.E.L., J.S.).<br />
Pre-basaltic basin development and<br />
sedimentation<br />
Since the early description of the ‘Kangerdlugssuaq<br />
Sedimentary Series’ (now Kangerdlugssuaq Basin) by<br />
Wager & Deer (1939) and Wager (1947), the pre-basaltic<br />
sediments have received periodic attention by a number<br />
of research groups (e.g. Soper et al. 1976a, b; Nielsen<br />
et al. 1981; Larsen, M. et al. 1996, 1999). Taking the view<br />
that the development of the sedimentary basin and its<br />
structural evolution is an integrated part of the continental<br />
break-up process, the sedimentary studies in the<br />
Kangerlussuaq region may provide important constraints<br />
for the models of plume impingement and the dynamics<br />
of the break-up process.<br />
<strong>The</strong> summer 2000 field work (see Larsen et al. 2001,<br />
this volume) focused on sedimentology, biostratigraphy<br />
and diagenesis. Special attention was paid to: (1) sedimentology<br />
and ammonite biostratigraphy in a coarsegrained<br />
Lower Cretaceous succession forming the<br />
lowermost sedimentary unit in the area; (2) sampling<br />
of a mudstone succession of presumed Upper Cretaceous<br />
age in order to improve the existing biostratigraphy; and<br />
(3) detailed studies of the transition between sediments<br />
and the earliest volcanic succession. In addition a number<br />
of sections were sampled in order to illustrate the<br />
influence of intrusions on sandstone diagenesis.<br />
In connection with GEUS field work, a group of sedimentologists<br />
and geophysicists from the oil industry visited<br />
Sødalen. <strong>The</strong> group focused on the possibility of<br />
using the sediments of the Kangerlussuaq Group (Larsen<br />
et al. 1996) as an outcrop analogue for basin evolution<br />
in the offshore areas around the Faeroe Islands. A number<br />
of key sections were visited and the sedimentological<br />
and sequence stratigraphic models discussed with Survey<br />
personnel. <strong>The</strong> excursion was led by L. Hamberg, Dansk<br />
Olie og Naturgas (DONG).<br />
Institutions<br />
Table 1. List of participants and<br />
institutions with abbreviations<br />
AU Aarhus Universitet (Aarhus University), Århus, Denmark.<br />
BMP Bureau of Minerals and Petroleum, Nuuk, <strong>Greenland</strong>.<br />
DLC Danish Lithosphere Centre, Copenhagen, Denmark.<br />
GEUS Danmarks og Grønlands Geologiske Undersøgelse<br />
(Geological Survey of Denmark and <strong>Greenland</strong>), Copenhagen,<br />
Denmark.<br />
KMS Kort & Matrikelstyrelsen (National Survey and Cadastre,<br />
Denmark), Copenhagen, Denmark.<br />
KU Københavns Universitet (University of Copenhagen), Copenhagen,<br />
Denmark.<br />
NGU Norges Geologiske Undersøgelse (Geological Survey of<br />
Norway), Trondheim, Norway.<br />
SNF Statens Naturvidenskabelige Forskningsråd (Danish Natural<br />
Science Research Council), Copenhagen, Denmark.<br />
UCD University of California Davis, Davis, USA.<br />
Participants and contributors<br />
A.F. Anja K.M. Fonseca KU/DLC<br />
A.K. Adam J.R. Kent DLC<br />
B.T. Bjørn Thomassen GEUS<br />
C.E.L. Charles E. Lesher UCD<br />
C.K.B. C. Kent Brooks KU/DLC<br />
C.T. Christian Tegner NGU/DLC<br />
D.W.P. David W. Peate DLC<br />
H.B. Haukur Brynjólfsson University of Iceland, Iceland<br />
H.H. Henriette Hansen DLC/GEUS<br />
J.D.K. Johan Ditlev Krebs GEUS<br />
J.G. Jens Gregersen GEUS<br />
J.J. Jakob K. Jakobsen KU/DLC<br />
J.S. Joel A. Simpson UCD<br />
L.H. Lara Heister Stanford University, USA<br />
M.B. Morten Bjerager KU<br />
M.G. Michelle Gras UCD<br />
M.K. Mette Kristensen AU<br />
M.L. Michael Larsen GEUS<br />
M.S.R. Morten S. Rishuus AU<br />
O.G. Olafur Gudmundsson DLC<br />
P.B. Palle Bay GEUS<br />
P.K. Peter Kelemen Woods Hole Oceanographic Inst. USA<br />
P.T. Peter Thy UCD<br />
S.B. Stefan Bernstein DLC<br />
S.O. Snorre Olaussen Norsk Hydro, Bergen, Norway<br />
T.F.D.N. Troels F.D. Nielsen GEUS/DLC<br />
T.N. Thor Nedkvitne Norsk Hydro, Oslo, Norway<br />
Palaeogene flood basalts<br />
A dominant field of DLC research is the temporal and<br />
spatial chemical variations of East <strong>Greenland</strong> flood<br />
basalts (Fig. 1). <strong>The</strong>se studies provide the chemical<br />
basis for the modelling of melting regimes, mantle<br />
dynamics and plume involvement in the process of<br />
continental break-up in the North Atlantic c. 60 million<br />
years ago. <strong>The</strong> volcanic activity lasted from 61 Ma to<br />
85
W<br />
Miki<br />
Fjord<br />
opx-bearing lavas<br />
Not to scale<br />
J.A.D. Jensen<br />
Fjord<br />
Nansen<br />
Fjord<br />
E<br />
Orthopyroxene-bearing lavas,<br />
marker horizon<br />
Irminger Formation in the west;<br />
Milne Land Formation in the east; lavas<br />
Hængefjeldet Formation;<br />
volcanoclastics and tephra<br />
Mikis Formation; volcanic shield,<br />
lavas and hyaloclastites<br />
Upper Vandfalsdalen Formation in<br />
west; 'Nansen Fjord Formation' in<br />
east; mainly lavas<br />
Lower Vandfaldsdalen Formation;<br />
lavas, hyaloclastites and volcanoclastics<br />
Kangerdlugssuaq Basin; Cretaceous<br />
to Palaeogene sediments<br />
Fig. 2. Schematic correlation from Miki Fjord over J.A.D. Jensen Fjord to the east shore of Nansen Fjord, based on EG 2000 results<br />
and previous observations.<br />
13 Ma, but was episodic and most intense from c. 56<br />
to 54 Ma (Storey et al. 1996a, b). <strong>The</strong> total volume of<br />
extruded magma places East <strong>Greenland</strong> amongst the<br />
largest onshore volcanic provinces on Earth (e.g. Coffin<br />
& Eldholm 1994; Eldholm & Grue 1994; Mahoney &<br />
Coffin 1997). Due to Oligocene uplift, the Coast Parallel<br />
Flexure of East <strong>Greenland</strong> (Nielsen & Brooks 1981) and<br />
post break-up tilting of the successions, a more than 8<br />
km thick succession of lavas can be studied in great<br />
detail.<br />
Stratigraphic and geochemical studies in the northern<br />
part of the province had identified a number of<br />
basaltic formations (e.g. Larsen et al. 1989). A combination<br />
of photogrammetric and geochemical methods<br />
have made it possible to trace these formations throughout<br />
the entire province, which testifies to the uniformity<br />
of the magmatism along the East <strong>Greenland</strong><br />
continental margin (Brooks & field parties 1996; Pedersen<br />
et al. 1997; Tegner et al. 1998a; Larsen, L.M. et al. 1999).<br />
<strong>The</strong> tight stratigraphic and radiometric age control allows<br />
studies of the lateral geochemical variation within individual<br />
formations, and the inland chemical variation<br />
which supposedly reflects the effects of an increasingly<br />
thick continental lid (Fram & Lesher 1997; Tegner et al.<br />
1998b). <strong>The</strong> EG 2000 field operations – like those of<br />
1995 (Brooks & field parties 1996) – focused on the sampling<br />
and study of strategically located profiles in the<br />
> 8 km thick flood basalt succession along the Blosseville<br />
Kyst; the regional field programme was completed during<br />
the summer of 2000.<br />
<strong>The</strong> Lower Basalts in the Kangerlussuaq<br />
region (C.E.L., L.H., M.G.)<br />
<strong>The</strong> Lower Basalts of the Kangerlussuaq region were<br />
established as a separate part of the volcanic province<br />
by L.R. Wager and coworkers (e.g. Wager 1947).<br />
Complex stratigraphy and a wide geochemical range<br />
(Brooks & Nielsen 1982a) have made it difficult to correlate<br />
the Lower Basalts with the prevalent and more<br />
uniform tholeiitic plateau basalts to the north and east.<br />
Over the years, several correlation schemes have been<br />
proposed (e.g. Nielsen et al. 1981; Larsen et al. 1989),<br />
but without the necessary stratigraphic control. <strong>The</strong><br />
general stratigraphy and structure of the Lower Basalts<br />
have been described by Nielsen et al. (1981), Hansen<br />
& Nielsen (1999) and Ukstins (2000), but the correlation<br />
with the regional plateau basalt formations originally<br />
identified in the Scoresby Sund region (Larsen et al. 1989)<br />
has remained unresolved.<br />
<strong>The</strong> identification of a suite of orthopyroxene-bearing<br />
marker flows in the Milne Land Formation on the<br />
eastern shores of Nansen Fjord (Fig. 1), and correlation<br />
with similar flows on the peninsula between J.A.D.<br />
Jensen Fjord and Nansen Fjord, suggests the possibility<br />
of a lithological correlation to the type area of the<br />
Lower Basalts in the Miki Fjord area. <strong>The</strong> orthopyroxene-bearing<br />
lavas have now also been sampled in the<br />
lower part of the plateau basalts (the Irminger Formation<br />
of Nielsen et al. 1981) overlying the Lower Basalts on<br />
the south shore of inner Miki Fjord and these studies<br />
86
show that the Irminger Formation is identical with the<br />
Milne Land Formation (see also Larsen, L.M. et al. 1999).<br />
<strong>The</strong> eastward correlation of the formations of the<br />
Lower Basalts in the Miki Fjord area (Fig. 1) suggests<br />
that the Lower Vandfaldsdalen Formation and Mikis<br />
Formation are only locally developed volcanics (Fig. 2).<br />
<strong>The</strong>se two formations include the characteristic TiO 2<br />
-<br />
rich picrite lavas of the Lower Basalts (Nielsen et al. 1981;<br />
Brooks & Nielsen 1982a, b; Fram & Lesher 1997; Hansen<br />
& Nielsen 1999). No equivalents to the wide variety of<br />
the Lower Vandfaldsdalen Formation volcanics have<br />
been observed towards the east in the Ryberg Fjord<br />
and J.A.D. Jensen Fjord area (Fig. 1), whereas the Upper<br />
Vandfaldsdalen Formation can be followed eastwards<br />
to the shores of Nansen Fjord. <strong>The</strong> Mikis Formation<br />
seems to represent a volcanic structure, probably a<br />
shield volcano (Ukstins 2000), between the Upper<br />
Vandfaldsdalen Formation and the overlying tuffs and<br />
volcanoclastic sediments of the Hængefjeldet Formation.<br />
<strong>The</strong> variably sorted tephra deposits between the<br />
Milne Land Formation and the informal ‘Nansen Fjord<br />
Formation’ on the east shores of Nansen Fjord (Larsen,<br />
L.M. et al. 1999), like the equivalent deposits in J.A.D.<br />
Jensen Fjord, show no signs of reworking and provide<br />
a correlation across the fjord, and there is no compelling<br />
evidence at this location for a major hiatus<br />
between the eruption of the Lower Basalts and the<br />
overlying plateau basalts as proposed by Larsen, L.M.<br />
et al. (1999). <strong>The</strong> correlation of the tephra deposits indicates<br />
that lavas assigned to the ‘Nansen Fjord Formation’<br />
on the east side of Nansen Fjord (Larsen, L.M. et al. 1999)<br />
are equivalent to lavas of the Vandfaldsdalen Formation<br />
on the west side of Nansen Fjord (Fig. 2), and this suggests<br />
that no new formation needs to be formalised.<br />
Spatial distribution of magma types in the<br />
plateau basalts (C.E.L., C.T., J.S., L.H.)<br />
Tegner et al. (1998b) identified three main geochemical<br />
groups of lavas in the ‘Master Profile’ through the<br />
plateau basalts of the Blosseville Kyst: (1) depleted<br />
MORB type lavas, (2) the common Fe-Ti tholeiites and<br />
(3) high-Ti tholeiites. All of these occur in the Rømer<br />
Fjord Formation of the ‘Master Profile’, but the coexistence<br />
of three types of lava formed under very different<br />
conditions of melt generation is not easily understood<br />
(Tegner et al. 1998b).<br />
At the stratigraphic level of the Rømer Fjord Formation<br />
the ‘Master Profile’ is compiled from inland and coastal<br />
profiles, and the coexistence of all three geochemical<br />
types could be an artefact of the compilation strategy.<br />
Resampling and new profiles in the Savary Fjord area<br />
(Fig. 1) in summer 2000 suggest that coexistence of the<br />
three magma types reflects a lateral variability with<br />
MORB types and Fe-Ti basalts in coastal profiles, and<br />
Fe-Ti basalts and high-Ti basalts in inland profiles. This<br />
would be in better conformity with models of rifting<br />
and thinning of the continental crust along the coast of<br />
East <strong>Greenland</strong>.<br />
<strong>The</strong> Prinsen af Wales Bjerge and<br />
Tjældebjerget (H.H., A.K.)<br />
<strong>The</strong> Prinsen af Wales Bjerge (Fig. 1) consist of a series<br />
of inland nunataks, where only few investigations have<br />
hitherto been made. <strong>The</strong> stratigraphical relationship<br />
between the Prinsen af Wales Bjerge volcanics and the<br />
main exposures of East <strong>Greenland</strong> flood basalts is poorly<br />
known. <strong>The</strong> present account, based on summer 2000<br />
field work, represents the first detailed description of the<br />
volcanic successions in the northern part of the area.<br />
Tholeiitic compositions dominate the entire East<br />
<strong>Greenland</strong> province (e.g. Brooks & Nielsen 1982a, b;<br />
Larsen et al. 1989), but in the Prinsen af Wales Bjerge<br />
(Fig. 1) tholeiitic volcanism was succeeded by eruption<br />
of alkaline lavas (Wager 1947; Anwar 1955; Hogg et al.<br />
1988, 1989; Brooks & field parties 1996; Brown et al.<br />
1996). <strong>The</strong> main purpose of the summer 2000 field<br />
work in the Prinsen af Wales Bjerge area was to determine<br />
stratigraphical relationships in the nunatak suite,<br />
and to stratigraphically connect the area with the areas<br />
investigated during the 1995 DLC field campaign (Brooks<br />
& field parties 1996).<br />
<strong>The</strong> oldest volcanics of the Prinsen af Wales Bjerge<br />
(Fig. 3) are located furthest south at Urbjerget (Wager<br />
1947). <strong>The</strong>y are tholeiitic and are intercalated with epiclastic<br />
and volcanogenic sediments overlying the<br />
Archaean tonalitic gneiss basement. <strong>The</strong> lowermost c.<br />
61 Ma old flows and sediments are part of the new, not<br />
yet formalised ‘Urbjerget Formation’, whereas the overlying<br />
57 to 55 Ma tholeiitic flows are part of the regionally<br />
widespread Milne Land Formation. <strong>The</strong> flows of the<br />
‘Urbjerget Formation’ and Milne Land Formation dip at<br />
1–2° NNW. <strong>The</strong> southernmost exposures of alkaline<br />
lava flows at ‘1982 Nunatak’ have highly variable dips,<br />
probably reflecting proximity to palaeo-eruption sites,<br />
but further north the alkaline lavas regain regional dips<br />
of 1–2° NNW. This suggests that progressively younger<br />
lavas are exposed northwards in the Prinsen af Wales<br />
Bjerge. An alkaline extrusive in a volcanic cone structure<br />
enclosed in the succession has been dated to 52.5<br />
± 0.3 Ma (Peate et al. 2000), but the age span of the<br />
87
'Lindsay Nunatak'<br />
'N. Polar Bear<br />
Nunatak'<br />
Photogrammetric profiles<br />
Section<br />
100 m<br />
'N. Polar Bear<br />
Nunatak'<br />
'Lindsay<br />
Nunatak'<br />
LGS<br />
'Midway Nunatak'<br />
0 m<br />
DGS<br />
ISS<br />
'Midway<br />
Nunatak'<br />
PWBF<br />
PWBF<br />
69°N<br />
Inland<br />
Ice<br />
'1982 Nunatak'<br />
Tjældebjerget<br />
PWBF<br />
?<br />
(a)<br />
N<br />
Urbjerget<br />
(a)<br />
PB ?<br />
?<br />
RFF ?<br />
5 km<br />
GPF ?<br />
33°W<br />
Fig. 3. Prinsen af Wales Bjerge with place names used in text,<br />
photogrammetric lines and profile/sampling sections. For regional<br />
location of Prinsen af Wales Bjerge, see Fig. 1.<br />
alkaline volcanism has not yet been established in detail.<br />
Photogrammetry was used for identification of four<br />
locations, Tjældebjerget, ‘Lindsay Nunatak’, ‘N. Polar<br />
Bear Nunatak’ and ‘Midway Nunatak’, where studies of<br />
sections through the volcanic succession would provide<br />
critical new stratigraphical information and samples<br />
suited for geochemical investigations (Figs 3, 4). In<br />
addition, Urbjerget was briefly visited to examine the<br />
border zone between the ‘Urbjerget Formation’ and<br />
Milne Land Formation.<br />
MLF ?<br />
Sediment<br />
LGS: Light grey suite of 'Lindsay Nunatak'<br />
DGS: Dark grey suite of 'Lindsay Nunatak'<br />
ISS: Inter-sediment suite of 'Lindsay Nunatak'<br />
PWBF: 'Prinsen af Wales Bjerge Formation'<br />
(a) - part of PWBF<br />
PB: Plateau basalt<br />
(i.e., MLF, GPF, RFF or Skrænterne Formation)<br />
RFF: Rømer Fjord Formation<br />
GPF: Geikie Plateau Formation<br />
MLF: Milne Land Formation<br />
Fig. 4. Correlation of profiles measured in Prinsen af Wales Bjerge,<br />
and comparisons with Tjældebjerget profile. <strong>The</strong> correlation is<br />
mainly based on photogrammetry and field observations, with<br />
support from geochemical whole-rock analyses and 40 Ar/ 39 Ar<br />
ages of some ‘Lindsay Nunatak’ flows.<br />
Tjældebjerget. This nunatak is in a key position between<br />
the stratigraphically well-known flood basalt successions<br />
of the north-eastern Blosseville Kyst and the<br />
Prinsen af Wales Bjerge (Fig. 1). <strong>The</strong> lowermost c. 100<br />
m of the profile (Fig. 5) consists of less than 5 m thick<br />
aphyric and olivine-phyric pahoehoe flows and thicker<br />
(up to 19 m), massive, highly plagioclase-phyric flows<br />
(probably suitable for 40 Ar- 39 Ar dating). <strong>The</strong> overlying<br />
110 m of the sequence is dominated by up to 10 m thick<br />
aphyric and sparsely olivine-plagioclase-pyroxene-phyric<br />
flows. Red tuffaceous beds up to 50 cm thick occur commonly.<br />
<strong>The</strong> uppermost 180 m is formed by a succession<br />
of aphyric to sparsely phyric, 10 to 30 m thick<br />
flows with massive, columnar-jointed lower parts and<br />
rubbly flow tops. Red volcanoclastic sediments with<br />
thicknesses of 10 to 20 cm are found on top of all thick<br />
and massive flows. <strong>The</strong> top of the nunatak consists of<br />
c. 15 m of olivine-phyric, vesicular, 0.5 to 1.0 m thick<br />
pahoehoe type flows. Based on the petrographic characteristics<br />
and photogrammetric observations, the lowermost<br />
part of the succession may correlate with the<br />
regionally distributed Milne Land Formation, and the<br />
upper 180 m with the Geikie Plateau Formation (Fig.<br />
88
Fig. 5. Tjældebjerget profile locality<br />
looking west. <strong>The</strong> height of the profile is<br />
c. 300 m, with top of the profile at 2650<br />
m altitude. <strong>The</strong> suggested Milne Land<br />
Formation – Geikie Plateau Formation<br />
contact is shown by the black line.<br />
GPF ?<br />
MLF ?<br />
4). However, these suggested correlations await confirmation<br />
by geochemistry and age determinations.<br />
‘Lindsay Nunatak’. <strong>The</strong> most north-westerly exposures<br />
in the Prinsen af Wales Bjerge are found on ‘Lindsay<br />
Nunatak’ and a smaller exposure north of ‘Lindsay<br />
Nunatak’ proper (Fig. 3). <strong>The</strong>se exposures are believed<br />
to show the youngest volcanics of the region. ‘Lindsay<br />
Nunatak’ was briefly visited in 1995, and found to comprise<br />
alkaline flows of the ‘Prinsen af Wales Bjerge<br />
Formation’ overlain by conglomerates and sediments,<br />
and followed in turn by olivine-rich tholeiitic lavas.<br />
Further detailed stratigraphical and geochemical sampling<br />
was carried out in summer 2000.<br />
A > 5 m thick, sparsely pyroxene-phyric alkaline<br />
basalt flow (Table 2) forms the base of ‘Lindsay Nunatak’.<br />
Gravel slopes above the flow expose abundant fragments<br />
of silicified wood, and tuffaceous rock fragments containing<br />
silicified wood. <strong>The</strong> lowest outcrop above the<br />
lowermost flow is a polymict, matrix-supported conglomerate<br />
with well-rounded, but poorly sorted clasts<br />
ranging in size from c. 1 to 30 cm. <strong>The</strong> clasts are mainly<br />
porphyritic extrusives, together with a wide variety of<br />
intrusive rock types including highly alkaline eudialyte-bearing<br />
syenite and alkaline pyroxenites reminiscent<br />
of the lithologies at the Gardiner complex (see<br />
also Brooks & field parties 1996). <strong>The</strong> conglomerate con-<br />
Table 2. Selected major element analyses of lava flows from<br />
‘Lindsay Nunatak’, Prinsen af Wales Bjerge<br />
Sample* 458931 458932 458933 458941 458948<br />
Suite** PWBF ISS ISS DGS LGS<br />
mela- mela- olivine<br />
nephelinite nephelinite basanite tholeiite tholeiite<br />
SiO 2 37.45 42.35 46.03 47.97 49.76<br />
TiO 2 7.82 4.28 3.31 2.88 1.61<br />
Al 2 O 3 7.40 6.34 8.53 10.55 11.34<br />
Fe 2 O 3 11.02 5.70 4.43 6.92 3.13<br />
FeO 5.57 9.48 9.67 6.44 8.02<br />
MnO 0.26 0.20 0.20 0.19 0.17<br />
MgO 6.67 15.91 13.18 8.78 12.73<br />
CaO 15.53 10.17 10.08 10.06 9.54<br />
Na 2 O 2.53 1.59 1.99 2.50 2.05<br />
K 2 O 1.35 1.02 0.68 0.77 0.55<br />
P 2 O 5 1.17 0.44 0.36 0.34 0.16<br />
Vol. 2.55 1.67 1.07 2.05 0.88<br />
Sum 99.32 99.15 99.52 99.44 99.95<br />
* GGU sample number.<br />
** See Fig. 4 for identification of suite.<br />
XRF analyses on glass discs by GEUS.<br />
89
tains 30 x 200 cm cross-bedded sandy lenses, elongated<br />
parallel to the base of the conglomerate, and is probably<br />
a river deposit. Two 10 to 20 m thick olivine and<br />
olivine-pyroxene-phyric columnar-jointed flows with<br />
massive flow bases and rubbly flow tops (ISS in Fig. 4)<br />
separate the lower sediments from a second polymict<br />
conglomerate. <strong>The</strong> latter contains 10 to 30 cm rounded<br />
clasts at its base overlain by a yellow volcaniclastic,<br />
redeposited (?), sediment with black and red scoria,<br />
light grey coloured pumice, and fresh euhedral crystals<br />
of feldspar and pyroxene up to 15 mm across. <strong>The</strong><br />
upper polymict conglomerate is overlain by a 50 m<br />
thick succession of dark grey olivine-phyric pahoehoe<br />
flows (DGS in Fig. 4) with an average unit thickness of<br />
about 50 cm, followed by c. 65 m of light grey, olivinephyric<br />
pahoehoe flows (LGS in Fig. 4) that extend to<br />
the top of the nunatak.<br />
‘N. Polar Bear Nunatak’. This nunatak is located east<br />
of ‘Lindsay Nunatak’ in the northernmost part of the<br />
Prinsen af Wales Bjerge (Fig. 3). Photogrammetric studies<br />
and the geochemistry of lavas in a parallel section<br />
to the south (Peate et al. 2000) suggest that the exposed<br />
flows belong to the not yet formalised ‘Prinsen af Wales<br />
Bjerge Formation’. <strong>The</strong> nunatak was targeted for sampling<br />
because pre-field work photogrammetry identified<br />
a distinct succession of thin (< 20 m) flows bounded<br />
by tuffaceous or soil horizons (‘a’ in Fig. 4). Succession<br />
‘a’ may be used for the subdivision of the ‘Prinsen af<br />
Wales Bjerge Formation’ and could prove useful for<br />
constraining the timing of volcanism.<br />
Below succession ‘a’ is exposed a c. 50 m thick<br />
aphyric basalt, which may belong to the Rømer Fjord<br />
Formation (Fig. 4; D.W. Peate, personal communication<br />
2000); a 20 cm thick red volcanoclastic sediment above<br />
the aphyric basalts forms the lower boundary of ‘a’.<br />
<strong>The</strong> lower part of succession ‘a’ consists of sparsely<br />
olivine-clinopyroxene-phyric 0.5–6 m thick flows, some<br />
of which are highly vesicular, red-weathering pahoehoe<br />
types. <strong>The</strong>se very thin flows are replaced by thicker,<br />
10–20 m, compound flows with massive bases and associated<br />
vesicle-filled pipes up to 10 cm in diameter and<br />
from c. 20–100 cm in vertical length. In the upper c. 30<br />
m of succession ‘a’, flows are again thinner (2–4 m).<br />
Succession ‘a’ is overlain by dark coloured, brecciated<br />
volcanics intermixed with red volcanoclastic sediments,<br />
which may have formed near eruption centre(s) or as<br />
a result of hydraulic fragmentation of hot flows. <strong>The</strong><br />
brecciated unit is followed by a c. 80 m thick succession<br />
of c. 5 m thick, compound olivine-clinopyroxenephyric<br />
flows. A red tuff marks the base of a succession<br />
of thick massive flows that continues for a further 80<br />
m to the top of the nunatak.<br />
‘Midway Nunatak’. <strong>South</strong> of ‘N. Polar Bear Nunatak’, a<br />
nunatak designated ‘Midway Nunatak’ was selected for<br />
sampling in order to determine the regional extent of<br />
succession ‘a’. Here, the lower part of the succession<br />
consists of three massive 20–30 m thick flows that most<br />
likely belong to one of the regional plateau basalt formations,<br />
i.e. Milne Land, Geikie Plateau, Rømer Fjord<br />
or Skrænterne formations. <strong>The</strong>se flows are interlayered<br />
with < 0.5 m thick red volcanoclastic sediments. <strong>The</strong><br />
two lowermost flows are aphyric, whereas the third is<br />
olivine-pyroxene-phyric. Most of the remaining flows<br />
in the profile are relatively thin (less than 10 m), highly<br />
olivine-phyric, pyroxene-phyric or olivine-pyroxenephyric<br />
flows, forming part of the ‘Prinsen af Wales<br />
Bjerge Formation’. One exception is a rather thick (c.<br />
30 m) massive flow at the top of the profile. Field observations<br />
cannot clearly identify the presence of succession<br />
‘a’ at ‘Midway Nunatak’ which is tentatively indicated<br />
in Fig. 4. Chemical analyses are needed for a more thorough<br />
evaluation of the section.<br />
Urbjerget. At Urbjerget (Fig. 3) a mudstone containing<br />
sparse, 3–7 cm rounded clasts was observed between<br />
the flow successions dated at 61 Ma and 57–55 Ma,<br />
respectively. <strong>The</strong> presence of these sediments supports<br />
the existence of a hiatus in the earliest stages of<br />
Palaeogene volcanism in this inland region, as has been<br />
suggested by Storey et al. (1996a) amongst others.<br />
New Skaergaard intrusion initiatives<br />
<strong>The</strong> 55 Ma old Skaergaard intrusion is associated with<br />
and emplaced into the base of the Palaeogene flood<br />
basalt succession of the East <strong>Greenland</strong> volcanic rifted<br />
margin. In this classic intrusion layered cumulates provide<br />
a complete record of extreme igneous fractionation<br />
of basaltic magma (Wager & Deer 1939). <strong>The</strong><br />
excellent exposures (Fig. 6) and petrographic studies<br />
over the past 70 years have provided key observations<br />
for universal models of igneous differentiation (Wager<br />
& Brown 1968; McBirney 1996; Irvine et al. 1998).<br />
However, despite or perhaps because of the extensive<br />
studies and the wealth of information available, many<br />
features of the gabbros continue to be debated, and the<br />
Skaergaard intrusion remains a primary natural laboratory<br />
for crystallisation and fractionation models for<br />
basaltic magma.<br />
90
Fig. 6. <strong>The</strong> spectacular magmatic layering in the UZa (Upper Zone a) Skaergaard intrusion gabbros in the Hjemsted Bugt area<br />
(located in Skaergaard intrusion on Fig. 1).<br />
<strong>The</strong> recognition of the Skaergaard intrusion as a<br />
world-class palladium deposit (Bird et al. 1991; Andersen<br />
et al. 1998; Nielsen 2001) adds to the interest for a better<br />
understanding of its origin and development. From<br />
1989 to 1990 drillcores > 1000 m long were recovered<br />
from the upper part of the Layered Series of the intrusion.<br />
<strong>The</strong>y provide unprecedented opportunities for<br />
analysis and quantitative modelling. <strong>The</strong> cores are now<br />
available for research projects (see below), and this has<br />
led to new research initiatives in a collaborative effort<br />
between DLC, GEUS, the University of Copenhagen<br />
(KU), the University of California Davis (UCD), Aarhus<br />
University (AU, Denmark), the Geological Survey of<br />
Norway (NGU) and in continued collaboration with the<br />
Geophysical Laboratory, Carnegie Institution of<br />
Washington (USA) and the University of Oregon (USA).<br />
Retrieval of Skaergaard intrusion drill<br />
cores (T.F.D.N., C.E.L., J.S., J.G.)<br />
A total of 15 km of core from 27 drill sites (c. 80 tons)<br />
was recovered by Platinova A/S in 1989 and 1990. Apart<br />
from selected intersects transported to Canada for further<br />
investigation, the cores were stored in the open at<br />
the landing strip in Sødalen, 10 km east of the intrusion.<br />
Recognising the scientific value of the Skaergaard<br />
drillcores, SNF supported the crating and transport of<br />
4.5 km of selected drillcore to Copenhagen, with the<br />
permission of Platinova A/S.<br />
<strong>The</strong> Platinova A/S exploration license had expired<br />
by the end of 1999 and the cores were transferred to<br />
ownership of <strong>Greenland</strong>, represented by the BMP who<br />
supported and confirmed the agreement to save a representative<br />
proportion of the cores. Out of the total, five<br />
long cores for research purposes (c. 16 tons) and mineralisation<br />
intersects from all drill sites (c. 4 tons) were<br />
selected for storage at the Geological Museum,<br />
Copenhagen and the core library of the BMP. Cores<br />
were airlifted to Iceland for shipment to Denmark.<br />
<strong>The</strong> research cores cover most of the Upper Zone<br />
of the intrusion (see Wager & Brown 1968) and extend<br />
into the upper part of the Middle Zone. <strong>The</strong> core material,<br />
new detailed EG 2000 sample profiles from all the<br />
stratigraphy of the Layered Series not covered by the<br />
cores (Fig. 7), and core material and grab sample profiles<br />
returned from Platinova A/S storage in Canada,<br />
91
Approximate stratigraphic height (metres)<br />
2500<br />
2000<br />
1500<br />
1000<br />
500<br />
0<br />
UBSγ<br />
UZc<br />
UZb<br />
UZa<br />
MZ<br />
LZc<br />
LZb<br />
LZa<br />
Sample profiles<br />
Uttental Plateau<br />
Kraemer Ø<br />
Forbindelsesgletscher<br />
drillcore 90-22<br />
Basistoppen<br />
Melanogranophyre<br />
Rock density<br />
(g/cm 3 )<br />
2.6 2.8 3.0 3.2 3.4 3.6<br />
Fig. 7. Left: Stratigraphic coverage of the<br />
cumulus succession in the Skaergaard<br />
intrusion from LZa (Lower Zone a),<br />
through MZ (Middle Zone) and UZ<br />
(Upper Zone) to UBGγ (Upper Border<br />
Group gamma); see Wager & Brown<br />
(1968) for details of stratigraphy. Surface<br />
profiles: Uttental Plateau, Kraemer Ø,<br />
Forbindelsesgletscher and Basistoppen<br />
(all located within Skaergaard intrusion<br />
on Fig. 1). Drillcore DDH 90-22 is<br />
collared at point 312 on the north shore<br />
of Basisgletscher and covers the interval<br />
from upper MZ to middle UZc. <strong>The</strong><br />
Skaergaard <strong>gold</strong>-palladium mineralisation<br />
is stratabound, located in the upper part<br />
of MZ and covered by the lower parts of<br />
DDH 90-22. Right: density profile<br />
through the stratigraphy. Modified from<br />
Nielsen et al. (2000).<br />
provide an unparalleled collection from the central part<br />
of the intrusion and form the basis for new Skaergaard<br />
research initiatives. <strong>The</strong>se include structural modelling<br />
for mass balances for major elements and precious metals<br />
(Nielsen 2001), geophysical modelling based on<br />
gravimetry (see below), constraints on the line of liquid<br />
descent from melt inclusions, trace element studies<br />
on liquidus phases and a detailed record of modal,<br />
chemical and isotopic variations through the entire gabbro<br />
body (e.g. Tegner 1997; Nielsen et al. 2000) for<br />
refinement of numerical fractionation models.<br />
Reconnaissance gravimetric survey of the<br />
Skaergaard intrusion (C.K.B., M.K.)<br />
Pioneering gravimetric work on the Skaergaard intrusion<br />
carried out in the early 1970s was only published<br />
in abstract form (Blank & Gettings 1972, 1973). While<br />
knowledge of the regional field and the topographic<br />
effects was not available, these data have nevertheless<br />
formed the basis for numerous interpretations of the<br />
shape, depth and volume of the intrusion (e.g. McBirney<br />
1975). <strong>The</strong> aim of the programme in summer 2000 was<br />
to determine whether new reconnaissance gravimetric<br />
data, corrected by software now available, would result<br />
in better constrained models for the shape and size of the<br />
intrusion and, in particular, better estimates of the dimensions<br />
of the hidden parts of the intrusion. <strong>The</strong> latter is a<br />
necessity for numerically constrained modelling of the<br />
development of the intrusion (see e.g. Wager & Brown<br />
1968; McBirney 1975; Norton et al. 1984; Irvine 1992).<br />
In 1986 Kort & Matrikelstyrelsen (KMS, the National<br />
Survey and Cadastre, Denmark) established a regional<br />
gravity survey of <strong>Greenland</strong> based on stations spaced<br />
approximately 25 km apart. In addition, KMS provided<br />
a digital map allowing for topographic corrections of<br />
the new gravimetric survey. Much of the new data was<br />
collected at sea level along the fjords, crossing the contacts<br />
of the intrusion by boat, using a LaCoste Romberg<br />
gravimeter (KU). A few stations were obtained with<br />
helicopter assistance in the high mountains over the central<br />
part of the intrusion.<br />
92
35<br />
Fig. 8. Bouguer anomaly map over the<br />
Skaergaard intrusion and surroundings<br />
based on EG 2000 and KMS data. <strong>The</strong><br />
intrusion is outlined in heavy black<br />
line, coast and glaciers in thin black<br />
lines. <strong>The</strong> effect from the regional field<br />
causes the negative gradient of the<br />
contour lines and the eastward displacement<br />
of the anomaly. Modified from<br />
Nielsen et al. (2000). For regional<br />
location, see Fig. 1.<br />
68°20<br />
Kangerlussuaq<br />
Skaergaard<br />
intrusion<br />
-55<br />
-45<br />
-35<br />
-15<br />
-5<br />
5<br />
15<br />
25<br />
-25<br />
35<br />
-50<br />
-60<br />
-40<br />
-65<br />
-30<br />
30<br />
-20<br />
-70<br />
-10<br />
0<br />
-75<br />
-30<br />
10<br />
-40<br />
-20<br />
30<br />
-10<br />
50<br />
0<br />
30<br />
-75<br />
-45<br />
10<br />
45<br />
-55<br />
-35<br />
25<br />
-15<br />
35 40<br />
5<br />
-70<br />
-5<br />
-25<br />
-70<br />
20 15 20<br />
-65<br />
-35<br />
25<br />
-60<br />
-25<br />
-15<br />
5<br />
15<br />
30<br />
-50<br />
?5<br />
-45<br />
20<br />
-50<br />
-10<br />
-40<br />
-30<br />
-20<br />
-20<br />
0<br />
10<br />
35<br />
15<br />
40<br />
30<br />
45<br />
35<br />
40<br />
50<br />
55<br />
30 20<br />
20<br />
50<br />
68°00<br />
32°00<br />
Denmark Strait<br />
31°00<br />
25 km<br />
-75 0 50 mgal<br />
<strong>The</strong> collected data were processed with help and<br />
software from KMS, and the Bouguer anomaly data are<br />
shown in Fig. 8. <strong>The</strong> preliminary results and models (not<br />
shown) identify a large anomaly over the Skaergaard<br />
intrusion and indicate that the intrusion continues to a<br />
depth of at least 3 km below sea level at its southern<br />
margin. This essentially agrees with models presented<br />
by Norton et al. (1984) and structural reconstructions<br />
(Nielsen et al. 2000; Nielsen 2001). <strong>The</strong> presence of two<br />
roots or feeders suggested by Norton et al. (1984) was<br />
not confirmed by the new data.<br />
Late felsic magmatism and nodulebearing<br />
lamprophyres<br />
<strong>The</strong> Palaeogene magmatism along the coast of East<br />
<strong>Greenland</strong> is characterised not only by the voluminous<br />
flood basalts and contemporaneous gabbroic intrusions<br />
(e.g. the Skaergaard intrusion), but also by a large number<br />
of felsic and alkaline intrusions, intrusive complexes<br />
and alkaline dyke swarms (Fig. 1) emplaced over an<br />
extended period that lasted up to at least 20 Ma after<br />
the main period of flood basalt extrusion (Nielsen 1987).<br />
Mineralisations are associated with many of these<br />
intrusions, including hydrothermal precious metals (Au,<br />
Ag), base metals (Pb, Zn) and molybdenum mineralisations.<br />
<strong>The</strong> Werner Bjerge complex (71°50′N; Fig. 1)<br />
contains a world class Mo deposit in a felsic pluton of<br />
the rifted East <strong>Greenland</strong> margin (Schønwandt 1988).<br />
Investigation of mineralisations at Amdrup Fjord (see<br />
Thomassen & Krebs 2001, this volume) and field work in<br />
the Kangerdlugssuaq intrusion in 2000 (see below) represent<br />
a coordinated effort aimed at the development<br />
of petrogenetic and mineralisation models for exploration<br />
strategies and a comprehensive description of the resource<br />
potential of the East <strong>Greenland</strong> rifted volcanic margin.<br />
Kangerdlugssuaq alkaline intrusion: new<br />
comprehensive collections (C.K.B., D.W.P.,<br />
M.S.R.)<br />
Intrusive alkaline rocks outcrop over a large area in<br />
the Kangerlussuaq region (Brooks & Nielsen 1982b), but<br />
by far the largest contiguous body is the Kangerdlugssuaq<br />
alkaline intrusion (Kempe & Deer 1970; Kempe<br />
et al. 1970) and its satellites (Fig. 1). This intrusion is<br />
approximately circular with a diameter of about 33 km<br />
and covers an area of > 800 km 2 , making it one of the<br />
world’s largest syenitic bodies. Like many complexes<br />
of this type it contains both quartz-rich and feldspathoidrich<br />
rocks, whose origin and mutual relationships are<br />
still under debate.<br />
Apart from the work reported by Kempe & Deer<br />
(1970) and Kempe et al. (1970), very little detailed work<br />
has been undertaken on the Kangerdlugssuaq alkaline<br />
intrusion, largely due to its general inaccessibility. Wager<br />
(1965) discussed the general shape of the intrusion,<br />
93
Fig. 9. <strong>South</strong>ern part of the<br />
Kangerdlugssuaq alkaline intrusion at the<br />
head of Amdrup Fjord. Telephoto view<br />
from helicopter, looking north-northwest.<br />
<strong>The</strong> summits reach > 1000 m.<br />
Pankhurst et al. (1976) reported Sr- and O-isotopes,<br />
and Brooks & Gill (1982) presented analyses of the ferromagnesian<br />
minerals, together with a model for the<br />
intrusion’s development.<br />
<strong>The</strong> intrusion is largely covered by glaciers and outcrops<br />
consist of very steep-sided nunataks with frostshattered,<br />
weathered material on the summits (Fig. 9).<br />
Fortunately, mass wastage along the glaciers provides<br />
ample amounts of fresh material, and altogether 120 samples<br />
from 42 separate localities were collected by helicopter<br />
from all parts of the intrusion.<br />
Special attention was focused on the Astrophyllite Bay<br />
complex (Brooks & Nielsen 1982b; Nielsen & Brooks<br />
1991), which is a mixed complex consisting of basic pillows<br />
in a syenitic matrix at the south-east margin of the<br />
intrusion. Nielsen & Brooks (1991) ascribed the origin<br />
of the syenites to in situ melting of the Precambrian host<br />
gneisses and chemical re-equilibration by diffusive<br />
processes. This hypothesis will now be tested in a Ph.D.<br />
project (Riishuus et al. 2001), using samples from precisely<br />
oriented slabs cut with a motor-driven diamond<br />
saw from the ice-polished roches moutonnées where<br />
the relationships between basic pillows, syenitic melt<br />
and basement gneiss are beautifully exposed (Fig. 10).<br />
<strong>The</strong> Borgtinderne area (P.K., S.B.)<br />
<strong>The</strong> Borgtinderne area along Kronborg Gletscher (Fig.<br />
1) is an alpine glaciated terrain of extremely difficult<br />
access, and the area has only been briefly visited during<br />
reconnaissance expeditions. Kronborg Gletscher<br />
follows a N–S-trending lineament associated with abundant<br />
faulting and dyking, which separates two main<br />
structural blocks of flood basalts (Pedersen et al. 1997).<br />
Initial dating from the lineament shows post-plateau<br />
basalt igneous activity over c. 10 Ma between 50 and<br />
40 Ma ago (C. Tegner, personal communication 2000).<br />
<strong>The</strong> Borgtinderne syenite intrusion proved to be<br />
much more complex than described by Brown et al.<br />
(1978), with leucocratic syenite intruding an older, more<br />
mafic pluton of gabbro, diorite and pyroxenite. As<br />
observed in many other felsic intrusive complexes in<br />
East <strong>Greenland</strong> (Nielsen 1987), there is ample evidence<br />
for coexisting mafic and felsic magmas in pillowed<br />
dykes; these cut most lithologies in the Borgtinderne<br />
intrusion. A suite of plutonic rocks from the intrusion<br />
and samples of dykes cutting the syenites were collected<br />
for detailed studies and analyses.<br />
A series of N–S-trending vertical lamprophyre dykes<br />
represent the youngest magmatic phase, and one of<br />
these dykes was found to carry small, but fresh, mantle<br />
xenoliths. <strong>The</strong>se xenoliths appear to be finer grained<br />
than mantle xenoliths from basanitic dykes at<br />
Wiedemann Fjord, some 35 km further to the south<br />
(e.g. Bernstein et al. 1998).<br />
A new ultramafic intrusion was located on the lower<br />
north-east slope of Ejnar Mikkelsen Fjeld. Seen from<br />
Borgtinderne the intrusion appears as an orange to yellow-brown<br />
weathering area of steep ridges. During two<br />
short helicopter visits the intrusion proved to be composed<br />
of dunite, with a few veins of pyroxenite and<br />
chromitite, which above 1900 m a.s.l. give way to pyroxenite.<br />
Whereas the plateau basalt host rocks are cut by<br />
a large number of mainly N–S-trending dykes, only two<br />
94
dykes were found to cut the ultramafic intrusives. <strong>The</strong><br />
‘Ejnar Mikkelsen intrusion’ – named after the massif in<br />
which it is found – shows similarities with the Lilloise<br />
intrusion (Brown 1973) situated 40 km to the south<br />
(Fig. 1).<br />
<strong>The</strong> Borgtinderne syenites, the swarm of N–S-trending<br />
lamprophyre and basanite dykes, the nephelinite<br />
diatremes (Brooks & field parties 1996), the ultramafic<br />
‘Ejnar Mikkelsen intrusion’ and the Lilloise intrusion all<br />
testify to the importance of the Kronborg Gletscher lineament<br />
as a major crustal structure that localised magmatism<br />
during a protracted period of c. 10 Ma after<br />
continental break-up along the coast of East <strong>Greenland</strong>.<br />
<strong>The</strong> NEAT seismic project (O.G., H.B.)<br />
<strong>The</strong> aim of the NEAT (North-East Atlantic Tomography)<br />
project is to use seismic surface waves crossing the<br />
North Atlantic Ocean to map the structure of the upper<br />
mantle beneath the region around the proposed Iceland<br />
hot spot. NEAT is a collaborative project between DLC<br />
and the University of Cambridge, UK. <strong>The</strong> project<br />
requires observations from a large number of permanent<br />
seismic observatories on both sides of the ocean<br />
as well as a number of temporarily deployed seismographs<br />
in the region. <strong>The</strong> latter were deployed at remote<br />
sites in East <strong>Greenland</strong> during EG 2000.<br />
Temporary seismographs were deployed at Hjørnedal<br />
(70°21.1′N, 28°09.85′W), in Sødalen (68°12.20′N,<br />
31°22.62′W), and in Kassortoq fjord (63°14.91′N,<br />
42°02.09′W); all three sites are located at STOL air strips.<br />
Other temporary stations have been established at<br />
Danmarkshavn, Scoresbysund and Narsarsuaq (Fig. 1).<br />
<strong>The</strong>se temporary stations supplement the three permanent<br />
observatories in <strong>Greenland</strong> operated by KMS.<br />
Each of the remotely deployed stations consists of a<br />
Guralp 3T broadband seismograph, a RefTek acquisition<br />
system (16 bit, 4 Gbyte storage capacity), a large<br />
panel of solar cells (180 W), lead-acid batteries of 700<br />
Ah capacity, and a windmill generator. All the equipment,<br />
apart from the solar cells and windmill generator,<br />
was placed in well-insulated boxes (20 cm thick<br />
insulation) and buried beneath a layer of sand bags. <strong>The</strong><br />
sites will be visited annually for the next few years for<br />
data retrieval and maintenance.<br />
Perspectives<br />
<strong>The</strong> Palaeogene magmatic province in East <strong>Greenland</strong><br />
represents the most voluminous and best exposed part<br />
Fig. 10. Basic pillows in syenite from the Astrophyllite Bay complex<br />
(located on north shore of Amdrup Fjord, Fig. 1). Slabs have<br />
been cut from crystalline basement (at bottom in foreground) and<br />
into the basaltic melt pillows at locations nearby for study of diffusion<br />
between felsic and basic melts. Hammer for scale. Colour<br />
version of figure from Brooks & Nielsen (1982b) and Nielsen<br />
(1987).<br />
of the onshore North Atlantic province. Since the earliest<br />
regional investigations in the 1930s (e.g. Wager<br />
1934) the region has attracted international research<br />
activities. <strong>The</strong> participation of members of the international<br />
geological community in EG 2000 confirms the<br />
continued interest as well as the educational potential<br />
of the Kangerlussuaq region (Table 1).<br />
<strong>The</strong> logistic platform established by the grant from<br />
SNF for the retrieval of drillcores from the Skaergaard<br />
intrusion was used during EG 2000 to carry out many<br />
and varied projects. <strong>The</strong> Sødalen base and air strip, the<br />
huts and the presence of fuel and depots, will facilitate<br />
continued field operations in the future and ensure<br />
access to the Kangerlussuaq region for both research<br />
and company interests.<br />
95
With the completion of the DLC regional sampling<br />
programme in the flood basalts, the foundation has<br />
been laid for comprehensive modelling of the magmatism,<br />
plume involvement and the effects of crustal<br />
attenuation. <strong>The</strong> comprehensive sampling of the<br />
Skaergaard intrusion, the retrieval of drillcores for<br />
research purposes and gravimetric studies, provide<br />
opportunities for revival of studies of the structure and<br />
emplacement history of the Skaergaard intrusion and<br />
fundamental features of solidification and fractionation<br />
of basaltic magma in crustal magma chambers. <strong>The</strong><br />
increasing focus on late mafic to felsic intrusions, and<br />
the finds of mantle nodules brought to the surface by<br />
the late magmatism, provide insights into, and open up<br />
opportunities for, studies of the complex interaction<br />
between mantle-derived magmas and the continental<br />
crust and the history of the underlying mantle during<br />
the plume-related continental break-up.<br />
Acknowledgements<br />
Field work during EG 2000 was carried out under the auspices<br />
of the Danish Lithosphere Centre funded by the Danish National<br />
Research Foundation. <strong>The</strong> help of W. Stuart Watt, Lotte Melchior<br />
Larsen, Asger K. Pedersen and Peter Riisager in the planning of<br />
field activities in the flood basalts, and discussions on stratigraphy<br />
and palaeomagnetic sampling, is greatly appreciated. A map<br />
of the Prinsen af Wales Bjerge was kindly provided by Asger K.<br />
Pedersen. <strong>The</strong> transfer of Platinova A/S drill cores to the Geological<br />
Survey of Denmark and <strong>Greenland</strong> was funded by the Danish<br />
Natural Science Research Council (grant 9901778 to T.F.D.N.)<br />
and made possible by agreement with Platinova A/S and the<br />
BMP. René Forsberg (KMS) is thanked for his expert advice and<br />
enthusiasm for the gravimetry project, Thorkild M. Rasmussen for<br />
advice on the gravimetry modelling and C.C. Tscherning, University<br />
of Copenhagen, for loan of a gravimeter. <strong>The</strong> <strong>Greenland</strong>air crew<br />
of Mikael Hällstrøm and Pelle Vestlund are thanked for excellent<br />
and professional services. <strong>The</strong> help and professionalism of<br />
AirIceland personnel, and especially Fridrik Adolfsson, ensured<br />
the success of the operations.<br />
References<br />
Andersen, J.C.Ø., Rasmussen, H., Nielsen, T.F.D. & Rønsbo, J.G.<br />
1998: <strong>The</strong> triple group and the Platinova <strong>gold</strong> and palladium<br />
reefs in the Skaergaard intrusion: stratigraphic and petrographic<br />
relations. Economic Geology 93, 488–509.<br />
Anwar, Y.M. 1955: Geological investigations in East <strong>Greenland</strong>.<br />
Part V. <strong>The</strong> petrography of the Prinsen af Wales Bjerge lavas.<br />
Meddelelser om Grønland 135(1), 33 pp.<br />
Bernstein, S.B., Kelemen, P.B. & Brooks, C.K. 1998: Depleted<br />
spinel harzburgite xenoliths in Tertiary dykes from East<br />
<strong>Greenland</strong>: restites from high degree melting. Earth and<br />
Planetary Science Letters 154, 221–235.<br />
Bird, D.K., Brooks, C.K., Gannicott, R.A. & Turner, P.A. 1991: A<br />
<strong>gold</strong>-bearing horizon in the Skaergaard intrusion, East<br />
<strong>Greenland</strong>. Economic Geology 86, 1083–1092.<br />
Blank, H.R. & Gettings, M.E. 1972: Geophysical studies of the<br />
Skaergaard intrusion, East <strong>Greenland</strong>: initial results. Eos,<br />
Transactions, American Geophysical Union 53, 533 only.<br />
Blank, H.R. & Gettings, M.E. 1973: Subsurface form and extent<br />
of the Skaergaard intrusion, East <strong>Greenland</strong>. Eos, Transactions,<br />
American Geophysical Union 54, 507 only.<br />
Brooks, C.K. & field parties 1996: <strong>The</strong> East <strong>Greenland</strong> volcanic<br />
rifted margin – onshore DLC field work. Bulletin Grønlands<br />
Geologiske Undersøgelse 172, 95–102.<br />
Brooks, C.K. & Gill, R.C.O. 1982: Compositional variation in the<br />
pyroxenes and amphiboles of the Kangerdlugssuaq intrusion,<br />
East <strong>Greenland</strong>: further evidence for the crustal contamination<br />
of syenite magma. Mineralogical Magazine 45, 1–9.<br />
Brooks, C.K. & Nielsen, T.F.D. 1982a: <strong>The</strong> E <strong>Greenland</strong> continental<br />
margin: a transition between oceanic and continental magmatism.<br />
Journal of the Geological Society (London) 139(3),<br />
265–275.<br />
Brooks, C.K. & Nielsen, T.F.D. 1982b: <strong>The</strong> Phanerozoic development<br />
of the Kangerdlugssuaq area, East <strong>Greenland</strong>.<br />
Medddelelser om Grønland Geoscience 9, 30 pp.<br />
Brown, P.E. 1973: A layered plutonic complex of alkali basalt<br />
parentage: the Lilloise intrusion, east <strong>Greenland</strong>. Journal of<br />
the Geological Society (London) 129(4), 405–418.<br />
Brown, P.E., Brown, R.D., Chambers, A.D. & Soper, N.J. 1978:<br />
Fractionation and assimilation in the Borgtinderne syenite,<br />
East <strong>Greenland</strong>. Contributions to Mineralogy and Petrology 67,<br />
25–34.<br />
Brown, P.E., Evans, I.B. & Becker, S.M. 1996: <strong>The</strong> Prince of Wales<br />
Formation – post-flood basalt alkali volcanism in the Tertiary<br />
of East <strong>Greenland</strong>. Contributions to Mineralogy and Petrology<br />
123, 424–434.<br />
Coffin M.F. & Eldholm, O. 1994: Large igneous provinces: crustal<br />
structure, dimensions and external consequences. Reviews of<br />
Geophysics 32, 1–36.<br />
Eldholm, O. & Grue, K. 1994: North Atlantic volcanic margins:<br />
dimensions and production rates. Journal of Geophysical<br />
Research 99, 2295–2968.<br />
Fram, M.S. & Lesher, C.E. 1997: Generation and polybaric differentiation<br />
of East <strong>Greenland</strong> early Tertiary flood basalts.<br />
Journal of Petrology 38, 231–275.<br />
Hansen, H. & Nielsen, T.F.D. 1999: Crustal contamination in<br />
Palaeogene East <strong>Greenland</strong> flood basalts: plumbing system evolution<br />
during continental rifting. Chemical Geology 157, 89–118.<br />
Hogg, A.J., Fawcett, J.J., Gittins, J. & Gorton, M.P. 1988: Cyclical<br />
tholeiitic volcanism and associated magma chambers: eruptive<br />
mechanisms in E <strong>Greenland</strong>. In: Morton, A.C. & Parson,<br />
L.M. (eds): Early Tertiary volcanism and the opening of the<br />
NE Atlantic. Geological Society Special Publication (London)<br />
39, 197–200.<br />
Hogg, A.J., Fawcett, J.J., Gittins, J. & Gorton, M.P. 1989: Cyclical<br />
variation in composition in continental tholeiites of East<br />
<strong>Greenland</strong>. Canadian Journal of Earth Sciences 26, 534–543.<br />
96
Irvine, T.N. 1992: Emplacement of the Skaergaard intrusion.<br />
Carnegie Institution of Washington Yearbook 91, 91–96.<br />
Irvine, T.N., Andersen, J.C.Ø. & Brooks, C.K. 1998: Included<br />
blocks (and blocks within blocks) in the Skaergaard intrusion:<br />
geological relations and the origins of rythmic modally<br />
graded layers. Geological Society of America Bulletin 110,<br />
1398–1447.<br />
Kempe, D.R.C. & Deer, W.A. 1970: Geological investigations in<br />
East <strong>Greenland</strong>. IX. <strong>The</strong> mineralogy of the Kangerdlugssuaq<br />
alkaline intrusion. Meddelelser om Grønland 190(3), 95 pp.<br />
Kempe, D.R.C., Deer, W.A. & Wager, L.R. 1970: Geological investigations<br />
in East <strong>Greenland</strong>. VIII. <strong>The</strong> petrology of the<br />
Kangerdlugssuaq intrusion. Meddelelser om Grønland 190(2),<br />
49 pp.<br />
Larsen, L.M., Watt, W.S. & Watt, M. 1989: Geology and petrology<br />
of the Lower Tertiary plateau basalts of the Scoresby Sund<br />
region, East <strong>Greenland</strong>. Bulletin Grønlands Geologiske<br />
Undersøgelse 157, 164 pp.<br />
Larsen, L.M., Waagstein, R., Pedersen, A.K. & Storey, M. 1999: Trans-<br />
Atlantic correlation of the Palaeogene successions in the Faeroe<br />
Islands and East <strong>Greenland</strong>. Journal of the Geological Society<br />
(London) 156(6), 1081–1095.<br />
Larsen, M., Hamberg, L., Olaussen, S. & Stemmerik, L. 1996:<br />
Cretaceous–Tertiary pre-drift sediments of the Kangerlussuaq<br />
area, southern East <strong>Greenland</strong>. Bulletin Grønlands Geologiske<br />
Undersøgelse 172, 37–41.<br />
Larsen, M., Hamberg, L., Olaussen, S., Nørgaard-Pedersen, N. &<br />
Stemmerik, L. 1999: Basin evolution in southern East <strong>Greenland</strong>:<br />
an outcrop analog for Cretaceous–Paleogene basins on the<br />
North Atlantic volcanic margins. AAPG Bulletin 83(8),<br />
1236–1261. Tulsa: American Association of Petroleum<br />
Geologists.<br />
Larsen, M., Bjerager, M., Nedkvitne, T., Olaussen, S. & Preuss, T.<br />
2001: Pre-basaltic sediments (Aptian–Paleocene) of the<br />
Kangerlussuaq Basin, southern East <strong>Greenland</strong>. Geology of<br />
<strong>Greenland</strong> Survey Bulletin 189, 99–106 (this volume).<br />
McBirney, A.R. 1975: Differentiation of the Skaergaard intrusion.<br />
Nature 253, 691–694.<br />
McBirney, A.R. 1996: <strong>The</strong> Skaergaard intrusion. In: Cawthorn,<br />
R.G. (ed.): Layered intrusions, 147–180. Amsterdam: Elsevier.<br />
Mahoney, J.J. & Coffin, M.F. (eds) 1997: Large igneous provinces:<br />
continental, oceanic, and planetary flood volcanism. American<br />
Geophysical Union, Geophysical Monograph 100, 438 pp.<br />
Nielsen, T.F.D. 1987: Tertiary alkaline magmatism in East<br />
<strong>Greenland</strong>: a review. In: Fitton, J.G. & Upton, B.G.J. (eds):<br />
Alkaline igneous rocks. Geological Society Special Publication<br />
(London) 30, 489–515.<br />
Nielsen, T.F.D. 2001: <strong>The</strong> palladium potential of the Skaergaard<br />
intrusion, East <strong>Greenland</strong>. Danmarks og Grønlands Geologiske<br />
Undersøgelse Rapport 2001/23, 39 pp.<br />
Nielsen, T.F.D. & Brooks, C.K. 1981: <strong>The</strong> E <strong>Greenland</strong> rifted continental<br />
margin: an examination of the coastal flexure. Journal<br />
of the Geological Society (London) 138(5), 559–568.<br />
Nielsen, T.F.D. & Brooks, C.K. 1991: Generation of nordmarkitic<br />
melts by melting of basement gneisses: the Astrophyllite Bay<br />
complex, Kangerdlugssuaq. Bulletin of the Geological Society<br />
of Denmark 38(3–4), 161–164.<br />
Nielsen, T.F.D., Soper, N.J., Brooks, C.K., Faller, A.M., Higgins,<br />
A.C. & Matthews, D.W. 1981: <strong>The</strong> pre-basaltic sediments and<br />
the lower lavas at Kangerdlugssuaq, East <strong>Greenland</strong>. <strong>The</strong>ir<br />
stratigraphy, lithology, palaeomagnetism and petrology.<br />
Meddelelser om Grønland Geoscience 6, 25 pp.<br />
Nielsen, T.F.D. et al. 2000: Retrieval of Platinova drill cores: a new<br />
Skaergaard initiative. 2000 fall meeting, San Francisco, USA,<br />
15–19 December 2000. Eos, Transactions, American<br />
Geophysical Union 81(48), F1366 only.<br />
Norton, D., Taylor, H.P., Jr. & Bird, D.K. 1984: <strong>The</strong> geometry and<br />
high-temperature brittle deformation of the Skaergaard intrusion.<br />
Journal of Geophysical Research 89B, 10178–10192.<br />
Pankhurst, R.J., Beckinsale, R.D. & Brooks, C.K. 1976: Strontium<br />
and oxygen isotope evidence relating to the petrogenesis of<br />
the Kangerdlugssuaq alkaline intrusion, East <strong>Greenland</strong>.<br />
Contributions to Mineralogy and Petrology 54, 17–42.<br />
Peate, D.W., Brooks, C.K., Baker, J.A., Blichert-Toft, J., Pedersen,<br />
A.K., Hansen, H., Storey, M. & Mattey, D.P. 2000: Origin of<br />
late-stage alkaline magmatism in the Tertiary East <strong>Greenland</strong><br />
flood basalt province: the Prinsen af Wales Bjerge in the inland<br />
Kangerlussuaq region. Penrose 2000: Volcanic Rifted Margins,<br />
London, UK. Abstract volume, 67 only.<br />
Pedersen, A.K., Watt, M., Watt, W.S. & Larsen, L.M. 1997: Structure<br />
and stratigraphy of the Early Tertiary basalts of the Blosseville<br />
Kyst, East <strong>Greenland</strong>. Journal of the Geological Society<br />
(London) 154(3), 565–570.<br />
Riishuus, M.S., Peate, D.W., Brooks, C.K. & Wilson, J.R. 2001: <strong>The</strong><br />
role of fractionation, assimilation, and diffusion in the evolution<br />
of syenitic magmas: the Palaeogene Kangerlussuaq Alkaline<br />
Complex, East <strong>Greenland</strong>. EUG XI, Strasbourg, France, 8-12<br />
April, 2001. Abstract volume, 574 only.<br />
Schønwandt, H.K. 1988: Geology and geotectonic setting of cratonic<br />
porphyry molybdenum deposits in the North Atlantic<br />
region. In: Boissonnas, J. & Omenetto, P. (eds): Mineral deposits<br />
within the European Community, 210–229. Berlin: Springer<br />
Verlag.<br />
Soper, N.J., Downie, A.C., Higgins, A.C. & Costa, L.I., 1976a:<br />
Biostratigraphic ages of Tertiary basalts on the East <strong>Greenland</strong><br />
continental margin and their relationship to plate separation<br />
in the northeast Atlantic. Earth and Planetary Science Letters<br />
32, 149–157.<br />
Soper, N.J., Higgins, A.C., Downie, C., Matthews, D.W. & Brown,<br />
P.E. 1976b: Late Cretaceous – early Tertiary stratigraphy of the<br />
Kangerdlugssuaq area, east <strong>Greenland</strong>, and the age of opening<br />
of the north-east Atlantic. Journal of the Geological Society<br />
(London) 132(1), 85–104.<br />
Storey, M., Duncan, R.A., Larsen, H.C., Pedersen, A.K., Waagstein,<br />
R., Larsen, L.M., Tegner, C. & Lesher, C.E. 1996a: Impact and<br />
rapid flow of the Iceland plume beneath <strong>Greenland</strong> at 61 Ma.<br />
Eos, Transactions, American Geophysical Union 77(Supplement),<br />
F839 only.<br />
Storey, M., Pedersen, A.K., Larsen, H.C., Larsen, L.M., Stecher, O.,<br />
Duncan, R.A., Tegner, C. & Carlson, R.W. 1996b: Middle<br />
Miocene volcanism in East <strong>Greenland</strong>. Eos, Transactions,<br />
American Geophysical Union 77(Supplement), F823 only.<br />
Tegner, C. 1997: Iron in plagioclase as a monitor of the differentiation<br />
of the Skaergaard intrusion. Contributions to<br />
97
Mineralogy and Petrology 128, 45–51.<br />
Tegner, C., Duncan, R.A., Bernstein, S., Brooks, C.K., Bird, D.K.<br />
& Storey, M. 1998a: 40Ar-39Ar geochronology of Tertiary mafic<br />
intrusions along the East <strong>Greenland</strong> rifted margin: relation to<br />
flood basalts and the Iceland hotspot track. Earth and Planetary<br />
Science Letters 156, 75–88.<br />
Tegner, C., Lesher, C.E., Larsen, L.M. & Watt, W.S. 1998b: Evidence<br />
from the rare-earth-element record of mantle melting for cooling<br />
of the Tertiary Iceland mantle plume. Nature 395, 591–594.<br />
Thomassen, B. & Krebs, J.D. 2001: Reconnaissance for noble<br />
metals in Precambrian and Palaeogene rocks, Amdrup Fjord,<br />
southern East <strong>Greenland</strong>. Geology of <strong>Greenland</strong> Survey Bulletin<br />
189, 76–82 (this volume) .<br />
Ukstins, I.A. 2000: Pyroclastic deposits of the East <strong>Greenland</strong><br />
flood basalt province, 210 pp. Unpublished M.Sc. thesis,<br />
Department of Geology, University of California Davis, USA.<br />
Wager, L.R., 1934: Geological investigations in <strong>Greenland</strong>. Part<br />
1: General geology from Angmagsalik to Kap Dalton.<br />
Meddelelser om Grønland 105(2), 47 pp.<br />
Wager, L.R. 1947: Geological investigations in East <strong>Greenland</strong>. Part<br />
IV: <strong>The</strong> stratigraphy and tectonics of Knud Rasmussens Land<br />
and the Kangerdlugssuaq region. Meddelelser om Grønland<br />
134(5), 64 pp.<br />
Wager, L.R. 1965: <strong>The</strong> form and internal structure of the alkaline<br />
Kangerdlugssuaq intrusion, East <strong>Greenland</strong>. Mineralogical<br />
Magazine 34, 487–497.<br />
Wager, L.R. & Brown, G.M. 1968: Layered igneous rocks. 588 pp.<br />
Edinburgh & London: Oliver & Boyd.<br />
Wager, L.R. & Deer, W.A. 1939: Geological investigations in East<br />
<strong>Greenland</strong>. Part III: <strong>The</strong> petrology of the Skaergaard intrusion,<br />
Kangerdlugssuaq, East <strong>Greenland</strong>. Meddelelser om Grønland<br />
105(4), 352 pp.<br />
Authors’ addresses<br />
T.F.D.N. & H.H., Geological Survey of Denmark and <strong>Greenland</strong>, Thoravej 8, DK-2400 Copenhagen NV, Denmark. E-mail: tfn@geus.dk<br />
C.K.B., Institute of Geology, University of Copenhagen, Øster Voldgade 10, DK-1350 Copenhagen K, Denmark.<br />
C.E.L., Department of Geology, University of California Davis, One Shields Avenue, Davis, CA 95616, USA.<br />
98
Pre-basaltic sediments (Aptian–Paleocene) of the<br />
Kangerlussuaq Basin, southern East <strong>Greenland</strong><br />
Michael Larsen, Morten Bjerager, Tor Nedkvitne, Snorre Olaussen and Thomas Preuss<br />
<strong>The</strong> recent licensing round in the deep-water areas<br />
south-east of the Faeroe Islands has emphasised the continued<br />
interest of the oil industry in the frontier areas<br />
of the North Atlantic volcanic margins. <strong>The</strong> search for<br />
hydrocarbons is at present focused on the Cretaceous–Paleocene<br />
succession with the Paleocene deepwater<br />
play as the most promising (Lamers & Carmichael<br />
1999). <strong>The</strong> exploration and evaluation of possible plays<br />
are almost solely based on seismic interpretation and<br />
limited log and core data from wells in the area west<br />
of the Shetlands. <strong>The</strong> Kangerlussuaq Basin in southern<br />
East <strong>Greenland</strong> (Fig. 1) provides, however, important<br />
information on basin evolution prior to and during continental<br />
break-up that finally led to active sea-floor<br />
spreading in the northern North Atlantic. In addition,<br />
palaeogeographic reconstructions locate the southern<br />
East <strong>Greenland</strong> margin only 50–100 km north-west of<br />
the present-day Faeroe Islands (Skogseid et al. 2000),<br />
suggesting the possibility of sediment supply to the offshore<br />
basins before the onset of rifting and sea-floor<br />
spreading. In this region the Lower Cretaceous –<br />
Palaeogene sedimentary succession reaches almost 1 km<br />
in thickness and comprises sediments of the<br />
Kangerdlugssuaq Group and the siliciclastic lower part<br />
of the otherwise basaltic Blosseville Group (Fig. 2).<br />
Note that the Kangerdlugssuaq Group was defined<br />
when the fjord Kangerlussuaq was known as<br />
‘Kangerdlugssuaq’. Based on field work by the<br />
Geological Survey of Denmark and <strong>Greenland</strong> (GEUS)<br />
during summer 1995 (Larsen et al. 1996), the sedimentology,<br />
sequence stratigraphy and basin evolution of the<br />
Kangerlussuaq Basin were interpreted and compared<br />
with the deep-water offshore areas of the North Atlantic<br />
(Larsen et al. 1999a, b).<br />
In August 2000, key stratigraphic sections were revisited<br />
by geologists from GEUS and Norsk Hydro and a<br />
number of additional localities described (Fig. 1). <strong>The</strong><br />
aims of the field work included: (1) sedimentological<br />
description of Lower Cretaceous sandstones; (2)<br />
improved biostratigraphy in the Upper Cretaceous mudstone<br />
succession; and (3) detailed description of the transition<br />
between the uppermost sediments and the base<br />
of the volcanic succession. In addition, macrofossils<br />
(mostly ammonites, bivalves and belemnites) were sampled<br />
throughout the Cretaceous succession. Based on<br />
results from a preliminary diagenesis study (Larsen et<br />
al. 1999b), sandstones were collected across the contact<br />
metamorphic zone around Palaeogene intrusions<br />
in order to evaluate their thermal and diagenetic effects.<br />
<strong>The</strong> field work was financed with support from Norsk<br />
Hydro and formed part of a major field campaign in<br />
the Kangerlussuaq area (EG 2000) reported on by<br />
Nielsen et al. (2001, this volume).<br />
Sedimentology<br />
Lower Cretaceous (Christian IV Gletscher)<br />
<strong>The</strong> oldest sediments in the Kangerlussuaq Basin are<br />
of Early Cretaceous (Aptian – Early Albian) age (Fig. 2).<br />
This succession is dominated by coarse-grained sandstones<br />
and was first described by Larsen et al. (1996,<br />
1999a) from a locality north of Sødalen. At this locality<br />
a lower, alluvial succession is overlain by large-scale<br />
channelled and cross-bedded fluvio-estuarine sandstones<br />
(Larsen et al. 1999a). <strong>The</strong> general palaeocurrent<br />
direction was towards the east, but the lack of reference<br />
sections has hitherto hindered conclusions on distribution<br />
and palaeogeography. In summer 2000 a<br />
number of possible Lower Cretaceous reference sections<br />
were measured along the western side of Christian IV<br />
Gletscher (Fig. 1). <strong>The</strong>se sections were briefly described<br />
during a helicopter reconnaissance visit in 1995, but more<br />
detailed measurements of sedimentological sections<br />
and sampling of ammonites was undertaken in 2000.<br />
<strong>The</strong> sections are sandstone-dominated, and reach<br />
more than 170 m in thickness. <strong>The</strong> lowest parts are<br />
Geology of <strong>Greenland</strong> Survey Bulletin 189, 99–106 (2001) © GEUS, 2001<br />
99
Kangerlussuaq<br />
Nansen Fjord<br />
Scoresb y<br />
30°<br />
6° 33° 27°<br />
24°<br />
69°<br />
68°<br />
Palaeogene basaltic rocks<br />
Cretaceous–Palaeogene<br />
sediments<br />
Precambrian basement<br />
Inland<br />
Ice<br />
70°<br />
Section locations 2000<br />
Blosseville Kyst<br />
S u n d<br />
Kap<br />
Dalton<br />
70°<br />
Kap<br />
Brewster<br />
68° 68°<br />
60°<br />
<strong>Greenland</strong><br />
70°<br />
69°<br />
North<br />
Atlantic<br />
Kangerlussuaq<br />
15°W<br />
Jameson<br />
Land<br />
Iceland<br />
Faeroes<br />
Shetlands<br />
Norway<br />
60°<br />
67°<br />
32°<br />
100 km<br />
UK<br />
50° 30°W 15°W<br />
67°<br />
50°<br />
30° 27°<br />
24°<br />
31° 30°<br />
33°<br />
30°<br />
Trillingerne<br />
Snekuplen<br />
‘Sequoia Nunatak’<br />
66°<br />
Kulhøje<br />
Skærmen<br />
Korridoren<br />
Christian IV<br />
Gletscher<br />
Sorgenfri<br />
Sortekap<br />
Gletscher<br />
1<br />
68°30'<br />
Pyramiden<br />
2<br />
Frederiksborg Gletscher<br />
Kangerlussuaq<br />
3<br />
Ryberg<br />
J.A.D.<br />
Jensen<br />
Nansen<br />
Fjord<br />
Fjord<br />
(<br />
Fjord<br />
Sødalen<br />
J.C. Jacobsen Fjord<br />
32° 31° 30°<br />
25 km<br />
Fig. 1. Geological maps showing the distribution of Cretaceous–Palaeogene sediments and the Palaeogene flood basalts of the southern<br />
East <strong>Greenland</strong> volcanic province. <strong>The</strong> position of sections logged in 2000 (black dots) and localities mentioned in the text are<br />
indicated. Red line in lower map connects sections 1, 2 and 3 shown in Fig. 5. Based on Larsen et al. (1996).<br />
100
poorly exposed and consist of coarse-grained, locally<br />
pebbly, sandstones rich in coalified wood debris. <strong>The</strong>se<br />
are overlain by medium- to coarse-grained, large-scale<br />
cross-bedded sandstones, which are bioturbated and<br />
show Thalassinoides isp. and Planolites isp. <strong>The</strong> upper<br />
boundary of the sandstone-dominated succession is a<br />
strongly carbonate-cemented horizon overlain by a<br />
thick succession of silty mudstones with numerous heteromorph<br />
ammonites. <strong>The</strong> Lower Cretaceous succession<br />
along the west side of Christian IV Gletscher is<br />
interpreted to consist of a lower alluvial part overlain<br />
by shallow marine deposits and finally offshore marine<br />
mudstones. <strong>The</strong> upwards change is thus the same as<br />
that seen in the Upper Aptian – Lower Albian succession<br />
at the locality north of Sødalen, and reflects an overall<br />
rise in sea level.<br />
Upper Cretaceous – Paleocene<br />
(‘Sequoia Nunatak’)<br />
Monotonous silty mudstones and fine-grained sandstones<br />
reaching several hundred metres in thickness<br />
(Fig. 3) dominate the Upper Cretaceous succession.<br />
<strong>The</strong> mudstones are best exposed in the area around<br />
Pyramiden and between Sorgenfri Gletscher and<br />
Christian IV Gletscher where they reach their maximum<br />
thickness. Nørgaard-Pedersen (1992) reported a<br />
probable Cretaceous succession at ‘Sequoia Nunatak’<br />
(an unofficial name) north-east of Kulhøje, greatly<br />
expanding the then known extension of the Cretaceous<br />
basin (Fig. 1). <strong>The</strong> sediments were described as a few<br />
metres of fine-grained sandstones containing internal<br />
casts of echinoderms and ammonites. Field work in<br />
2000, however, revealed in addition a several hundred<br />
metres thick succession of fine-grained micaceous sandstones<br />
just east of the locality described by Nørgaard-<br />
Pedersen. <strong>The</strong>se sandstones contain a rich fauna of<br />
ammonites, echinoderms and bivalves of Late Cretaceous<br />
age. <strong>The</strong> fine-grained sandstones are truncated at the<br />
top of the succession by a 7 m thick conglomerate bed<br />
interpreted as a fluvial channel-fill, which is overlain<br />
by volcaniclastic deposits. <strong>The</strong> stratigraphic position of<br />
the conglomeratic unit immediately underlying the first<br />
volcanic deposits, together with the abrupt change from<br />
marine to continental deposits and the coarse-grained<br />
lithology, suggest that it may be correlated with the<br />
Schjelderup Member of the coastal areas (Soper et al.<br />
1976). Biostratigraphic samples collected in 2000 may<br />
provide the evidence for the correlation between the<br />
nunatak area around ‘Sequoia Nunatak’ and the coastal<br />
region.<br />
Ma<br />
55<br />
60<br />
65<br />
70<br />
75<br />
80<br />
85<br />
90<br />
95<br />
100<br />
105<br />
110<br />
115<br />
System<br />
Series<br />
Palaeogene<br />
Cretaceous<br />
Paleocene Eocene<br />
Lower Upper<br />
Stage<br />
Ypresian<br />
Thanetian<br />
Danian<br />
Campanian<br />
Santonian<br />
Coniacian<br />
Turonian<br />
Maastrichtian<br />
Cenomanian<br />
Albian<br />
Aptian<br />
Group<br />
Blosseville<br />
Kangerdlugssuaq<br />
Volcanic succession<br />
Lacustrine shale<br />
Fluvial conglomerate<br />
Marine sandstone<br />
KANGERLUSSUAQ BASIN<br />
Schjelderup Mb<br />
Ryberg Formation<br />
Poorly exposed<br />
Possible hiatus<br />
Sorgenfri Formation<br />
Not exposed<br />
Submarine channel<br />
turbidites<br />
Calcareous mudstone<br />
Marine shale<br />
Crystalline basement<br />
Fig. 2. Lithostratigraphy of the Kangerlussuaq Basin. <strong>The</strong> succession<br />
below the Sorgenfri Formation (Aptian – Early Albian)<br />
was not described until 1995 and therefore was not included in<br />
the lithostratigraphic scheme by Soper et al. (1976). A revision<br />
of this succession (below the dotted line) is in preparation by<br />
the senior author (M.L.). Based on Soper et al. (1976), Nielsen<br />
et al. (1981) and Larsen et al. (1999a).<br />
101
Fig. 3. Upper Cretaceous marine mudstone succession exposed<br />
along the western side of Christian IV Gletscher. <strong>The</strong> section shown<br />
is approximately 450 m thick and consists of silty, mica-rich mudstones<br />
with thin interbeds of fine-grained sandstones. Ammonites<br />
and echinoderms are present in several horizons and may form<br />
the basis for an improved Upper Cretaceous stratigraphy.<br />
Paleocene (Ryberg Fjord)<br />
<strong>The</strong> boundary between the Kangerdlugssuaq Group<br />
and Blosseville Group is represented by a major unconformity<br />
which separates Upper Cretaceous or Lower<br />
Paleocene marine mudstones below from coarse-grained<br />
fluvial deposits above (Soper et al. 1976; Dam et al. 1998;<br />
Larsen et al. 1999a). However, towards the coast (localities<br />
2 and 3, Ryberg Fjord; Fig. 1) the unconformity correlates<br />
with a number of less distinct bounding surfaces<br />
separating shallow marine, deltaic and fluvial units. At<br />
Ryberg Fjord, a thick sandstone-dominated succession<br />
is exposed (Fig. 4). It consists of marine, fossiliferous<br />
fine-grained sandstone unconformably overlain by an<br />
up to 7 m thick pebbly sandstone bed, in turn overlain<br />
by black carbonaceous mudstones and fine-grained<br />
sandstones showing rootlets (Fig. 5). <strong>The</strong> erosionally<br />
based pebbly sandstone is interpreted as a fluvial channel-fill<br />
that marks a change from marine to dominantly<br />
continental deposition. Higher in the succession a return<br />
to shallow marine conditions is marked by strongly bioturbated<br />
sandstones interpreted as upper shoreface and<br />
beach deposits. <strong>The</strong> siliciclastic succession is overlain<br />
by a thick succession of volcaniclastic deposits and<br />
hyaloclastites. <strong>The</strong> Paleocene succession at Ryberg Fjord<br />
comprising shallow marine and deltaic deposits is thicker<br />
and more complete than that described from the inland<br />
areas. This indicates that increasing accommodation<br />
room was present in the more basinal areas to the<br />
south-east and that multiple episodes of shoreface and<br />
delta progradation took place during the uplift phase<br />
preceding the onset of volcanism in East <strong>Greenland</strong>.<br />
Fig. 4. Paleocene sandstones exposed at<br />
Ryberg Fjord. <strong>The</strong> sandstone unit in the<br />
foreground is 7 m thick and is interpreted<br />
as a fluvial channel-fill. <strong>The</strong>se<br />
coarse-grained channel sandstones were<br />
deposited following regional uplift in the<br />
mid-Paleocene, just before the onset of<br />
volcanism. In the background volcaniclastic<br />
deposits and hyaloclastites can be<br />
seen.<br />
102
3<br />
m<br />
1<br />
m<br />
200 ?<br />
fluvial<br />
volcaniclastics<br />
140<br />
130<br />
poorly<br />
exposed<br />
190<br />
lacustrine shales/<br />
tuff<br />
120<br />
poorly<br />
exposed<br />
Blosseville Group<br />
180<br />
170<br />
160<br />
150<br />
lava flow<br />
lava flow<br />
mouth bar<br />
fluvial<br />
volcaniclastics<br />
2<br />
m<br />
60<br />
50<br />
40<br />
poorly<br />
exposed<br />
fluvial<br />
channels<br />
110<br />
100<br />
90<br />
80<br />
140<br />
130<br />
fluvial channels<br />
lagoonal or lacustrine<br />
deltaic mouth bar<br />
30<br />
20<br />
upper<br />
shoreface<br />
70<br />
60<br />
fluvial channels<br />
ε-cross-bedding<br />
upper shoreface<br />
120<br />
110<br />
offshore marine<br />
submarine channel<br />
(debris flow)<br />
10<br />
0<br />
Mud F M C Gr<br />
Sand<br />
offshore<br />
marine<br />
50<br />
40<br />
poorly<br />
exposed<br />
Kangerdlugssuaq Group<br />
100<br />
90<br />
80<br />
70<br />
60<br />
50<br />
40<br />
30<br />
submarine fan<br />
turbidite channel<br />
submarine fan<br />
turbidite channel<br />
submarine fan<br />
turbidite channel<br />
Laminated or massive<br />
mudstone<br />
Planar Trough cross-beddedsandstone<br />
sandstone<br />
Planar bedded sandstone<br />
Hummocky crossstratified<br />
sandstone<br />
Pebbly sandstone<br />
Pebbles and cobbles<br />
Contorted bedding<br />
Laminated<br />
volcaniclastic sediments<br />
Basaltic lava flov<br />
Current ripple<br />
Wave ripple<br />
Load structure<br />
Palaeocurrent<br />
(current ripple)<br />
Palaeocurrent<br />
(current ripple)<br />
30<br />
20<br />
10<br />
0<br />
Mud F M C Gr<br />
Sand<br />
Ophiomorpha<br />
Thalassinoides<br />
Rhizocorallium<br />
Horizontal burrow<br />
Gastropod<br />
offshore<br />
bar<br />
offshore<br />
marine<br />
20<br />
Bioturbation, weak<br />
Bivalve<br />
10<br />
submarine fan<br />
turbidite channel<br />
Bioturbation, moderate<br />
Bioturbation, strong<br />
Coquina<br />
Carbonaceous debris<br />
Planolites<br />
Fossil wood<br />
0<br />
Mud F M C Gr<br />
Sand<br />
Skolithos<br />
Diplocraterion<br />
Leaf imprints<br />
Rootlets<br />
Fig. 5. Geological logs showing correlation of the Paleocene successions in the central part of the Kangerlussuaq Basin. Locations of<br />
sections (1, 2, 3) are shown on Fig. 1. Note the thick shallow marine and deltaic succession present below the unconformity in the<br />
southernmost section (3) compared to the strong truncation that occurs inland. <strong>The</strong> succession indicates that repeated progradation<br />
of shallow marine and deltaic successions occurred during the mid-Paleocene pre-volcanic uplift. Colour coding refers to depositional<br />
environments. For legend, see Fig. 2.<br />
103
Stratigraphy<br />
Biostratigraphy<br />
Detailed understanding of the Kangerlussuaq Basin has<br />
hitherto been hampered by the low resolution of the<br />
biostratigraphic data. This is partly a consequence of<br />
failure to collect macrofossils, and partly due to very<br />
low yields of microfossils from the existing sample<br />
material. In order to overcome these problems special<br />
attention was paid to the collection of macrofossils,<br />
and several mudstone sections situated away from major<br />
intrusions were sampled for palynological work (Fig.<br />
3). <strong>The</strong> efforts put into the macrofossil collecting were<br />
rewarded, such that close to 50 ammonites representing<br />
both Lower and Upper Cretaceous species were<br />
brought back from the field.<br />
Lithostratigraphy<br />
<strong>The</strong> discovery of an Aptian–Albian, sandstone-dominated<br />
succession below the Sorgenfri Formation in 1995<br />
(Fig. 2) and the finds of new ammonite-bearing intervals<br />
made it clear that a revision of the existing lithostratigraphy<br />
was necessary (Larsen et al. 1999a). However,<br />
the lack of biostratigraphic control in the Upper<br />
Cretaceous mudstone-dominated succession, and the<br />
poor understanding of the lower volcanic succession<br />
which appeared to interfinger with the sedimentary<br />
rocks, impeded interpretation. <strong>The</strong> results of the field<br />
work in 2000 combined with biostratigraphical and sedimentological<br />
data compiled by Cambridge Arctic Shelf<br />
Programme (CASP) will enable a common lithostratigraphic<br />
scheme for the Kangerlussuaq Basin to be published<br />
in the near future. This new lithostratigraphy is<br />
a collaborative project between GEUS and CASP.<br />
Diagenesis<br />
<strong>The</strong> sandstones of the Kangerlussuaq Basin have been<br />
strongly diagenetically altered, due to their position<br />
close to major Palaeogene intrusive centres and a burial<br />
history that included rapid pre-volcanic uplift followed<br />
by deep burial beneath continental flood basalts. <strong>The</strong><br />
complex diagenetic history comprises chlorite and illite<br />
precipitation, mechanical crushing, detrital feldspar dissolution<br />
and albitisation followed by albite precipitation<br />
and quartz overgrowth. <strong>The</strong> last common phase is<br />
calcite, while later kaolinite is only observed in the<br />
coarse-grained fluvial sandstones of the Schjelderup<br />
Member (Larsen et al. 1999b). <strong>The</strong> original excellent<br />
porosity of the sandstones is only preserved in a few<br />
places due to early chlorite coating of grains preventing<br />
quartz overgrowth. Otherwise, the original porosity<br />
has been completely destroyed, and the present<br />
porosity (5–10%) mainly reflects secondary porosity<br />
originating from dissolution of detrital feldspar. <strong>The</strong><br />
dissolution process seems to be significantly enhanced<br />
in the coarse-grained sandstones in areas with many<br />
intrusions. <strong>The</strong> secondary pore space may be reduced<br />
by authigene albite growth on detrital grain remnants<br />
together with later syntaxial quartz overgrowths engulfing<br />
the albite (Fig. 6). In places, clay coatings or ductile<br />
clay clasts can be seen to inhibit quartz ingrowths,<br />
thus preserving the secondary porosity. <strong>The</strong> coarse-<br />
Qo<br />
Ab<br />
I1<br />
Qo<br />
Qo<br />
200 µm<br />
Qo<br />
Ab<br />
Ab<br />
Qo<br />
I1<br />
Fig. 6. Scanning electron photomicrograph<br />
of a coarse-grained Paleocene<br />
sandstone, showing secondary pore<br />
space formed by feldspar dissolution.<br />
<strong>The</strong> pore space is partly filled by growth<br />
of euhedral albite crystals (Ab) nucleated<br />
on the detrital feldspar remnants. Illitic<br />
clay lining (Il) marks the boundaries of<br />
the former detrital grains (arrows). Later,<br />
euhedral quartz (Qo) overgrows the clay<br />
linings and engulfs the authigene albite.<br />
104
grained sandstones in the north-eastern part of the basin<br />
show the most complete feldspar dissolution, but also<br />
experienced the most intensive phase of late quartz<br />
overgrowth, which nearly infilled all of the secondary<br />
formed porosity.<br />
In order to better understand the diagenetic history<br />
and evaluate models for sandstone diagenesis in subbasaltic<br />
settings, sandstone samples from the measured<br />
sections were studied. However, local effects from crosscutting<br />
basic dykes and sills have strongly influenced<br />
diagenesis, and thus sandstones were collected across<br />
the contact metamorphic zone from adjacent to the<br />
intrusion to a distance as far away as two to three times<br />
the thickness of the intrusion. <strong>The</strong> results of these investigations<br />
will be compared with the samples unaffected<br />
by intrusions in order to separate local and regional<br />
effects.<br />
Conclusions<br />
Field work in the Kangerlussuaq Basin in 2000 has<br />
added much information to the understanding of the<br />
basin evolution. Most important, perhaps, is the<br />
improved biostratigraphic resolution that allows identification<br />
and correlation of unconformities between<br />
measured sections. Unconformities mark major changes<br />
in basin configuration and are often associated with<br />
uplift and erosion. <strong>The</strong> unconformity present at the<br />
base of the Schjelderup Member, and now recognised<br />
throughout the basin, thus suggests that coarse-grained<br />
sediments bypassed the Kangerlussuaq area at this time<br />
and were transported across the East <strong>Greenland</strong> margin<br />
to offshore basins to the south-east. With a pre-drift<br />
position only 50–100 km north-west of <strong>prospect</strong>ive<br />
areas around the Faeroe Islands the understanding of<br />
the pre-basaltic basin evolution in southern East<br />
<strong>Greenland</strong> may be used to identify possible reservoir<br />
intervals and play types in the undrilled deep-water<br />
areas of the northern North Atlantic volcanic margins.<br />
Future work<br />
<strong>The</strong> Palaeogene flood basalts along the Blosseville Kyst<br />
are part of an extensive basalt province extending from<br />
Kangerlussuaq in the south to Scoresby Sund in the<br />
north. Sediments are exposed only at two isolated localities<br />
along the coastal stretch, at Kap Dalton and Kap<br />
Brewster (Fig. 1). <strong>The</strong>se two localities form important<br />
datapoints for reconstruction of the North Atlantic region<br />
during continental break-up and for biostratigraphic<br />
control of the onset and duration of the volcanism in<br />
southern East <strong>Greenland</strong>. Both localities were visited<br />
by geologists in the 1970s (Birkenmajer 1972; Soper et<br />
al. 1976), but no recent sedimentological descriptions<br />
have been published. In the summer of 2001 field work<br />
will be carried out in the sedimentary successions at Kap<br />
Brewster and Kap Dalton using sedimentological, biostratigraphical<br />
and sequence stratigraphical methods.<br />
<strong>The</strong> results will be integrated with basin models and<br />
stratigraphy in the areas to the south-west around<br />
Kangerlussuaq and to the north in North-East <strong>Greenland</strong>.<br />
Acknowledgements<br />
We gratefully acknowledge economic support by Norsk Hydro<br />
that made it possible for T.N. and S.O. to participate in the field<br />
work and supplied flexibility to the otherwise limited helicopter<br />
programme. Troels F.D. Nielsen (leader of EG 2000) is thanked<br />
for his engagement and enthusiasm, which made the field campaign<br />
in Kangerlussuaq a success.<br />
References<br />
Birkenmajer, K. 1972: Report on investigations of Tertiary sediments<br />
at Kap Brewster, Scoresby Sund, East <strong>Greenland</strong>. Rapport<br />
Grønlands Geologiske Undersøgelse 48, 85–91.<br />
Dam, G., Larsen, M. & Sønderholm, M. 1998: Sedimentary response<br />
to mantle plumes: implications from Paleocene onshore successions,<br />
West and East <strong>Greenland</strong>. Geology 26, 207–210.<br />
Lamers, E. & Carmichael, S.M.M. 1999: <strong>The</strong> deepwater sandstone<br />
play west of Shetland. In: Fleet, A.J. & Boldy, S.A.R. (eds):<br />
Petroleum geology of Northwest Europe. Proceedings of the<br />
5th Conference, 645–659. London: Geological Society.<br />
Larsen, M., Hamberg, L., Olaussen, S. & Stemmerik, L. 1996:<br />
Cretaceous–Tertiary pre-drift sediments of the Kangerlussuaq<br />
area, southern East <strong>Greenland</strong>. Bulletin Grønlands Geologiske<br />
Undersøgelse 172, 37–41.<br />
Larsen, M., Hamberg, L., Olaussen, S., Nørgaard-Pedersen, N. &<br />
Stemmerik, L. 1999a: Basin evolution in southern East<br />
<strong>Greenland</strong>: An outcrop analog for Cretaceous–Paleogene<br />
basins on the North Atlantic volcanic margins. AAPG Bulletin<br />
83(8), 1236–1261. Tulsa: American Association of Petroleum<br />
Geologists.<br />
Larsen, M., Hamberg, L., Olaussen, S., Preuss, T. & Stemmerik,<br />
L. 1999b: Sandstone wedges of the Cretaceous – Lower Tertiary<br />
Kangerlussuaq Basin, East <strong>Greenland</strong> – outcrop analogues to<br />
the offshore North Atlantic. In: Fleet, A.J. & Boldy, S.A.R.<br />
(eds): Petroleum geology of Northwest Europe. Proceedings<br />
of the 5th Conference, 337–348. London: Geological Society.<br />
Nielsen, T.F.D., Soper, N.J., Brooks, C.K., Faller, A.M., Higgins,<br />
A.C. & Matthews, D.W. 1981: <strong>The</strong> pre-basaltic sediments and<br />
the Lower Basalts at Kangerdlugssuaq, East <strong>Greenland</strong>. <strong>The</strong>ir<br />
105
stratigraphy, lithology, palaeomagnetism and petrology.<br />
Meddelelser om Grønland Geoscience 6, 25 pp.<br />
Nielsen, T.F.D., Hansen, H., Brooks, C.K., Lesher, C.E. & field parties<br />
2001: <strong>The</strong> East <strong>Greenland</strong> continental margin, the Prinsen<br />
af Wales Bjerge and new Skaergaard intrusion initiatives. Geology<br />
of <strong>Greenland</strong> Survey Bulletin 189, 83–98 (this volume).<br />
Nørgaard-Pedersen, N. 1992: Delta sequences and initial volcanism<br />
in the Paleocene Kangerdlussuaq basin, East <strong>Greenland</strong>.<br />
In: Brooks, C.K., Hoch, E. & Brantsen, A.K. (eds): Kangerdlugssuaq<br />
studies: processes at a continental rifted margin III.<br />
Proceedings from a meeting May 1992, 24–31. Copenhagen:<br />
Geological Institute, University of Copenhagen.<br />
Skogseid, J., Planke, S., Faleide, J.I., Pedersen, T., Eldholm, O. &<br />
Neverdal, F. 2000: NE Atlantic continental rifting and volcanic<br />
margin formation. In: Nøttvedt, A. et al. (eds): Dynamics of<br />
the Norwegian Margin. Geological Society Special Publication<br />
(London) 167, 295–326.<br />
Soper, N.J., Downie, C., Higgins, A.C. & Costa, L.I. 1976:<br />
Biostratigraphic ages of Tertiary basalts on the East <strong>Greenland</strong><br />
continental margin and their relationship to plate separation<br />
in the North-East Atlantic. Earth and Planetary Science Letters<br />
32, 149–157.<br />
Authors’ addresses<br />
M.L., M.B. & T.P., Geological Survey of Denmark and <strong>Greenland</strong>, Thoravej 8, DK-2400 Copenhagen NV, Denmark. E-mail: mil@geus.dk<br />
T.N., Norsk Hydro ASA, N-0246 Oslo, Norway.<br />
S.O., Norsk Hydro Research Center, P.O. Box 7190, N-5020 Bergen, Norway. Present address: Norsk Agip A/S, P.O. Box 101 Forus, N-<br />
4064 Stavanger, Norway.<br />
106
Vendian – Lower Ordovician stratigraphy of Ella Ø,<br />
North-East <strong>Greenland</strong>: new investigations<br />
Svend Stouge, Douglas W. Boyce, Jørgen Christiansen, David A.T. Harper and Ian Knight<br />
Field work on Ella Ø in summer 2000 formed part of<br />
an ongoing research project to investigate the development<br />
of the Laurentian margin facing the Iapetus<br />
Ocean in the early Palaeozoic (Fig. 1). <strong>The</strong> extensive<br />
study region includes the well-exposed strata extending<br />
along the present coastlines of western<br />
Newfoundland, Canada, North-West Ireland and North-<br />
West Scotland, North-East <strong>Greenland</strong> and Svalbard. It<br />
is hoped to establish both the architectural and chronostratigraphic<br />
continuity and variation of these now disparate<br />
parts of a once contiguous platform.<br />
Detailed lithostratigraphic studies of the uppermost<br />
Neoproterozoic (Vendian) – Lower Palaeozoic succession<br />
of North-East <strong>Greenland</strong> will provide the framework to<br />
underpin sedimentological and palaeogeographic interpretations<br />
as well as assist with diagenetic and detailed<br />
biostratigraphic studies. Geochemical data from isotopic<br />
analyses will support these studies. Detailed collection<br />
of macrofaunas (including trilobites, brachiopods<br />
and gastropods) and microfaunas (conodonts) should<br />
improve chronostratigraphic understanding.<br />
<strong>The</strong> 2000 results suggest that the existing lithostratigraphy<br />
will require revision. For example, studies<br />
of measured sections show that dolomitisation in much<br />
of the Cambrian carbonate succession has overprinted<br />
and obscured lithostratigraphic boundaries.<br />
Ella Ø study area<br />
Vendian and Cambro-Ordovician sediments are exposed<br />
in a broad N–S-trending belt of the fjord region of North-<br />
East <strong>Greenland</strong> between latitudes 71˚38′N and 74˚25′N<br />
(Fig. 2). On Ella Ø the Vendian Tillite Group overlies<br />
Sv<br />
North America<br />
lapetus axis<br />
<strong>Greenland</strong><br />
Nor th Atlantic spreadi ng axis<br />
N<br />
North Atlantic<br />
Africa<br />
Scandinavia<br />
S<br />
spreading<br />
I<br />
axis<br />
Thor<br />
axis<br />
Europe<br />
Fig. 1. Spreading axis of the North Atlantic Ocean compared with<br />
the position of the Early Palaeozoic Iapetus suture. Svalbard (Sv),<br />
Western Newfoundland (N), North-West Ireland (I), North-West<br />
Scotland (S) and <strong>Greenland</strong> are on the same side of the Iapetus<br />
axis. Modified from Williams (1987) and Berthelsen (1998).<br />
Geology of <strong>Greenland</strong> Survey Bulletin 189, 107–114 (2001) © GEUS, 2001<br />
107
▲<br />
▲<br />
▲<br />
27°<br />
21°<br />
Inland Ice<br />
<strong>Greenland</strong><br />
74°<br />
▲<br />
▲<br />
▲<br />
▲<br />
▲<br />
A<br />
Wollaston<br />
Forland<br />
74°<br />
▲<br />
▲<br />
▲<br />
100 km<br />
▲<br />
Ella Ø<br />
Kejser Franz<br />
Ymer Ø<br />
Joseph<br />
Traill Ø<br />
Fjord<br />
Bastionb ugt<br />
Bastionen<br />
1<br />
2<br />
▲<br />
3<br />
Solitærbugt<br />
Ella Ø<br />
Fimbulfjeld<br />
72°<br />
▲<br />
▲<br />
27°<br />
Kong Oscar Fjord<br />
Mestersvig<br />
21°<br />
Antiklinalbugt<br />
10 km<br />
POST-CALEDONIAN<br />
Tertiary igneous rocks<br />
East <strong>Greenland</strong> Basin:<br />
Carboniferous–Cretaceous<br />
sediments<br />
LATE TO POST-CALEDONIAN<br />
Devonian,<br />
continental sediments<br />
CALEDONIAN OROGENIC BELT<br />
Caledonian granites<br />
Neoproterozoic–Ordovician<br />
sediments<br />
Crystalline complexes<br />
(Archaean–Mesoproterozoic)<br />
ELLA Ø<br />
Devonian,<br />
continental sediments<br />
Ordovician,<br />
marine sediments<br />
Cambrian,<br />
fluviatile and marine sediments<br />
Vendian,<br />
tillites and marine sediments<br />
Riphean,<br />
marine sediments<br />
CALEDONIAN FORELAND<br />
Crystalline rocks,<br />
<strong>Greenland</strong> shield<br />
▲<br />
▲<br />
Thrust<br />
Fault/shear zone<br />
▲<br />
Base camp<br />
Measured sections<br />
Fig. 2. Locality map of southern North-East <strong>Greenland</strong> with simplified geology. A: Albert Heim Bjerge. <strong>The</strong> map of Ella Ø shows locations<br />
of the base camp (see Fig. 3) and the investigated sections. Geology modified from Poulsen & Rasmussen (1951), Cowie &<br />
Adams (1957) and Henriksen (1994).<br />
the Riphean Eleonore Bay Supergroup, while the<br />
Cambro-Ordovician succession is unconformably overlain<br />
by Devonian rocks. <strong>The</strong> pre-Devonian sediments<br />
are deformed by major Caledonian folds, the Bastion<br />
syncline and Kap Oswald anticline of Cowie & Adams<br />
(1957), associated with minor thrust and normal faults.<br />
A strong ridge-and-valley topography essentially reflects<br />
rock lithologies and structure with valleys associated with<br />
recessive units or minor low-angle faults. <strong>The</strong> highest<br />
elevation is Bastionen at 1367 m (Figs 2, 5).<br />
Field work was carried out from the scientific station<br />
at Solitærbugt established by Lauge Koch in 1931 (Fig.<br />
3), and focused on three sections exposed to the east,<br />
south and west (Fig. 2). <strong>The</strong> field party consisted of the<br />
five authors, responsible for stratigraphy, geochemistry,<br />
palaeontology and sedimentology. This report provides<br />
preliminary results, with field identifications of macrofossils,<br />
and documents well-developed microbialites<br />
(sensu Riding 1991) in the Ordovician sequence.<br />
Vendian<br />
Tillite Group<br />
<strong>The</strong> Vendian System in North-East <strong>Greenland</strong> is represented<br />
by the 800 m thick Tillite Group (Hambrey &<br />
Spencer 1987; Hambrey 1989; Herrington & Fairchild<br />
108
Fig. 3. <strong>The</strong> scientific station on Ella Ø<br />
used as base camp for the summer 2000<br />
field work (see Fig. 2 for location). <strong>The</strong><br />
outcrops behind the house are carbonates<br />
of the Riphean Eleonore Bay<br />
Supergroup, which also make up the<br />
mountains in the background.<br />
1989), which overlies disconformably the Eleonore Bay<br />
Supergroup (Sønderholm & Tirsgaard 1993; Tirsgaard<br />
& Sønderholm 1997). Of the five formations (Fig. 4),<br />
the upper Spiral Creek Formation was studied in detail.<br />
Spiral Creek Formation<br />
<strong>The</strong> Spiral Creek Formation, 25–55 m thick, comprises<br />
varicoloured siltstones interbedded with sandstones. <strong>The</strong><br />
depositional environment is interpreted as evaporitic<br />
non-marine (Fairchild 1989; Fairchild & Herrington 1989).<br />
<strong>The</strong> uppermost member of the formation – ‘unit e’<br />
of Cowie & Adams (1957) – is known only from Ella<br />
Ø, where it is well exposed in section 2 and in<br />
Antiklinalbugt (Fig. 2). It comprises 7–14 m of yellowweathering,<br />
fine-grained dolostones associated with<br />
black chert developed along bedding surfaces or as<br />
irregular lenses. A quartzitic conglomerate with rounded<br />
chert clasts occurs at the base, overlying a disconformity.<br />
Black dense dolomites are considered indicative<br />
of anoxic bottom conditions in a lagoonal setting. No<br />
fossils have been recorded, but a latest Proterozoic age<br />
can be presumed.<br />
Cambro-Ordovician<br />
<strong>The</strong> Lower Cambrian shelf succession on Ella Ø starts<br />
with dominantly clastic to mixed clastic-carbonates of the<br />
Kløftelv, Bastion and Ella Island Formations (Fig. 4).<br />
<strong>The</strong>se units, investigated at sections 1 and 2, record<br />
part of a transgressive–regressive sequence that also<br />
includes part of the overlying Cambrian to Lower<br />
Ordovician carbonate succession (Hyolithus Creek,<br />
Dolomite Point, Antiklinalbugt, Cape Weber and<br />
Narwhale Sound Formations; Fig. 4). Our observations<br />
ranged from the Kløftelv Formation to the Antiklinalbugt<br />
Formation. <strong>The</strong> Cape Weber and Narwhale Sound<br />
Formations were not studied in detail, while the uppermost<br />
unit in the succession (Heimbjerge Formation) is<br />
SYSTEM GROUP FORMATION<br />
Ordovician<br />
Cambrian<br />
Vendian<br />
Tillite<br />
Heimbjerge<br />
Narwhale Sound<br />
Cape Weber<br />
Antiklinalbugt<br />
Dolomite Point<br />
Hyolithus Creek<br />
Ella Island<br />
Bastion<br />
Kløftelv<br />
Spiral Creek<br />
Canyon<br />
Storeelv<br />
Arena<br />
Ulvesø<br />
Fig. 4. Stratigraphic nomenclature of the Vendian – Middle<br />
Ordovician sediments of North-East <strong>Greenland</strong>. Dashed line<br />
indicates that the exact location of the Cambrian–Ordovician<br />
boundary is poorly constrained.<br />
109
C<br />
SC<br />
K<br />
B<br />
C–O<br />
Fig. 5. Bastionen seen from the north; the nearest peaks left of centre are 1200 m above the terrain in the foreground. <strong>The</strong> dark-grey<br />
and yellow sediments at left form the Canyon Formation (C), which is overlain by yellow dolostones of the Spiral Creek Formation<br />
(SC). Reddish-coloured sediments are sandstones of the Kløftelv Formation (K), and the dark-green to grey recessive unit is the Bastion<br />
Formation (B). <strong>The</strong> succeeding thick-bedded rocks forming the steep cliffs of Bastionen are Cambrian and Lower Ordovician carbonates<br />
(C–O).<br />
not preserved on Ella Ø. <strong>The</strong> Cambro-Ordovician<br />
sequence is more than 2000 m thick (Cowie & Adams<br />
1957; Smith 1991; Smith & Bjerreskov 1994).<br />
Kløftelv Formation<br />
<strong>The</strong> Kløftelv Formation was measured in section 2 to<br />
be 70–75 m thick, and disconformably overlies ‘unit e’<br />
of the Spiral Creek Formation. <strong>The</strong> base of the formation<br />
is an erosional surface; an irregularly bedded, pebbly<br />
quartz arenite with rounded shale pebbles is<br />
succeeded by a vivid-red unit of interbedded shale and<br />
cross-bedded and cross-laminated, very fine to finegrained<br />
quartz arenite.<br />
<strong>The</strong> Kløftelv Formation is dominated by fine- to<br />
medium-grained, white to pale-pink and red quartz<br />
arenite, arranged in metre to decametre-scale sequences.<br />
Wedge-shaped trough cross-beds dominate. Herringbone<br />
cross-stratification is common and locally foresets are<br />
overturned below scours. Rare sinuous ripple-marks<br />
occur. Poor exposures precluded detailed palaeocurrent<br />
measurements, but those made suggest polymodal directions<br />
dominated by a southward flow, with subordinate<br />
flow directions to the north-east.<br />
<strong>The</strong> formation was probably laid down in a relatively<br />
high-energy, near shore to sandy shoreline setting.<br />
Trace fossils were noted by Hambrey & Spencer<br />
(1987), and an early Cambrian age is considered likely<br />
(Vidal 1979, fig. 4; Pickerill & Peel 1990, fig. 1).<br />
Bastion Formation<br />
<strong>The</strong> Bastion Formation, c. 140 m thick, is composed of<br />
glauconitic siltstone, shale, minor sandstone and calcareous<br />
sandstone. <strong>The</strong> formation crops out at high<br />
altitudes in the steep cliffs at Bastionbugt (Figs 2, 5)<br />
where the lower boundary is well exposed, and along<br />
the nearly vertical wall of Antiklinalbugt; at Solitærbugt<br />
minor exposures are easily accessible. Lower Cambrian<br />
fossils are common in the lower and middle parts of<br />
the formation (see e.g. Poulsen 1930; Cowie & Adams<br />
1957; Cowie & Spencer 1970; Pickerill & Peel 1990).<br />
Ella Island Formation<br />
This formation is 80 to 100 m thick (Cowie & Adams<br />
1957). In the lower part thin beds of laminated siltstone,<br />
commonly with trace fossils, are intercalated with<br />
shale at the base of metre-scale sequences, generally<br />
capped by a thick unit of medium-bedded calcareous<br />
siltstone and silty limestone. A few palaeocurrent measurements<br />
indicate south-eastward flow.<br />
<strong>The</strong> upper part of the formation is made up of thinbedded<br />
lime mudstone in 1–3 m thick sequences; these<br />
are intercalated with 20–70 cm thick beds of intraclastic<br />
skeletal grainstone, pebbly grainstone and rudstone.<br />
Vertical U-shaped or tubular burrows occur. <strong>The</strong> grainstone<br />
beds are rich in locally derived angular platy<br />
clasts of limestone (up to 10 cm) and locally dolostone.<br />
110
Salterella and trilobites such as Olenellus and<br />
Wanneria are common in some beds (Poulsen 1932)<br />
indicating the Bonnia-Olenellus zone, i.e. late Early<br />
Cambrian.<br />
Hyolithus Creek Formation<br />
<strong>The</strong> dolostones of the Hyolithus Creek Formation are<br />
145 m thick at Fimbulfjeld; at Antiklinalbugt the formation<br />
was measured at 210 m by Cowie & Adams (1957).<br />
Patches and beds of pale grey, very fine-grained<br />
limestone remain as vestiges in both the mound and<br />
laminated facies at the base of the dark dolostones<br />
forming the upper 48 m interval of the formation. This<br />
limestone-bearing interval appears to correlate with<br />
limestones noted by Cowie & Adams (1957) about 100<br />
m above the base of the dolostone at both Antiklinalbugt<br />
and in Albert Heim Bjerge suggesting that this may be<br />
a useful marker unit.<br />
<strong>The</strong> dolostones of the Hyolithus Creek Formation<br />
are barren of fossils but Salterella in the limestonebearing<br />
interval suggests the Bonnia-Olenellus Zone.<br />
Boundary between the Ella Island and<br />
Hyolithus Creek Formations<br />
From a conformable section in the east limb of the Kap<br />
Oswald anticline along the south-facing cliff wall at<br />
Antiklinalbugt, Cowie & Adams (1957) described the Ella<br />
Island Formation as comprising lower and upper limestone<br />
units separated by shale, and the Hyolithus Creek<br />
Formation as dark dolomite with minor limestone. Our<br />
logging on the same fold limb at sections 2 and 3 (Fig.<br />
2) on the west slopes of Fimbulfjeld indicates that Cowie<br />
& Adams’ (1957) boundary is a nearly stratiform dolomitisation<br />
front. A more natural boundary would be at the<br />
base of an underlying package of ribbon limestone and<br />
thinly bedded and bioturbated limestone. <strong>The</strong>se rocks<br />
are replaced upwards by the dolostones that define the<br />
Hyolithus Creek Formation of Cowie & Adams (1957).<br />
If parts or all of the upper limestone of Cowie & Adams<br />
(1957) are incorporated in the Hyolithus Creek<br />
Formation, the revised Ella Island Formation would be<br />
no more than 60 m thick on Ella Ø. Further work will<br />
be necessary to confirm this.<br />
Dolomite Point Formation<br />
<strong>The</strong> Dolomite Point Formation is 260 m thick at section<br />
3 on Fimbulfjeld (Fig. 2); Cowie & Adams (1957)<br />
recorded 330 m at Antiklinalbugt. It consists of grey<br />
microcrystalline dolostones, argillaceous dolostones<br />
and pale-grey and green-grey shale intercalated with two<br />
decimetre thick intervals of dark-grey sucrosic dolostone.<br />
<strong>The</strong> base of the formation is at the first continuous<br />
interval of light-grey, thin-bedded microcrystalline dolostone<br />
above the Hyolithus Creek Formation. <strong>The</strong> contact<br />
is not well exposed at section 3, but appears to be<br />
sharp and conformable. <strong>The</strong> topmost 20 m included by<br />
Cowie & Adams (1957) in the Dolomite Point Formation<br />
should probably be assigned to the overlying<br />
Antiklinalbugt Formation; this interval consists of sucrosic<br />
dolostones similar to the basal limestones of the<br />
Antiklinalbugt Formation.<br />
Six members are provisionally recognised, and will<br />
be described elsewhere. No body fossils are known, but<br />
burrow-mottling and thin tubular burrows (possibly<br />
Planolites) occur sporadically. <strong>The</strong> formation is younger<br />
than the uppermost Lower Cambrian Hyolithus Creek<br />
Formation and older than the lowermost Ordovician<br />
Antiklinalbugt Formation.<br />
Antiklinalbugt Formation<br />
<strong>The</strong> Antiklinalbugt Formation was introduced by Peel<br />
& Cowie (1979) to replace the Cass Fjord Formation of<br />
North-East <strong>Greenland</strong> as used by Poulsen (1930), Poulsen<br />
& Rasmussen (1951) and Cowie & Adams (1957). <strong>The</strong><br />
Cass Fjord Formation is now restricted to north-western<br />
<strong>Greenland</strong> (Henriksen & Peel 1976) and adjacent<br />
Canada (De Freitas & Mayr 1995).<br />
<strong>The</strong> Antiklinalbugt Formation, 235 m thick, consists<br />
of muddy, bioturbated carbonates of peritidal to subtidal<br />
aspect, and siltstones to shale interbedded with subtidal<br />
limestones. Planar to domal stromatolitic and<br />
thrombolite mounds become larger and more complex<br />
up-section. <strong>The</strong> carbonate sediments vary from dolostone<br />
to selectively dolomitised limestone to almost<br />
pure limestone. Three members are recognised (Cowie<br />
& Adams 1957).<br />
<strong>The</strong> microbial buildups (sensu Kennard & James<br />
1986; see Riding 1991) are composed of stromatoliticthrombolite-?sponges<br />
and cryptic microbialites. <strong>The</strong><br />
mounds range from single colonies to well-defined<br />
microbial constructions (Fig. 6), whose development<br />
appears to be associated with the progression of the<br />
basal lower Ordovician transgression. <strong>The</strong> succession<br />
culminates with prominent and complex thromboliticstromatolitic-?sponge<br />
microbial mounds (Fig. 7).<br />
<strong>The</strong> gastropod Sinuopea whittardi? Poulsen is the earliest<br />
fossil recovered; brachiopods and trilobites occur<br />
111
Fig. 6. Vertical cross-section of welldeveloped<br />
microbial mounds in the<br />
upper part of the lower member of the<br />
Ordovician Antiklinalbugt Formation.<br />
<strong>The</strong> mounds, 1.7 m high, are composed<br />
of thrombolites, stromatolites and minor<br />
lithid sponges, with grainstones between<br />
each buildup. <strong>The</strong> recessive middle<br />
member of the formation is seen in the<br />
upper part of the photograph. Section 3<br />
on Fimbulfjeld; hammer (centre) is 28 cm<br />
long.<br />
Fig. 7. <strong>The</strong> upper surface of the microbial<br />
mound in Fig. 6, showing the oval to<br />
rounded shape of the thrombolites.<br />
Fig. 8. Clusters of disarticulated shells of a<br />
finklenburgiid orthide brachiopod on an<br />
upper bedding surface from the middle<br />
member of the Antiklinalbugt Formation<br />
(section 3).<br />
112
in the upper part of the lower member. Trilobites and<br />
brachiopods, and occasionally orthide brachiopods<br />
(Fig. 8), occur in the middle member; Poulsen (1930)<br />
reported graptolites.<br />
Hystricurus armatus Poulsen and species of Symphysurina<br />
dominate the trilobite fauna. <strong>The</strong> presence of<br />
?Mannschreekia sp., Symphysurina woosteri Ulrich,<br />
Bellefontia sp. and Clelandia sp. indicate the Antiklinalbugt<br />
Formation is Early Canadian (Gasconadian)<br />
Symphysurina and Bellefontia-Xenopstegium zones<br />
(Lower Ordovician).<br />
<strong>The</strong> new fossil collections suggest that the boundary<br />
with the overlying Cape Weber Formation is a substantial<br />
hiatus; the basal beds of the latter formation<br />
contain ?Cyptendoceras sp. undet. indicating a Late<br />
Canadian (Jeffersonian) age. <strong>The</strong> lack of Middle Canadian<br />
macro-taxa (e.g. Diaphelasma, Bassleroceras, Lecanospira<br />
or Hillyardina) indicates a condensed sequence<br />
or major hiatus, a view in accordance with Poulsen<br />
(1930) and Poulsen & Rasmussen (1951), who suggested<br />
that much of the Lower Canadian and all of the<br />
Middle Canadian are not represented on Ella Ø.<br />
Summary<br />
<strong>The</strong> 2000 field work allows for the following interpretations.<br />
1. An erosional surface developed at the top of ‘unit e’<br />
of the Spiral Creek Formation on Ella Ø is overlain<br />
by the Kløftelv Formation. Northwards the former formation<br />
wedges out and the Kløftelv Formation rests<br />
on the Canyon Formation (Hambrey & Spencer 1987;<br />
Hambrey et al. 1989). This is indicative of a regional<br />
hiatus or disconformity at the base of the Kløftelv<br />
Formation, which conventionally is taken to be the<br />
base of the Cambrian in North-East <strong>Greenland</strong>.<br />
2. <strong>The</strong> Lower Cambrian Ella Island and Hyolithus Creek<br />
Formations comprise a shallowing-upward sequence<br />
of fine-grained siliciclastics and limestones conformably<br />
above the shales of the Bastion Formation.<br />
<strong>The</strong> present contact between the Ella Island and<br />
Hyolithus Creek Formations is conformable and coincides<br />
with a dolomitisation front; the upper limestones<br />
of the Ella Island Formation (sensu Cowie &<br />
Adams 1957) would be better placed in a revised<br />
Hyolithus Creek Formation. <strong>The</strong> successions separated<br />
by such a boundary would be predominantly<br />
siliciclastic below and carbonate above.<br />
3. <strong>The</strong> microbialite developments in the Antiklinalbugt<br />
Formation are characteristic for the Upper Cambrian<br />
to Lower Ordovician interval along the margins of<br />
Laurentia (Kennard & James 1986; Knight & James<br />
1988; De Freitas & Mayr 1995). Microbial mounds and<br />
buildups similar to those in the Antiklinalbugt<br />
Formation are also reported from time-equivalent<br />
beds, e.g. the Cape Clay Formation of north-western<br />
<strong>Greenland</strong> (Dawes et al. 2000) and Arctic Canada<br />
(De Freitas & Mayr 1995).<br />
4. <strong>The</strong> prominent hiatus recorded between the<br />
Antiklinalbugt and Cape Weber Formations corresponds<br />
to the Demingian Stage of the Canadian<br />
Series. An equivalent but less extensive hiatus is<br />
known elsewhere along the Iapetus margin in North<br />
America (Boyce 1989; James et al. 1989; Boyce &<br />
Stouge 1997) and is associated with an important<br />
faunal extinction event (Ji & Barnes 1993).<br />
Acknowledgements<br />
This is a contribution to the research project supported by the<br />
Danish Natural Science Research Council (Grant no. 9901696).<br />
<strong>The</strong> cooperation of the Geological Survey Division of the<br />
Government of Newfoundland and Labrador, Canada, the<br />
Geological Museum, Copenhagen, Denmark, and the Holbæk<br />
College of Education, Denmark, is gratefully acknowledged. We<br />
thank T.I. Hauge Andersson, Danish Polar Center, Copenhagen,<br />
for logistic support and the Danish Sirius Sledge Patrol personnel<br />
at Ella Ø for help and hospitality.<br />
References<br />
Berthelsen, A. 1998: <strong>The</strong> Tornquist Zone northwest of the<br />
Carpathians: an intraplate pseudosuture. GFF 120, 223–230.<br />
Stockholm: Geological Society of Sweden.<br />
Boyce, W.D. 1989: Early Ordovician trilobite faunas of the Boat<br />
Harbour and Catoche formations (St. George Group) in the<br />
Boat Harbour – Cape Norman area, Great northern Peninsula,<br />
western Newfoundland. Newfoundland Department of Mines<br />
and Energy, Geological Survey Branch, Report 89-3, 169 pp.<br />
Boyce, W.D. & Stouge, S. 1997: Trilobite and conodont biostratigraphy<br />
of the St. George Group, Eddies Cove West area,<br />
western Newfoundland. Newfoundland Department of Mines<br />
and Energy, Geological Survey Branch, Report 91-1, 183–200.<br />
Cowie, J.W. & Adams, P.J. 1957: <strong>The</strong> geology of the Cambro-<br />
Ordovician rocks of central East <strong>Greenland</strong>. Part I. Stratigraphy<br />
and structure. Meddelelser om Grønland 153(1), 193 pp.<br />
Cowie, J.W. & Spencer, A.M. 1970: Trace fossils from the Late<br />
Precambrian / Lower Cambrian of East <strong>Greenland</strong>. In: Crimes,<br />
T.P. & Harper, J.C. (eds): Trace fossils. Geological Journal<br />
113
Special Issue 3, 91–100. Liverpool, UK: Seel House Press.<br />
Dawes, P.R. et al. 2000: Kane Basin 1999: mapping, stratigraphic<br />
studies and economic assessment of Precambrian and Lower<br />
Palaeozoic provinces in north-western <strong>Greenland</strong>. Geology of<br />
<strong>Greenland</strong> Survey Bulletin 186, 11–28.<br />
De Freitas, T. & Mayr, U. 1995: Kilometre-scale microbial buildups<br />
in a rimmed carbonate platform succession, Arctic Canada: new<br />
insight on Lower Ordovician reef facies. Bulletin of Canadian<br />
Petroleum Geology 43(4), 407–432.<br />
Fairchild, I.J. 1989: Dolomitic stromatolite-bearing units with<br />
storm deposits from the Vendian of East <strong>Greenland</strong> and<br />
Scotland: a case of facies equivalence. In: Gayer, R.A. (ed.):<br />
<strong>The</strong> Caledonide geology of Scandinavia, 275–283. London:<br />
Graham & Trotman Ltd.<br />
Fairchild, I.J. & Herrington, P.M. 1989: A tempestite-stromatoliteevaporite<br />
association (late Vendian, East <strong>Greenland</strong>): a<br />
shoreface-lagoon model. Precambrian Research 43, 101–127.<br />
Hambrey, M.J. 1989: <strong>The</strong> Late Proterozoic sedimentary record of<br />
East <strong>Greenland</strong>: its place in understanding the evolution of the<br />
Caledonide Orogen. In: Gayer, R.A. (ed.): <strong>The</strong> Caledonide geology<br />
of Scandinavia, 257–262. London: Graham & Trotman Ltd.<br />
Hambrey, M.J. & Spencer, A.M. 1987: Late Precambrian glaciation<br />
of central East <strong>Greenland</strong>. Meddelelser om Grønland<br />
Geoscience 19, 50 pp.<br />
Hambrey, M.J., Peel, J.S. & Smith, M.P. 1989: Upper Proterozoic<br />
and Lower Palaeozoic strata in northern East <strong>Greenland</strong>.<br />
Rapport Grønlands Geologiske Undersøgelse 145, 103–108.<br />
Henriksen, N. 1994: Eastern North <strong>Greenland</strong> 1993–1995 – a new<br />
1: 500 000 mapping project. Rapport Grønlands Geologiske<br />
Undersøgelse 160, 47–51.<br />
Henriksen, N. & Peel, J.S. 1976: Cambrian – Early Ordovician stratigraphy<br />
in south-western Washington Land, western North<br />
<strong>Greenland</strong>. Rapport Grønlands Geologiske Undersøgelse 80,<br />
17–23.<br />
Herrington, P.M. & Fairchild, I.J. 1989: Carbonate shelf and slope<br />
facies evolution prior to Vendian glaciation, central East<br />
<strong>Greenland</strong>. In: Gayer, R.A. (ed.): <strong>The</strong> Caledonide geology of<br />
Scandinavia, 263–273. London: Graham & Trotman Ltd.<br />
James, N.P., Stevens, R.K., Barnes, C.R. & Knight, I. 1989: Evolution<br />
of a Lower Paleozoic continental margin carbonate platform,<br />
northern Canadian Appalachians. In: Crevelo, T. et al. (eds):<br />
Controls on carbonate platforms and basin development.<br />
Society of Economic Paleontologists and Mineralogists, Special<br />
Publication 44, 123–146.<br />
Ji, Z. & Barnes, C.R. 1993: A major conodont extinction event during<br />
the Early Ordovician within the Midcontinent Realm.<br />
Palaeogeography, Palaeoclimatology, Palaeoecology 194, 37–47.<br />
Kennard, J.M. & James, N.P. 1986: Thrombolites and stromatolites:<br />
two distinct types of microbial structures. Palaios 1(5),<br />
492–503.<br />
Knight, I. & James, N.P. 1988: Stratigraphy of the Lower and lower<br />
Middle Ordovician St. George Group, Western Newfoundland.<br />
Newfoundland Department of Mines and Energy, Geological<br />
Survey Branch, Report 88-4, 48 pp.<br />
Peel, J.S. & Cowie, J.W. 1979: New names for Ordovician formations<br />
in <strong>Greenland</strong>. In: Peel, J.S. (compiler): Lower Palaeozoic stratigraphy<br />
and palaeontology: shorter contributions. Rapport<br />
Grønlands Geologiske Undersøgelse 91, 117–124.<br />
Pickerill, R.K. & Peel, J.S. 1990: Trace fossils from the Lower<br />
Cambrian Bastion Formation of North-East <strong>Greenland</strong>. In:<br />
Peel, J.S. (ed.): Lower Cambrian trace fossils from <strong>Greenland</strong>.<br />
Rapport Grønlands Geologiske Undersøgelse 147, 5–43.<br />
Poulsen, C. 1930: Contributions to the stratigraphy of the Cambro-<br />
Ordovician of East <strong>Greenland</strong>. Meddelelser om Grønland<br />
74(12), 297–316.<br />
Poulsen, C. 1932: <strong>The</strong> Lower Cambrian faunas of East <strong>Greenland</strong>.<br />
Meddelelser om Grønland 87(6), 66 pp.<br />
Poulsen, C. & Rasmussen, H.W. 1951: Geological map (scale,<br />
1:50,000) and description of Ella Ø. Bulletin Grønlands<br />
Geologiske Undersøgelse 3, 25 pp. (also Meddelelser om<br />
Grønland 151,5).<br />
Riding, R. 1991: Classification of microbial carbonates. In: Riding,<br />
R. (ed.): Calcareous algae and stromatolites, 21–51. Berlin:<br />
Springer-Verlag.<br />
Smith, M.P. 1991: Early Ordovician conodonts of East and North<br />
<strong>Greenland</strong>. Meddelelser om Grønland Geoscience 26, 81 pp.<br />
Smith, M.P. & Bjerreskov, M. 1994: <strong>The</strong> Ordovician System in<br />
<strong>Greenland</strong>. Correlation chart and stratigraphic lexicon.<br />
International Union of Geological Sciences Special Publication<br />
29A, 46 pp.<br />
Sønderholm, M. & Tirsgaard, H. 1993: Lithostratigraphic framework<br />
of the Upper Proterozoic Eleonore Bay Supergroup of<br />
East and North-East <strong>Greenland</strong>. Bulletin Grønlands Geologiske<br />
Undersøgelse 167, 38 pp.<br />
Tirsgaard, H. & Sønderholm, M. 1997: Lithostratigraphy, sedimentary<br />
evolution and sequence stratigraphy of the Upper<br />
Proterozoic Lyell Land Group (Eleonore Bay Supergroup) of<br />
East and North-East <strong>Greenland</strong>. Geology of Greeenland Survey<br />
Bulletin 178, 60 pp.<br />
Vidal, G. 1979: Acritarchs from the Upper Proterozoic and Lower<br />
Cambrian of East <strong>Greenland</strong>. Bulletin Grønlands Geologiske<br />
Undersøgelse 134, 40 pp.<br />
Williams, H. 1987: Miogeoclines and suspect terranes in the<br />
Caledonian-Appalachian Orogen: tectonic patterns in the North<br />
Atlantic region. Canadian Journal of Earth Sciences 21, 887–901.<br />
Authors’ addresses<br />
S.S., Geological Survey of Denmark and <strong>Greenland</strong>, Thoravej 8, DK-2400 Copenhagen NV, Denmark. E-mail: ss@geus.dk<br />
D.W.B. & I.K., Government of Newfoundland and Labrador, Mines and Energy, Geological Survey Division, P.O. Box 8700, St. John’s,<br />
Newfoundland, Canada A1B 4J6.<br />
J.C., Holbæk College of Education, Seminarieparken 2, DK-4300 Holbæk, Denmark.<br />
D.A.T.H., Geological Museum, Øster Voldgade 5–7, DK-1350 Copenhagen K, Denmark.<br />
114
Periglacial processes in the Mestersvig region, central<br />
East <strong>Greenland</strong><br />
Naja Mikkelsen, Steve Carver, John Woodward and Hanne H. Christiansen<br />
<strong>The</strong> earliest thorough investigations of periglacial<br />
processes in <strong>Greenland</strong> were conducted from 1956–1961<br />
in the Mestersvig region (72°N 24´W) of central East<br />
<strong>Greenland</strong>, where a number of experimental sites were<br />
established by A.L. Washburn (Fig. 1; Washburn 1965,<br />
1967, 1969). Results from these investigations are still<br />
of relevance, and are quoted in recent periglacial literature<br />
(e.g. Ballantyne & Harris 1994; French 1996).<br />
During the field seasons of 1998 and 2000 a resurvey<br />
of Washburn’s original experimental sites was undertaken.<br />
<strong>The</strong> main purpose was to describe the state of<br />
preservation of the sites and to derive estimates of long-<br />
Canada<br />
<strong>Greenland</strong><br />
17<br />
500 km<br />
21<br />
20<br />
23<br />
22 24<br />
"Camp Tahoe" (221m)<br />
16<br />
7,8,15<br />
6<br />
Kong Oscar Fjord<br />
Government<br />
Station<br />
("Flyveplads")<br />
5<br />
4<br />
14<br />
2,3,9<br />
1,11,12<br />
Location of experimental sites<br />
in the Mestersvig District<br />
CONTOUR INTERVAL-10 metres<br />
0 1 2 3 km<br />
Fig. 1. Map of the Mestersvig region in central East <strong>Greenland</strong> reproduced from Washburn (1965, plate 5) with slight modifications.<br />
Locations shown as red blocks indicate the numbered experimental sites established by A.L. Washburn in 1956–1961. Place names<br />
on land areas of this map are in their original spelling, some of which are not in their approved modern form (correct spellings include<br />
Thyre Spids, Gorm Spids, Gåsesø and Rypesø). Mestersvig airport is here designated ‘Government Station (“Flyveplads”)’. On inset<br />
map the location of the Mestersvig region in central East <strong>Greenland</strong> is shown by the red rectangle.<br />
Geology of <strong>Greenland</strong> Survey Bulletin 189, 115–121 (2001) © GEUS, 2001<br />
115
Table 1. Site locations<br />
Site 1 As for Site 11<br />
Site 2<br />
72°14.738'N 23°50.229'W<br />
Site 3 25 m NE of Site 2<br />
Site 4<br />
72°14.642'N 23°51.200'W<br />
Site 5<br />
72°14.616'N 23°51.579'W<br />
Site 6<br />
72°14.942'N 23°57.029'W<br />
Site 7<br />
72°14.917'N 23°58.247'W<br />
Site 8<br />
72°14.945'N 23°58.187'W<br />
Site 9 30 m NW of Site 2<br />
Site 11 72°14.980'N 23°49.766'W<br />
Site 12 As for Site 11<br />
Site 14 72°14.956'N 23°49.848'W<br />
Site 15 72°14.976'N 23°58.089'W<br />
Site 16 72°15.035'N 23°58.261'W<br />
Site 17 72°12.991'N 24°08.183'W<br />
Site 20 72°13.103'N 24°03.506'W<br />
Site 21 72°13.107'N 24°03.617'W<br />
Site 22 72°13.361'N 24°03.075'W<br />
Site 23 72°13.071'N 24°03.205'W<br />
Site 24 72°13.468'N 24°03.127'W<br />
<strong>The</strong> geomorphological sites used for field experiments and<br />
observations in 1956–1961 (Washburn 1967). Site positions<br />
were measured in 2000 using a WGS-84 conversion for the<br />
GPS positioning system. Sites 10, 13, 18 and 19 were abandoned at<br />
an early stage of the field experiments (Washburn 1967).<br />
term (40+ years) rates of mass-wasting to compare with<br />
Washburn’s original short-term rates. <strong>The</strong> field work<br />
also assessed the possibility of re-establishing some of<br />
the original sites for inclusion in a new periglacial<br />
research programme in the Mestersvig region, aimed at<br />
monitoring the impact of long-term global change on<br />
the Arctic periglacial environment in a coastal area.<br />
Periglacial investigations in<br />
central East <strong>Greenland</strong><br />
<strong>The</strong> geomorphological investigations in the Mestersvig<br />
region by A.L. Washburn and coworkers included studies<br />
of frost creep and gelifluction, rock weathering and<br />
vegetation (Washburn 1965, 1967, 1969, 1973; Ugolini<br />
1966a, b; Raup 1969, 1971). During the study period<br />
(1956–1961) Washburn established 24 experimental sites<br />
in the vicinity of the Mestersvig airfield (Fig. 1; Table<br />
1). Each site was selected and designed to monitor<br />
periglacial processes, and to allow for comparative studies.<br />
Six of the sites (Sites 4, 5, 6, 7, 8, 17) were installed<br />
as experimental target lines, with the purpose of determining<br />
mass-wasting rates (Figs 2, 3). <strong>The</strong> observed<br />
rates of movement were subsequently related to parameters<br />
such as slope gradient, soil type, moisture and<br />
vegetation. <strong>The</strong>rmo-couples installed at Sites 6, 7 and<br />
8 enabled ongoing registration of soil temperatures at<br />
various depths. Ambient temperature and moisture conditions<br />
were measured at all sites, and recording weather<br />
instruments were maintained at Sites 7 and 8. Additional<br />
experiments at some sites were undertaken utilising<br />
mass-wasting strain and movement-metering devices,<br />
with varying success. At experimental Site 2 a strain<br />
gauge was installed to study possible pressure buildup<br />
in connection with the formation of polygons and<br />
patterned grounds. In addition one polygon structure<br />
(close to Site 20) was excavated in the late 1950s enabling<br />
detailed study of the cross-section of the polygon.<br />
A number of other sites were established with thin<br />
10 cm long dowel sticks (Fig. 4) placed in well-defined<br />
patterns to study small-scale movements within patterned<br />
grounds, polygonal soil features and solifluction<br />
lobes (Sites 14, 15, 20, 21). Other dowel-stick sites<br />
allowed observations of small-scale periglacial processes<br />
on the slopes of a weathering basalt section covered<br />
by talus products (Site 16). Three sites were used for<br />
observations on the rate of exfoliation and weathering<br />
of different types of rocks (Sites 22, 23, 24). At an early<br />
stage of the field programme, Sites 10, 13, 18 and 19<br />
were abandoned, as they were considered unsuitable<br />
for various reasons (Washburn 1967).<br />
Detailed climatic and meteorological data were collected<br />
in conjunction with Washburn’s geomorphological<br />
observations and experiments during the study<br />
period. <strong>The</strong> climate of the Mestersvig region is truly arctic<br />
with mean annual air temperature for the period<br />
1956–1961 ranging from –9.2°C to –10.6°C, and a mean<br />
annual precipitation of 372.5 mm mostly falling as snow<br />
(Washburn 1965). Despite its location north of the Arctic<br />
Circle, Mestersvig has relatively mild, though short,<br />
summers with maximum temperatures reaching as high<br />
as 20°C in July and August (Harpøth et al. 1986).<br />
However, minimum temperatures can fall well below<br />
0°C at any time during the summer season, and as such<br />
the soils in the area are clearly subject to marked<br />
freeze–thaw cycles.<br />
<strong>The</strong> Mestersvig region is located in a zone of continuous<br />
permafrost (Christiansen & Humlum 2000),<br />
which extends to a depth of up to 125 m, while the<br />
thickness of the active surface layer ranges from 0.5 m<br />
to 2 m (Washburn 1965). Ongoing periglacial research<br />
in other parts of <strong>Greenland</strong> includes nivation studies<br />
(Christiansen 1998) and monitoring of active layer<br />
dynamics (Christiansen 1999).<br />
116
Fig. 2. Close-up of target cone in mass-wasting target line at Site<br />
5 in the summer of 2000. <strong>The</strong> 10 cm high wooden cone mounted<br />
on a wooden peg was inserted into the ground in 1956.<br />
Field observations<br />
<strong>The</strong> original experimental target lines resurveyed in<br />
1998 and 2000 were easily identified in the field due<br />
to orange paint still being present on the target cones<br />
(Fig. 2). Of the six experimental mass-wasting lines,<br />
only Sites 4, 5 and 6 in the hills south and south-west<br />
of Nyhavn and Site 17 located on the east slope of the<br />
mountain Hesteskoen were found suitable for remeasurement<br />
(Fig. 1). Unfortunately, two important sites in<br />
the ‘Nyhavn Hills’ south and south-west of Nyhavn<br />
(Sites 7, 8) had been stripped of target cones by others<br />
and re-employed for later experiments. <strong>The</strong> dowelstick<br />
sites were difficult to locate due to weathering<br />
and dispersal of the tiny sticks (Fig. 4). <strong>The</strong> pressure<br />
gauge of Site 2 was still in place, but not functioning,<br />
and the excavated profile of the polygon close to Site<br />
20 was found to be partly slumped.<br />
During the resurvey, measurements of target movements<br />
were recorded relative and perpendicular to the<br />
original target line. Brief descriptions of the different<br />
types of experimental sites are presented below.<br />
Experimental mass-wasting (Sites 4, 5, 6, 17)<br />
Experimental Sites 4 and 5 are located at altitudes of<br />
approximately 10 m and 9 m, respectively, on the<br />
Labben peninsula (Fig. 1), on a 1° to 2° gently northward-sloping<br />
surface. <strong>The</strong> area is dry and dominated<br />
Fig. 3. <strong>The</strong> orange target cones of experimental Site 5 are still in<br />
line after 45 years of frost creep and gelifluction on the gently<br />
sloping hill at Labben. <strong>The</strong> pegs were originally inserted into the<br />
soil to the base of the 10 cm high cone and placed in a straight<br />
line perpendicular to the slope, with a spacing of approximately<br />
2 m. A theodolite placed at a fixed point at the end of each target<br />
line was employed to record target movements at regular intervals<br />
over four or five seasons.<br />
by non-sorted polygons in sandy-silty clay that is almost<br />
barren of vegetation. Site 4 was established in 1956<br />
with 30 target cones, of which 17 were considered in<br />
situ in 1998/2000, while at Site 5 a total of 21 of the<br />
original 27 target cones were considered to be in situ<br />
(Fig. 3). Preliminary estimates (by S.C.) indicate mean<br />
long-term movement rates of the order of 0.3 to 0.4<br />
cm/yr. <strong>The</strong> general low rates are presumably due to the<br />
dryness and shallow gradient of the slope. After installation<br />
of the experimental lines, Washburn subsequently<br />
117
Fig. 4. Experimental Site 9 originally instrumented with short dowel sticks 0.3 cm in diameter. <strong>The</strong> dowels were spaced at intervals<br />
of 10 or 20 cm at the beginning of the experiment and inserted to depths of 5 or 10 cm in lines or grid patterns (left). <strong>The</strong> original<br />
dowel patterns established in the late 1950s were found to be obliterated when revisited in 2000 (right), due to up-freezing by the<br />
intervening freeze–thaw cycles. Arrow indicates one of the uprooted dowel sticks.<br />
considered Sites 4 and 5 of limited value for detailed<br />
studies of mass-wasting, as the boulders selected for the<br />
theodolite stations were found to be subject to frost<br />
action. <strong>The</strong> target cones nevertheless provided important<br />
information on frost action such as heaving and tilting.<br />
Experimental Site 6 is located in a N–S-trending dell<br />
south-west of Nyhavn with a gradient of approximately<br />
3°. At the time of the 1998 and 2000 field work, a small<br />
stream traversed the valley, and the experimental area<br />
was well vegetated and characterised by wet conditions<br />
and by silty and clayey soils. Of the 43 cones<br />
installed in 1956, only 23 were considered to be in situ.<br />
Mean movement rates (estimated by S.C.) for the period<br />
1956–1998 were about 6 cm/yr and thus slightly higher<br />
than the average short-term rate of 4.9 cm/yr calcu-<br />
Fig. 5. Experimental Site 17 located on a gelifluction lobe on the southern slope of Hesteskoen at an altitude of 720 m. <strong>The</strong> periglacial<br />
processes at this site, which is characterised by high altitude, steep slope and wet conditions, are pronounced compared to drier sites<br />
at lower altitudes of the Mestersvig region. <strong>The</strong> two photographs from 5 August 1957 (left) and 22 July 2000 (right) show the impact<br />
of long-term periglacial processes, especially affecting the shape of the lobe front.<br />
118
Fig. 6. Weathering of a tholeiitic diabase boulder at Site 22. <strong>The</strong> photograph of the rock in 1960 (left) was taken before a linen sheet<br />
was placed under the rock to collect weathering products for quantitative calculations on granular disintegration. White ruler is 17<br />
cm long. <strong>The</strong> sheet had almost disintegrated by summer 2000 (right). It is evident from the two photographs taken 40 years apart<br />
that granular disintegration has been substantial in this arctic environment.<br />
lated for the period 1956–1961 by Washburn (1967). Soil<br />
moisture would appear to have a major influence on<br />
movement rates.<br />
Experimental Site 17 is located on a prominent<br />
gelifluction lobe at an altitude of 720 m on the east slope<br />
of Hesteskoen. <strong>The</strong> lobe has very sparse vegetation<br />
and is composed of stony diamicton and pebbles and<br />
cobbles in a clay-silt-sand matrix. <strong>The</strong> lobe is approximately<br />
30 × 20 m in size; the upper lobe surface slopes<br />
at 15° to 23°, while the 3 m high down-slope front<br />
exceeds 45°. <strong>The</strong> lobe was originally equipped with 15<br />
cones, of which 14 were found; however, all but three<br />
were toppled. Estimates of the average rates for longterm<br />
movement (by S.C.) were approximately 12 cm/yr,<br />
somewhat higher than the average short-term rate of<br />
7.7 cm/yr calculated for the period 1957–1959 by<br />
Washburn (1967).<br />
Comparisons of the outline and overall morphology<br />
of the gelifluction lobe on Hesteskoen in 1957 and 2000<br />
show pronounced changes due to periglacial processes,<br />
notably in the shape of the lobe front (Fig. 5).<br />
Rock weathering (Sites 22, 23, 24)<br />
Washburn (1969) established three sites in the vicinity<br />
of ‘Camp Tahoe’ (Fig. 1) at altitudes of c. 200 m to<br />
study weathering processes of different rock types and<br />
obtain quantitative data on granular disintegration.<br />
Originally, white linen sheets were placed at the base<br />
of the boulders to collect weathering products for quantitative<br />
estimates. Sites 22 and 23 are tholeiitic diabase<br />
boulders (Fig. 6) and Site 24 a granitic boulder. Washburn<br />
(1969) concluded that granular disintegration of rocks<br />
was more widespread in polar environments than was<br />
commonly realised. <strong>The</strong> original sheets were still in<br />
place in 2000, but unfortunately so fragmented that it<br />
was impossible to collect weathering products for determination<br />
of long-term rates to compare with the shortterm<br />
rates of Washburn (1969).<br />
Patterned ground and dowel sticks<br />
(Sites 14, 15, 16, 21)<br />
Mass-wasting and frost action on a variety of patterned<br />
ground forms were studied in detail at sites instrumented<br />
with wooden dowel sticks (Washburn 1969).<br />
<strong>The</strong> dowels are short sticks, 0.3 cm in diameter and commonly<br />
spaced at intervals of 10 or 20 cm at the experimental<br />
sites. <strong>The</strong>y were inserted to depths of 5 or 10<br />
cm in lines or grid patterns to record frost action and<br />
mass-wasting effects as measured with reference to<br />
strings or wires (Fig. 4). <strong>The</strong> original experiments showed<br />
that the maximum up-freezing that an object undergoes<br />
during a single freeze–thaw cycle is proportional<br />
to the effective object height, which is the vertical<br />
dimension of the buried portion frozen to, and therefore<br />
heaved with, the adjacent material (Washburn<br />
1965). At the resurvey in 2000 the original dowel stick<br />
patterns established in 1956 were completely obliterated<br />
as a consequence of more than 40 years of<br />
freeze–thaw cycles.<br />
119
Artic<br />
Temperature<br />
Trends<br />
(1966-1995)<br />
Annual Data<br />
+ 1.0<br />
Artic<br />
Temperature<br />
Trends<br />
(1966-1995)<br />
Winter Data<br />
+ 2.0<br />
+ 0.5<br />
+ 1.0<br />
0.0<br />
0.0<br />
- 0.5<br />
- 1.0<br />
- 1.0<br />
(°C per decade)<br />
- 2.0<br />
(°C per decade)<br />
Fig. 7. Observed trends of arctic winter mean temperature from 1966 to 1995. <strong>The</strong> mean temperatures in northern and north-eastern<br />
<strong>Greenland</strong> have warmed over the last three decades, whereas the temperatures in southern <strong>Greenland</strong> show a cooling. <strong>The</strong> general<br />
temperature increase in north-eastern <strong>Greenland</strong> is considered to have had an influence on freeze–thaw cycles and thus periglacial<br />
processes in the Mestersvig region. Reproduced from IASC (1999), based on Chapman & Walsh (1993).<br />
Preliminary results and possible<br />
effects of climate change<br />
Interpretation of data obtained during the 1998 and<br />
2000 resurvey is indicative of a number of problems<br />
related to the long time period elapsed between target<br />
line installation in the late 1950s and the remeasurements<br />
40+ years later. <strong>The</strong> main difficulty lies with determining<br />
which target cones have been moved solely by the<br />
processes of frost creep and gelifluction, and which<br />
have been subject to other forces, natural or otherwise.<br />
Surface wash, particularly on the wetter Sites 6 and 17,<br />
may account for some of the longer distances travelled<br />
by toppled target cones. Some cones may also have been<br />
tilted by strong winds or influenced by human or animal<br />
activity. For example, vehicle tracks can be seen<br />
traversing Site 5. Furthermore, the data collected in<br />
1998 and 2000 do not quantitatively distinguish between<br />
frost creep and gelifluction, but rather represent combined<br />
data on long-term mass-wasting rates for these<br />
sites.<br />
Despite uncertainties the resurvey of all mass-wasting<br />
sites in the Mestersvig region points to some general<br />
trends. Two resurveyed sites (Sites 4, 5), both<br />
characterised by shallow gradients and fairly dry terrain,<br />
displayed very low rates of movement. <strong>The</strong> longterm<br />
rates for two other sites (Sites 6, 17), each in<br />
steeper and notably wetter terrain, showed more rapid<br />
mass-wasting rates than the short-term rates recorded<br />
more than 40 years ago.<br />
<strong>The</strong> average global temperature has increased by c.<br />
0.6°C since 1860 (Houghton et al. 1996) with the warmest<br />
years in the late 1990s. This temperature increase is not<br />
uniform worldwide, and regional differences also occur<br />
in <strong>Greenland</strong> (Fig. 7). Thus the average winter temperature<br />
in <strong>South</strong>-West <strong>Greenland</strong> has decreased over<br />
the last 30 years, whereas the average temperature in<br />
central East <strong>Greenland</strong> has apparently increased by<br />
approximately 0.5°C per decade during the same period.<br />
Despite all uncertainties related to the remeasured data,<br />
it is notable that the preliminary long-term mass-wasting<br />
rates (40+ years) obtained from the 1998/2000 field<br />
work are slightly higher than the short-term rates (2–5<br />
years) obtained in the late 1950s for the wetter experimental<br />
sites with steeper slope gradients. This situation<br />
may, with some reservations, be interpreted in<br />
support of an increase in average mass-wasting rates<br />
linked to general global warming.<br />
<strong>The</strong> detailed records of periglacial processes and<br />
mass-wasting rates in the Mestersvig region by A.L.<br />
Washburn and coworkers, together with the detailed<br />
meteorological data, provide a unique data set. <strong>The</strong>se<br />
data are highly relevant to a possible new monitoring<br />
research programme and may provide insights into the<br />
longer term impact of global change on periglacial<br />
processes and on the vulnerable arctic environment.<br />
120
Acknowledgements<br />
<strong>The</strong> authors would like to thank the Danish Polar Center,<br />
Copenhagen, and the <strong>Greenland</strong> Home Rule Government, Nuuk,<br />
for facilitating the field work in the Mestersvig region. S.C. and<br />
J.W. acknowledge the support of the University of Leeds, UK, and<br />
the funding provided by the Royal Society of London for the<br />
field research in 1998. N.M. expresses her deep appreciation of<br />
the time spent in the field with Land Washburn in summer 2000.<br />
References<br />
Ballantyne, C.K. & Harris, C. 1994: <strong>The</strong> periglaciation of England,<br />
330 pp. Cambridge, UK: Cambridge University Press.<br />
Chapman, W.L. & Walsh, J.E. 1993: Recent varations of sea ice<br />
and air temperature in high latitudes. Bulletin American<br />
Meteorological Society 74, 33–47<br />
Christiansen, H.H. 1998: Nivation forms and processes in unconsolidated<br />
sediments, NE <strong>Greenland</strong>. Earth Surface Processes<br />
and Landforms 23, 751–760.<br />
Christiansen, H.H. 1999: Active layer monitoring in two <strong>Greenland</strong>ic<br />
permafrost areas: Zackenberg and Disko Island. Danish Journal<br />
of Geography 99, 117–121.<br />
Christiansen, H.H. & Humlum, O. 2000: Permafrost. In: Jakobsen,<br />
B.H. et al. (eds): Topografisk atlas Grønland. Atlas over<br />
Danmark Serie II 6, 32–35. København, Danmark: Det<br />
Kongelige Danske Geografiske Selskab / Kort & Matrikelstyrelsen.<br />
French, H.M. 1996: <strong>The</strong> periglacial environment, 2nd edition, 341<br />
pp. Harlow: Longman.<br />
Harpøth, O., Pedersen, J.L., Schønwandt, H.K. & Thomassen, B.<br />
1986: <strong>The</strong> mineral occurrences of central East <strong>Greenland</strong>.<br />
Meddelelser om Grønland Geoscience 17, 139 pp.<br />
Houghton, J.T., Meira Filho, L.G., Callander, B.A., Harris, N.,<br />
Kattenberg, A. & Maskell, K. (eds) 1996: Climate change 1995,<br />
the science of climate change, 572 pp. Cambridge, UK: Press<br />
Syndicate, University of Cambridge.<br />
IASC 1999: Impact of global climate change in the Arctic regions.<br />
Report from workshop on the impacts of global change, 25–26<br />
April 1999, 28 pp. Tromsø, Norway: Norwegian Polar Institute.<br />
Raup, H.M. 1969: Observations on the relation of vegetation to<br />
mass-wasting processes in the Mesters Vig district, Northeast<br />
<strong>Greenland</strong>. Meddelser om Grønland 176(6), 216 pp.<br />
Raup, H.M. 1971: <strong>The</strong> vegetational relations of weathering, frost<br />
action and patterned ground processes, in the Mesters Vig district,<br />
Northeast <strong>Greenland</strong>. Meddelelser om Grønland 194(1),<br />
92 pp.<br />
Ugolini, F.C. 1966a: Soils of the Mesters Vig district, Northeast<br />
<strong>Greenland</strong>. 1. <strong>The</strong> arctic brown and related soils. Meddelelser<br />
om Grønland 176(1), 22 pp.<br />
Ugolini, F.C. 1966b: Soils of the Mesters Vig district, Northeast<br />
<strong>Greenland</strong>. 2. Exclusive of arctic brown and podzol-like soils.<br />
Meddelelser om Grønland 176(2), 25 p.<br />
Washburn, A.L. 1965: Geomorphic and vegetational studies in the<br />
Mesters Vig district, Northeast <strong>Greenland</strong>. General introduction.<br />
Meddelelser om Grønland 166(1), 60 pp.<br />
Washburn, A.L. 1967: Instrumental observations of mass wasting<br />
in the Mesters Vig district, Northeast <strong>Greenland</strong>. Meddelelser<br />
om Grønland 166(4), 296 pp.<br />
Washburn, A.L. 1969: Weathering, frost action and patterned<br />
ground in the Mesters Vig district, Northeast <strong>Greenland</strong>:<br />
Meddelelser om Grønland 176(4), 303 pp.<br />
Washburn, A.L. 1973: Periglacial processes and environments,<br />
320 pp. London: Edward Arnold.<br />
Authors’ addresses<br />
N.M., Geological Survey of Denmark and <strong>Greenland</strong>, Thoravej 8, DK-2400 Copenhagen NV, Denmark. E-mail: nm@geus.dk<br />
S.C., School of Geography, University of Leeds, Leeds LS2 9JT, UK.<br />
J.W., Department of Geography and Earth Sciences, Brunel University, Uxbridge UB8 3PH, UK.<br />
H.H.C., Institute of Geography, University of Copenhagen, Øster Voldgade 10, DK-1350 Copenhagen K, Denmark.<br />
121
Projects MINEO and HyperGreen: airborne hyperspectral<br />
data acquisition in East <strong>Greenland</strong> for environmental<br />
monitoring and mineral exploration<br />
Tapani Tukiainen<br />
In remote sensing terminology the word ‘hyperspectral’<br />
is used to distinguish sensors with several tens or hundreds<br />
of bands from the traditional ‘multispectral’ sensors<br />
such as Landsat TM or Landsat MSS. <strong>The</strong> success<br />
of hyperspectral techniques relies on the detection of<br />
subtle variations in the spectral properties of one or more<br />
of the components being imaged. <strong>The</strong> advances of<br />
worldwide research and development in sensor technology<br />
to achieve higher signal to noise ratios, good<br />
operational stability and improved levels of spectral<br />
and radiometric calibration have provided the instrumental<br />
basis for the deployment of this advanced technique<br />
to a number of earth resource and environmental<br />
mapping and monitoring tasks. <strong>The</strong> analysis and interpretation<br />
of hyperspectral data are extensively based<br />
on the use of spectral libraries covering a wide range<br />
of inorganic and organic natural materials and comparison<br />
of data between different areas and sensor systems.<br />
Airborne hyperspectral data acquisition in <strong>Greenland</strong><br />
in the summer of 2000 was carried out as part of the<br />
project MINEO (monitoring the environmental impact<br />
of mining activities in Europe using advanced observation<br />
techniques). This is a collaborative venture by<br />
nine European research organisations and two mining<br />
companies, with financial support from the European<br />
Community, to operate a commercial, high-quality, airborne<br />
hyperspectral scanner system (Fig. 1) for acquisition<br />
of hyperspectral data from six mining areas in<br />
Europe and <strong>Greenland</strong> (Tukiainen 2000). <strong>The</strong> area of<br />
the former lead mine in Mestersvig in central East<br />
<strong>Greenland</strong> (72°N) was selected to represent arctic environmental<br />
aspects in the MINEO project. <strong>The</strong> objectives<br />
of MINEO are to assess the application of<br />
hyperspectral techniques for pollution detection and<br />
monitoring in a wide range of mining environments.<br />
<strong>The</strong> hyperspectral data acquisition mission in<br />
<strong>Greenland</strong> was extended to acquire data for project<br />
HyperGreen, a mineral exploration programme of the<br />
Geological Survey of Denmark and <strong>Greenland</strong> (GEUS),<br />
financed by the Bureau of Minerals and Petroleum,<br />
<strong>Greenland</strong>. <strong>The</strong> objectives of HyperGreen are to assess<br />
the applicability of high spectral resolution imaging<br />
spectroscopy as a mineral exploration tool. <strong>The</strong><br />
HyperGreen project also included a target flown for the<br />
National Environmental Research Institute, Denmark<br />
(DMU). <strong>The</strong> original survey targets of project HyperGreen<br />
were located in West <strong>Greenland</strong>, but were cancelled due<br />
to weather constraints and the limited availability of<br />
the HyMap system (Cocks et al. 1998). Six alternative<br />
areas in central East and North-East <strong>Greenland</strong> with a<br />
variety of known mineral occurrences (Harpøth et al.<br />
1986) and potential for new occurrences were therefore<br />
surveyed (Fig. 2).<br />
Airborne hyperspectral imaging<br />
system<br />
HyVista Corporation, Australia, was selected as the contractor<br />
for the airborne hyperspectral data acquisition.<br />
A Dornier 228 aircraft, operated by Deutsches Zentrum<br />
Fig. 1. HyMap TM imaging spectrometer installed on a Dornier<br />
228 aircraft.<br />
122<br />
Geology of <strong>Greenland</strong> Survey Bulletin 189, 122–126 (2001) © GEUS, 2001
Zackenberg<br />
24° 22° 20°<br />
Palaeogene intrusives<br />
Palaeogene extrusives<br />
<strong>Greenland</strong><br />
Cretaceous<br />
Clavering Ø<br />
73° 73°<br />
Jurassic<br />
Triassic<br />
26°<br />
Hudson Land<br />
Gauss<br />
Halvø<br />
Kejser Franz Joseph<br />
Hold<br />
with<br />
Hope<br />
Upper Permian<br />
Carboniferous<br />
Devonian<br />
Pre-Devonian<br />
Fjord<br />
Fault<br />
Ymer Ø<br />
Traill Ø<br />
Geographical<br />
Society Ø<br />
Kong Oscar Fjord<br />
72°<br />
Scoresby<br />
Land<br />
Kap Simpson<br />
Mestersvig<br />
Malmbjerg<br />
Wegener Halvø<br />
72°<br />
Canning Land<br />
Milne<br />
Land<br />
Jameson<br />
Land<br />
Constable Pynt<br />
100 km<br />
26°<br />
24°<br />
22°<br />
20°<br />
Fig. 2. Simplified geological map of central East and North-East <strong>Greenland</strong>. Modified from Stemmerik et al. (1997). <strong>The</strong> areas where<br />
airborne hyperspectral data were acquired are indicated by black frames.<br />
123
Table 1. Spatial and spectral characteristics<br />
of HyMap TM sensor<br />
VIS 450–890 nm 16 nm 30<br />
NIR 890–1350 nm 13 nm 32<br />
SWIR1 1400–1800 nm 12 nm 32<br />
SWIR2 1950–2480 nm 16 nm 32<br />
mr = milliradian<br />
nm = nanometre<br />
Spatial configuration<br />
Instant field of view (IFOV) 2.5 mr along track<br />
2.0 mr across track<br />
Field of view (FOV)<br />
60 degrees (512 pixels)<br />
Swath 2.3 km at 5 m IFOV (along track)<br />
4.6 km at 10 m IFOV (along track)<br />
Spectral configuration<br />
Module Spectral range Average spectral Number<br />
sampling interval of bands<br />
für Luft und Raumfart, e.V., Germany, provided the<br />
platform for the HyMap hyperspectral imaging spectrometer<br />
(Fig. 2) and a Zeiss RMK A 15/23 aerial camera;<br />
the latter was used for simultaneous aerial<br />
photography to obtain stereoscopic coverage for the production<br />
of digital terrain models.<br />
<strong>The</strong> HyMap hyperspectral scanner manufactured<br />
by Integrated Spectronics Pty Ltd., Australia, has four<br />
spectrometers covering the interval from 450 to 2450<br />
nanometres (nm), excluding the two major water absorption<br />
windows (Table 1; Cocks et al. 1998). <strong>The</strong> sensor<br />
operates in a 3-axis gyro-stabilised platform to minimise<br />
image distortion due to aircraft motion. <strong>The</strong> signal/noise<br />
ratio measured outside the aircraft with a sun<br />
angle of 30° and 50% reflectance standard is more than<br />
500/1, except near the major atmospheric water absorption<br />
bands.<br />
Geo-location (longitude, latitude and altitude) and<br />
scanner attitude (roll, pitch and true heading) data to<br />
provide the necessary information for image geo-coding<br />
were acquired with a differential GPS satellite navigation<br />
system (DGPS) and an integrated inertial<br />
monitoring unit. <strong>The</strong> scanner operations required that<br />
the three detectors for the near infrared (NIR) and shortwave<br />
infrared region (SWIR1, SWIR2) had to be cooled<br />
to 77°K using liquid nitrogen. Approximately ten litres<br />
of liquid nitrogen were consumed for each full day of<br />
data collection.<br />
Table 2. Summary of hyperspectral data acquisition<br />
programme in central East and North-East <strong>Greenland</strong><br />
Survey area Project Number of Line<br />
flight lines km<br />
Canning Land HyperGreen 5 165<br />
Mestersvig MINEO 10 197<br />
Malmbjerg HyperGreen 15 695<br />
Ymer Ø HyperGreen 6 186<br />
Hudson Land HyperGreen 5 232<br />
Clavering Ø HyperGreen 1 25<br />
Zackenberg DMU/HyperGreen 12 360<br />
Kap Simpson HyperGreen 2 64<br />
Survey areas<br />
Flight operations in <strong>Greenland</strong> in 2000 commenced on<br />
5 August and were completed on 11 August. Eight target<br />
areas reached from airfields at Mestersvig and<br />
Constable Pynt (Fig. 2; Table 2) were surveyed with the<br />
following survey specifications:<br />
IFOV (‘pixel size’)<br />
5 m<br />
Overlap per line 20%<br />
Approximate ground speed 150 knots (277 km/h)<br />
For the HyMap instrument the instant field of view<br />
(IFOV) of 5 m corresponds to a flight altitude of 2500<br />
m (8200 ft) at which the scanner’s swath width (the area<br />
to be imaged across the flight track) is approximately<br />
2.3 km (Fig. 3). For the more mountainous areas, the<br />
flight altitude was determined from the local topographic<br />
baselevel.<br />
Data processing and analysis<br />
By the end of the year 2000 the contractor had delivered<br />
flight line radiance data (‘at sensor radiance’),<br />
spectral and radiometric calibration data for the HyMap<br />
sensor and the geo-location and scanner attitude data.<br />
<strong>The</strong> data will be subjected to atmospheric and geometric<br />
corrections to provide the basis for detailed<br />
analysis. <strong>The</strong> final processing of the data to extract<br />
spectral end members (‘mineral mapping’, vegetation<br />
types and vegetation stress) and map their locations<br />
and abundances will be based on advanced algorithms<br />
developed for the analysis of hyperspectral data (Goetz<br />
et al. 1985; Boardman & Kruse 1994).<br />
124
<strong>The</strong> large volume and complexity of the data generated<br />
by the hyperspectral sensors mean that the classification<br />
techniques to analyse the multispectral data,<br />
based on euclidean distance between groups of data<br />
(classes), are computationally cumbersome. A variety<br />
of interpretation techniques have therefore been developed<br />
in the last ten years. <strong>The</strong> most popular of these<br />
is the selection of ‘end members’ from hyperspectral data.<br />
This technique is based on the assumption that the<br />
imagery is composed of mixed pixels (‘mixels’), each<br />
pixel resulting from an integrated measurement over a<br />
multicomponent pixel to form a composite spectrum.<br />
A composite spectrum is formed by linear combinations<br />
of individual spectra (‘pure’ or single component spectra).<br />
<strong>The</strong> extraction of spectral end members will be<br />
undertaken using a variety of ‘spectral unmixing’ algorithms.<br />
Conclusions and outline of<br />
future work<br />
High-quality airborne hyperspectral data totalling 1924<br />
line km were acquired from eight localities in central<br />
East and North-East <strong>Greenland</strong>, using an advanced<br />
hyperspectral imaging spectrometer with 126 narrow<br />
bands covering the spectral range from 450 nm to 2480<br />
nm. <strong>The</strong> hyperspectral data will be used to assess the<br />
application of hyperspectral techniques to environmental<br />
monitoring and mineral exploration.<br />
Field follow-up will be carried out for both MINEO<br />
and HyperGreen projects in the summer of 2001, and<br />
will be concentrated on selected areas considered representative<br />
for the assessment of the objectives of the<br />
two projects.<br />
An international team from the MINEO consortium<br />
will undertake follow-up and baseline studies on environmental<br />
indications emerging from the processing of<br />
the MINEO data by GEUS and the MINEO partners. <strong>The</strong><br />
final results and conclusions will be included in the<br />
final report of the MINEO project which is planned for<br />
the end of 2002.<br />
Fig. 3. False colour ‘quicklook’ of HyMapTM data from a flight<br />
line at the west edge of the Mestersvig survey block. <strong>The</strong> striped<br />
lithologies are sediments of the Neoproterozoic Eleonore Bay<br />
Supergroup. Bright red colours are vegetation-rich areas. <strong>The</strong><br />
N–S strip (top to bottom) covered by the flight line is about 2.3<br />
km wide.<br />
125
For the HyperGreen project, the known mineral occurrences,<br />
some associated with spectacular hydrothermal<br />
alteration hosted by a wide range of igneous and sedimentary<br />
lithologies (e.g. Malmbjerg molybdenum<br />
deposit, Fig. 2), will provide a good reference base for<br />
the evaluation and assessment of hyperspectral data<br />
processing techniques in mineral exploration and geological<br />
mapping in arctic environments.<br />
It is expected that the statistical treatment of the<br />
HyperGreen data by GEUS will locate new targets with<br />
mineralogical characteristics (in terms of specific rock<br />
alteration phenomena or direct detection of ore minerals)<br />
related to the presence of potentially economically<br />
interesting mineral occurrences.<br />
In order to assess the discriminative power of this<br />
novel technique, follow-up ground spectroradiometric<br />
measurements will be carried out on known and new<br />
targets. <strong>The</strong>se will be chosen to represent a wide range<br />
of mineralisation types and rock lithologies. <strong>The</strong> results<br />
of this work are expected to be available during 2002.<br />
References<br />
Boardman, J.W. & Kruse, F.A. 1994: Automated spectral analysis:<br />
a geological example using AVIRIS data, northern Grapeville<br />
Mountains, Nevada. Tenth <strong>The</strong>matic conference, Geological<br />
Remote Sensing, 9–12 May 1994, San Antonio, Texas,<br />
Environmental Research Institute of Michigan (ERIM), Ann<br />
Arbor, MI. Proceedings, 407 p. & 418 p.<br />
Cocks, T., Jenssen, R., Stewart, A., Wilson, I. & Shields, T. 1998:<br />
<strong>The</strong> HyMap airborne hyperspectral sensor: the system, calibration<br />
and performance, 7 pp. Unpublished report, Integrated<br />
Spectronics Pty Ltd, Baulkham Hills, NSW, Australia.<br />
Goetz, A.F.H., Vane, G., Solomon, J.E. & Rock, B.N. 1985: Imaging<br />
spectrometry for earth remote sensing. Science 228, 1147–1153.<br />
Harpøth, O., Pedersen, J.L., Schønwandt, H.K. & Thomassen, B.<br />
1986: <strong>The</strong> mineral occurrences of central East <strong>Greenland</strong>.<br />
Meddelelser om Grønland Geoscience 17, 139 pp.<br />
Stemmerik, L., Clausen, O.R., Korstgård, J., Larsen, M., Piasecki,<br />
S., Seidler, L., Surlyk, F. & <strong>The</strong>rkelsen, J. 1997: Petroleum geological<br />
investigations in East <strong>Greenland</strong>: project ‘Resources of<br />
the sedimentary basins of North and East <strong>Greenland</strong>’. Geology<br />
of <strong>Greenland</strong> Survey Bulletin 176, 29–38.<br />
Tukiainen, T. 2000: Assessing and monitoring the environmental<br />
impact of mining activities in Europe using advanced Earth<br />
observation techniques. Danmarks og Grønlands Geologiske<br />
Undersøgelse Rapport 2000/104, 24 pp.<br />
Author’s address<br />
Geological Survey of Denmark and <strong>Greenland</strong>, Thoravej 8, DK-2400 Copenhagen NV, Denmark. E-mail: tt@geus.dk<br />
126
Studies of sea-ice conditions north of <strong>Greenland</strong>: results<br />
from a pilot GRASP initiative on the extension of territorial<br />
limits into the Arctic Ocean<br />
Naja Mikkelsen, Preben Gudmandsen and René Forsberg<br />
<strong>The</strong> continental shelf and Arctic Ocean north of<br />
<strong>Greenland</strong> are located in one of the least investigated<br />
regions of the Arctic. Even basic data on bathymetry<br />
are known only in rudimentary form from historical<br />
expeditions, a few scientific ice-floe stations and icebreaker<br />
traverses, and from rare United States and<br />
Russian map compilations. No official Danish nautical<br />
charts of the region exist, and it is only within the last<br />
20 years that the coastline of North <strong>Greenland</strong> facing<br />
the Arctic Ocean has been precisely mapped.<br />
Interest in the region has increased in recent years<br />
through major international efforts such as scientific<br />
submarine expeditions (SCICEX), major airborne geophysical<br />
surveys and the release and compilation of<br />
formerly classified oceanographic, hydrographic and<br />
climate-related data. Analyses of data from the submarine<br />
cruises have indicated a thinning of the polar seaice<br />
cover (Rothrock et al. 1999).<br />
Another reason for interest in the Arctic Ocean is<br />
the possibility for nations bordering the Arctic Ocean<br />
to claim an extension of their territorial limits beyond<br />
200 nautical miles (nm) as a consequence of the UN<br />
Laws of the Sea Convention (United Nations 1993).<br />
Danish research activities in the Arctic Ocean north<br />
of <strong>Greenland</strong> have been restricted to participation in a<br />
few international ice-floe scientific stations or ice-breaker<br />
expeditions, and recently in airborne geophysical surveys.<br />
However, airborne measurements can only address<br />
a limited number of scientific questions and a broader<br />
research effort north of <strong>Greenland</strong> to gain information<br />
on this poorly known region is therefore needed.<br />
Any Danish/<strong>Greenland</strong>ic claim for an extension into<br />
the Arctic Ocean of the current 200 nm territorial limit<br />
must be supported by basic data sets on hydrography<br />
and geology, and in this context the Commission for<br />
Scientific Research in <strong>Greenland</strong> initiated in 1998 a dis-<br />
Canada<br />
60° 50° 40° 30° 20° 10°<br />
<strong>Greenland</strong><br />
Arctic Ocean<br />
85°12'N 26°W<br />
84°54'N 16°W<br />
500 km<br />
84°42'N 29°W<br />
84°<br />
100 km<br />
84°00'N 19°W<br />
Fig. 1. Map of northernmost <strong>Greenland</strong> and<br />
adjacent Arctic Ocean with the two flight<br />
lines from 7 March 2000 shown in red, and<br />
the Radarsat scenes acquired on 6 and 12<br />
March 2000 shown in dark blue and light<br />
blue, respectively.<br />
Nyeboe<br />
Land<br />
Lincoln Sea<br />
Peary Land<br />
Wandel Sea<br />
82°<br />
Geology of <strong>Greenland</strong> Survey Bulletin 189, 127–131 (2001) © GEUS, 2001<br />
127
0°<br />
84°<br />
90°<br />
83°<br />
80°<br />
82°<br />
81°<br />
70°<br />
80°<br />
Ellesmere<br />
Island<br />
0° 85° 90° 80° 70° 60° 50° 40° 30° 20° 10° 0° 10° 20° 85°<br />
0 300 km<br />
Canada<br />
200<br />
1000<br />
Nyeboe<br />
Land<br />
2000<br />
Lincoln<br />
Sea<br />
200<br />
Inland Ice<br />
Lomonosov<br />
Ridge<br />
2004<br />
1000<br />
500<br />
?<br />
2000<br />
3000<br />
2003<br />
Peary<br />
200<br />
4000<br />
Land<br />
Amundsen<br />
Basin<br />
Morris<br />
Jesup<br />
Rise<br />
2002<br />
Wandel<br />
Sea<br />
Nansen Ridge<br />
Station<br />
Nord<br />
3000<br />
3000<br />
Ob<br />
Bank<br />
Nansen<br />
Basin<br />
<strong>Greenland</strong><br />
Sea<br />
60° 80°<br />
50° 40° 30° 20° 10°<br />
Yermak<br />
Plateau<br />
1000<br />
LenaTrough<br />
3000<br />
2000<br />
<strong>Greenland</strong><br />
Fig. 2. North <strong>Greenland</strong> continental margin with main physiographic regions (Lincoln Sea, Morris Jesup Rise, Wandel Sea) shown in<br />
blue tones. Modified from Dawes (1990). Location of the ice-drift camps proposed by GRASP for 2002, 2003 and 2004 are shown by<br />
black dots in the framed areas. Bathymetric contours are in metres.<br />
Canada<br />
500 km<br />
10°<br />
81°<br />
80°<br />
0°<br />
79°<br />
cussion on the scientific exploration of the region. A<br />
science plan was drafted in response (Forsberg et al.<br />
1999) and a project, the <strong>Greenland</strong> Arctic Shelf Project<br />
(GRASP), was proposed.<br />
This paper summarises results from a pilot GRASP<br />
initiative with airborne and satellite observations of seaice<br />
conditions north of <strong>Greenland</strong> in order to investigate<br />
the feasibility of establishing ice-floe camps (Fig.<br />
1). <strong>The</strong>se camps will collect a wide array of scientific<br />
data including data relevant to a possible claim with<br />
respect to territorial limits north of <strong>Greenland</strong>.<br />
aseismic bathymetric feature of probably mixed oceanic<br />
and continental origin (Dawes 1990), while the Wandel<br />
Sea is characterised by a seismically active and unusually<br />
narrow continental shelf margin. Geological information<br />
on these pronounced morphological features is<br />
very sparse, as is information on hydrography and shelf<br />
configuration. Morris Jesup Rise is of special interest as<br />
it extends far north into the Arctic Ocean and may<br />
therefore play an important role in future discussions<br />
on territorial boundaries.<br />
Geological setting<br />
<strong>The</strong> main physiographic and geological features include<br />
the Lincoln Sea shelf, Morris Jesup Rise and the Wandel<br />
Sea Basin, as well as the deeper ocean basins north and<br />
north-east of these features (Fig. 2). <strong>The</strong> Lincoln Sea shelf<br />
represents a little-known but seismically active sedimentary<br />
basin of Palaeozoic and Mesozoic–Cenozoic<br />
strata (Dawes & Peel 1981). Morris Jesup Rise is an<br />
GRASP objectives<br />
In order to meet the challenge of both the scientific and<br />
potential political interests in the Arctic Ocean north of<br />
<strong>Greenland</strong> (Taagholt & Hansen 2001), the GRASP science<br />
plan suggests acquisition of data on bathymetry,<br />
shelf slope, geology, geophysics, oceanography and<br />
sea ice (Forsberg et al. 1999). Oceanographic depth<br />
data and geological data on sediment distribution and<br />
thickness are of particular importance. <strong>The</strong> science plan<br />
128
0 100 km<br />
50°W<br />
86°N<br />
45° W<br />
LS<br />
85°N<br />
40°W<br />
35°W<br />
83°N<br />
30°W<br />
FH<br />
25°W<br />
20°W<br />
15°W<br />
84°N<br />
Fig. 3. Radarsat scene acquired on 6 March 2000 showing an area of the sea-ice covered Arctic Ocean measuring 500 × 500 km. Northernmost<br />
<strong>Greenland</strong> (Peary Land) with Frederick E. Hyde Fjord (FH) marked. An E–W-trending feature in the sea-ice along latitude 84°N indicates<br />
the boundary between the faster moving ice of the main central Arctic Ocean gyre and the stationary or slow moving sea ice of<br />
the Lincoln Sea region (LS). <strong>The</strong> C-130 flight lines from 7 March 2000 are indicated in red over Morris Jesup Rise.<br />
proposes that data acquisition be undertaken from floating<br />
ice camps deployed above the 2000–2500 m waterdepth<br />
contour (Fig. 2), and supported by helicopter<br />
and Twin Otter aircraft. This operation would allow<br />
collection of data covering crucial parts of the shelf<br />
region from the Wandel Sea in the east to the Lincoln<br />
Sea in the west, with special emphasis on Morris Jesup<br />
Rise. <strong>The</strong> ice stations are planned to be deployed in<br />
March or April 2002, 2003 and 2004, allowing at least<br />
a one-month operation period before the summer melt.<br />
Of particular scientific interest is the present-day thinning<br />
of the Arctic Ocean sea-ice cover detected from submarine<br />
investigations (Johannessen et al. 1999; Rothrock<br />
et al. 1999; Wadhams & Davis 2000); data indicates a thinning<br />
of 30 to 40% from the 1970s to the 1990s. A continued<br />
future decrease in ice thickness is of importance<br />
for global commerce and shipping, and not least for possible<br />
effects on the fragile Arctic ecological systems.<br />
Airborne observations March 2000<br />
A reconnaissance flight in March 2000 north of <strong>Greenland</strong><br />
was the first field campaign of the GRASP initiative.<br />
<strong>The</strong> purpose of the flight was to study the sea-ice conditions<br />
that may be encountered when the planned ice<br />
129
stations are operated. <strong>The</strong> observations from the air<br />
facilitated interpretation of satellite images acquired in<br />
the same period.<br />
<strong>The</strong> aerial reconnaissance was made on 7 March<br />
from a C-130 aircraft of the Royal Danish Air Force on<br />
a supply mission to Station Nord. Two flight lines were<br />
undertaken crossing Morris Jesup Rise, close to the<br />
location of the first ice camp planned for 2002 (Figs 1,<br />
2). Digital video observations were made from the flight<br />
deck and photographs taken with a hand-held camera<br />
at regular intervals. <strong>The</strong> weather conditions were not<br />
optimal for the mission, as fog and haze partly covered<br />
the region, but the data acquired and subsequent studies<br />
have provided relevant information for future GRASP<br />
initiatives.<br />
It was evident from the observations that the sea-ice<br />
cover over Morris Jesup Rise was irregular. Large areas<br />
of multi-year ice were intersected by leads with newly<br />
formed ice, and in some cases open water appeared in<br />
leads of 50–75 m width. Some of the major ice floes,<br />
with a size of several square kilometres, appeared from<br />
the air to be infiltrated by seawater beneath the snow<br />
cover.<br />
Satellite observations<br />
Observations from the flight reconnaissance were compared<br />
with data from satellite scenes acquired on 6 and<br />
12 March 2000 by the Canadian satellite Radarsat (Fig.<br />
1). <strong>The</strong> satellite scenes covered a wide region, including<br />
the area of the flight lines together with the area to<br />
the north-west that constitutes the source of sea ice transported<br />
over Morris Jesup Rise by the Transpolar Current.<br />
Data from the radar scenes and aerial observations complement<br />
each other. It appears from the radar scenes<br />
that many large floes of multi-year ice were interspersed<br />
by leads that were covered by newly formed ice (Fig. 3)<br />
under the influence of the prevailing low temperatures.<br />
<strong>The</strong> patterns of wide and large ice-covered leads north<br />
and east of Morris Jesup Rise changed very little between<br />
6 and 12 March, indicating that they had been formed<br />
in a period prior to the flight. Based on displacements<br />
of ice features recognised in the two radar scenes, a drift<br />
velocity of 2 km/day towards 110° was determined, a<br />
direction almost parallel to the North <strong>Greenland</strong> coast.<br />
<strong>The</strong>re appeared to be a slight compression of the icecoated<br />
leads in the six-day period between the two<br />
radar acquisitions.<br />
Ice patterns and the refrozen leads observed from<br />
the aircraft and captured by the photographs were compared<br />
with features seen on the radar scenes. Radar<br />
waves penetrate the snow cover of the floes and show<br />
the ice-surface conditions, whereas the visual observations<br />
show the snow surface. However, with a spatial<br />
resolution of only 100 m, the radar scenes did not<br />
reveal the narrow leads and ice ridges observed from<br />
the aircraft. Airborne observations are therefore required<br />
in conjunction with Radarsat data when planning the<br />
position of future ice camps.<br />
<strong>The</strong>se preliminary data, together with satellite data<br />
from previous years, show that in order for a scientific<br />
sea-ice station to pass over the centre of Morris Jesup<br />
Rise while collecting data, the station should be deployed<br />
at about 85°N 24´W, and would need about two months<br />
to drift across the Morris Jesup Rise.<br />
Conclusions<br />
Analyses of Radarsat images and airborne observations<br />
of ice conditions north of <strong>Greenland</strong> have provided a<br />
set of preliminary data on ice conditions and ice dynamics<br />
which is important for the planning of future GRASP<br />
initiatives and ice camps. Additional aerial observations<br />
and remote sensing studies will be undertaken in 2001<br />
to obtain a firmer impression of the sea-ice conditions.<br />
<strong>The</strong>se will be planned to show any systematic variation<br />
of ice conditions, and they may also add valuable<br />
information to the ongoing discussion of global climate<br />
change. Data obtained from ERS satellites from the<br />
period 1991–2000 will be analysed with this in mind.<br />
Acknowledgements<br />
<strong>The</strong> Danish Defence Command is thanked for generously providing<br />
the opportunity to make the C-130 flight over Morris Jesup<br />
Rise, and Major J. Hellgren and the aircraft crew for support during<br />
the flight. We thank Wolfgang Dierking, Technical University<br />
of Denmark, Lyngby, and R.S. Gill, Danish Meteorological Institute,<br />
Copenhagen, for assistance in processing the Radarsat data. We<br />
also express our gratitude to the Commission for Scientific Research<br />
in <strong>Greenland</strong>, Copenhagen, for supporting GRASP in general and<br />
providing travel support to N.M. during her participation in the<br />
mission over Morris Jesup Rise.<br />
References<br />
Dawes, P.R. 1990: <strong>The</strong> North <strong>Greenland</strong> continental margin. In:<br />
Grantz, A., Johnson, L. & Sweeney, J.F. (eds): <strong>The</strong> Arctic Ocean<br />
region, 211–226. <strong>The</strong> geology of North America, L. Boulder,<br />
Colorado: Geological Society of America.<br />
130
Dawes, P.R. & Peel, J.S. 1981: <strong>The</strong> northern margin of <strong>Greenland</strong><br />
from Baffin Bay to the <strong>Greenland</strong> Sea. In: Nairn, A.E.M.,<br />
Churkin, M., Jr. & Stehli, F.G. (eds): <strong>The</strong> ocean basins and margins<br />
5, the Arctic Ocean, 201–264. New York: Plenum Press.<br />
Forsberg, R., Gudmandsen, P., Kristensen, R.H., Mikkelsen, N.,<br />
Nielsen, A. & Taagholt, J. 1999: <strong>Greenland</strong> Arctic Ocean Shelf<br />
Project. Science plan. An initiative by the Commission for<br />
Scientific Research in <strong>Greenland</strong>, 26 pp. Unpublished report,<br />
Commission for Scientific Research in <strong>Greenland</strong>, Copenhagen,<br />
Denmark.<br />
Johannessen, O.M., Shalin, E.V. & Milnes, M.W. 1999: Satellite evidence<br />
for an Arctic sea ice cover transformation. Science 286,<br />
1937–1939.<br />
Rothrock, D.A., Yu, Y. & Maykut, G.A. 1999: Thinning of Arctic<br />
sea ice cover. Geophysical Research Letters 26, 3469–3472.<br />
Taagholt, J. & Hansen, J.C. 2001: <strong>Greenland</strong>: Security perspectives,<br />
93 pp. Fairbanks, USA: Arctic Research Consortium of<br />
the U.S.<br />
United Nations 1993: <strong>The</strong> Law of the sea. Definition of the continental<br />
shelf – an examination of the relevant provisions in<br />
the United Nations Convention on the Law of the Sea, 47 pp.<br />
New York: Division for Ocean Affairs and the Law of the Sea,<br />
Office of Legal Affairs.<br />
Wadhams, P. & Davis, N.R. 2000: Further evidence of ice thinning<br />
in the Arctic Ocean. Geophysical Research Letters 27(24),<br />
3973–3976.<br />
Authors’ addresses<br />
N.M., Geological Survey of Denmark and <strong>Greenland</strong>, Thoravej 8, DK-2400 Copenhagen NV, Denmark. E-mail: nm@geus.dk<br />
P.G., Technical University of Denmark, DK-2800 Lyngby, Denmark.<br />
R.F., National Survey & Cadastre (KMS), Rentemestervej 8, DK-2400 Copenhagen NV, Denmark.<br />
131