Landslide Susceptibility Mapping of Highway 16 ... - UNBC GIS Lab
Landslide Susceptibility Mapping of Highway 16 ... - UNBC GIS Lab
Landslide Susceptibility Mapping of Highway 16 ... - UNBC GIS Lab

You also want an ePaper? Increase the reach of your titles
YUMPU automatically turns print PDFs into web optimized ePapers that Google loves.
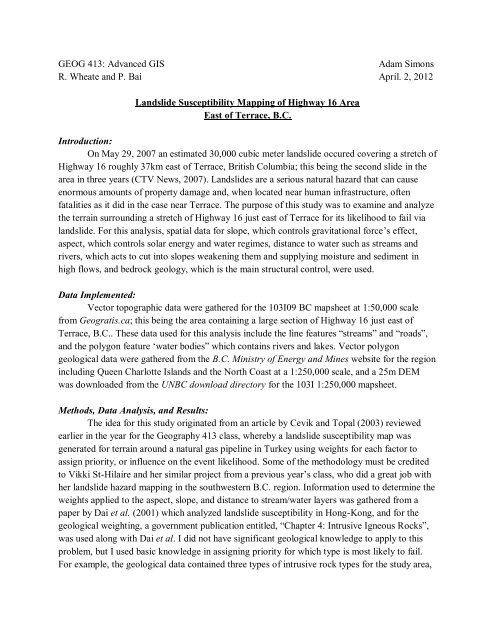
GEOG 413: Advanced <strong>GIS</strong><br />
Adam Simons<br />
R. Wheate and P. Bai April. 2, 2012<br />
<strong>Landslide</strong> <strong>Susceptibility</strong> <strong>Mapping</strong> <strong>of</strong> <strong>Highway</strong> <strong>16</strong> Area<br />
East <strong>of</strong> Terrace, B.C.<br />
Introduction:<br />
On May 29, 2007 an estimated 30,000 cubic meter landslide occured covering a stretch <strong>of</strong><br />
<strong>Highway</strong> <strong>16</strong> roughly 37km east <strong>of</strong> Terrace, British Columbia; this being the second slide in the<br />
area in three years (CTV News, 2007). <strong>Landslide</strong>s are a serious natural hazard that can cause<br />
enormous amounts <strong>of</strong> property damage and, when located near human infrastructure, <strong>of</strong>ten<br />
fatalities as it did in the case near Terrace. The purpose <strong>of</strong> this study was to examine and analyze<br />
the terrain surrounding a stretch <strong>of</strong> <strong>Highway</strong> <strong>16</strong> just east <strong>of</strong> Terrace for its likelihood to fail via<br />
landslide. For this analysis, spatial data for slope, which controls gravitational force‟s effect,<br />
aspect, which controls solar energy and water regimes, distance to water such as streams and<br />
rivers, which acts to cut into slopes weakening them and supplying moisture and sediment in<br />
high flows, and bedrock geology, which is the main structural control, were used.<br />
Data Implemented:<br />
Vector topographic data were gathered for the 103I09 BC mapsheet at 1:50,000 scale<br />
from Geogratis.ca; this being the area containing a large section <strong>of</strong> <strong>Highway</strong> <strong>16</strong> just east <strong>of</strong><br />
Terrace, B.C.. These data used for this analysis include the line features “streams” and “roads”,<br />
and the polygon feature „water bodies” which contains rivers and lakes. Vector polygon<br />
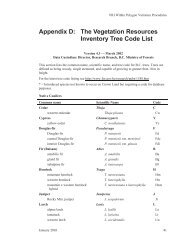
geological data were gathered from the B.C. Ministry <strong>of</strong> Energy and Mines website for the region<br />
including Queen Charlotte Islands and the North Coast at a 1:250,000 scale, and a 25m DEM<br />
was downloaded from the <strong>UNBC</strong> download directory for the 103I 1:250,000 mapsheet.<br />
Methods, Data Analysis, and Results:<br />
The idea for this study originated from an article by Cevik and Topal (2003) reviewed<br />
earlier in the year for the Geography 413 class, whereby a landslide susceptibility map was<br />
generated for terrain around a natural gas pipeline in Turkey using weights for each factor to<br />
assign priority, or influence on the event likelihood. Some <strong>of</strong> the methodology must be credited<br />
to Vikki St-Hilaire and her similar project from a previous year‟s class, who did a great job with<br />
her landslide hazard mapping in the southwestern B.C. region. Information used to determine the<br />
weights applied to the aspect, slope, and distance to stream/water layers was gathered from a<br />
paper by Dai et al. (2001) which analyzed landslide susceptibility in Hong-Kong, and for the<br />
geological weighting, a government publication entitled, “Chapter 4: Intrusive Igneous Rocks”,<br />
was used along with Dai et al. I did not have significant geological knowledge to apply to this<br />
problem, but I used basic knowledge in assigning priority for which type is most likely to fail.<br />
For example, the geological data contained three types <strong>of</strong> intrusive rock types for the study area,
and I determined the least likely to fail were the types with the most quartz mineral content in<br />
them, which was determined from the government article. Limestone and calcareous sedimentary<br />
rocks were deemed the most likely to fail, followed by volcanic, then sedimentary. The factors<br />
used in the analysis and the priority values assigned to each class within them are shown below,<br />
with the highest value equalling the most likely to contribute to landsliding, and the lowest<br />
equalling the least likely.<br />
Other factors that could have been included are vegetation type cover, elevation, soil<br />
moisture, land use, previous landslide events, and others (Cevik and Topal, 2003).<br />
Table 1: The four factors that contribute to landslide events and the priority values assigned to each class within the factor.<br />
Higher values = more influence on slide.<br />
Factor Class Priority<br />
Bedrock Geology Quartz dioritic intrusive rocks 1<br />
Rhyolite,felsic volcanic rocks 5<br />
Granodioritic intrusive rocks 2<br />
Limestone,marble,calcareous<br />
8<br />
sedimentary rocks<br />
Volcanoclastic rocks 6<br />
Calc-alkaline volcanic rocks 7<br />
Intrusive rocks, undivided 3<br />
Undivided sedimentary rocks 4<br />
Distance to Streams/Rivers<br />
(2 layers)<br />
200m 1<br />
Slope (°) 0-10 1<br />
10-20 2<br />
20-30 3<br />
30-40 6<br />
40-50 5<br />
>50 4<br />
Aspect N 1<br />
NE 2<br />
E 5<br />
SE 7<br />
S 8<br />
SW 6<br />
W 4<br />
NW 3
The following steps were followed to generate the final landslide susceptibility map output:<br />
- Gathered data from the three sources mentioned earlier for geology, elevation, roads,<br />
streams, and water bodies.<br />
- Converted the ASCII DEM to an ESRI Grid and re-projected each <strong>of</strong> the vectors to the<br />
DEM projection- NAD83 UTM Zone 9- except for the geology layer which was already<br />
in the correct projection. Coordinate system: GCS North American 1983.<br />
- Clipped the geology layer and DEM to the study area extent given by the streams layer.<br />
- Generated the slope (degrees) and aspect rasters from the DEM layer and<br />
classified/symbolized them based on the classes shown above. The DEM and the<br />
resulting two layers are shown below:<br />
Figure 1: Digital Elevation Model.<br />
Figure 2: Slope.<br />
Figure 3: Aspect.
- Generated a straight-line distance raster from both the stream layer (containing all small<br />
mountain streams) and the water body layer (containing the main Skeena River which the<br />
highway follows and small mountain lakes) and classified/symbolized as shown in table<br />
1 (i.e.,
- After the five raster layers were generated and reclassified to show weights (priority),<br />
they were input to the raster calculator in ArcMap with the expression:<br />
landslide_susceptibility = 0.20*[geology] + 0.20*[slope] + 0.20*[aspect] +<br />
0.20*[distance_water] + 0.20*[distance_streams],<br />
the initial output <strong>of</strong> which is shown in figure 7. For the final map output, the resulting<br />
classes created by the summation <strong>of</strong> each layer were reclassified/symbolized to a fiveclass<br />
system from “Very High” susceptibility to “Very Low”, as shown in figure 9.<br />
- A second map was generated using information from Cevik and Topal (2003) whereby<br />
each factor themselves, not the classes within each factor, were ranked on likelihood to<br />
trigger an event. The authors rank geology as the most important factor, followed by<br />
slope, distance to streams, with aspect being the least important. The raster calulator<br />
equation is shown here:<br />
landslide_susceptibility = 0.35*[geology] + 0.25*[slope] + 0.10*[aspect] +<br />
0.15*[distance_water] + 0.15*[distance_streams].<br />
This result was not used because <strong>of</strong> the odd patterns caused by the over-weighting <strong>of</strong> the<br />
geology polygons, but the rough output is shown in figure 8.<br />
Figure 7: Rough output <strong>of</strong> landslide susceptibility using<br />
constant weights. Lighter areas represent more susceptible<br />
terrain; dark, less susceptible.<br />
Figure 8: Rough output <strong>of</strong> landslide susceptibility using<br />
varied weights from Cevik and Topal (2003).
Figure 9: Final map result with overlying vector layers roads, streams, and water bodies. Further information is provided in<br />
the formal PDF map.<br />
Conclusion:<br />
As shown in the final PDF map attached with this report, as well as in the rough picture<br />
provided above, the majority <strong>of</strong> the highly landslide susceptible terrain (shown in red and<br />
orange) is located along the south-facing stream gullies running down the valley walls which<br />
lead towards the Skeena River and <strong>Highway</strong> <strong>16</strong>. This also happens to be how the landslide in<br />
2007 occured; forming in an upper valley and running a few kilometers down-slope to the<br />
highway. While the area immediately adjacent to the main road does not appear at risk <strong>of</strong> sliding,<br />
this map clearly shows there is risk in the nearby mountains that could affect transportation, and<br />
even river flow if large enough.
References:<br />
Literature:<br />
Cevik, E. and Topal, T. (2003). <strong>GIS</strong>-based landslide susceptibility mapping for a problematic<br />
segment <strong>of</strong> the natural gas pipeline, Hendek (Turkey). Environmental Geology, 44: 949-<br />
962. DOI 10.1007/s00254-003-0838-6.<br />
Chapter 4: Intrusive igneous rocks. Retrieved April 1, 2012.<br />
http://www.cedd.gov.hk/eng/publications/sheet/doc/g4_chapter_4.pdf<br />
CTV.ca News Staff (2007, May 29). Northern B.C. town still cut <strong>of</strong>f after landslide. Retrieved<br />
April 2, 2012, from CTV News website.<br />
http://www.ctv.ca/CTVNews/Canada/20070529/bc_mudslide_070529/<br />
Dai, F.et al. (2001). Assessment <strong>of</strong> landslide susceptibility on the natural terrain <strong>of</strong> Lantau<br />
Island, Hong Kong. Environmental Geology, 40, 381-391. doi: 10.1007/s002540000<strong>16</strong>3.<br />
Digital Data Sources:<br />
British Columbia Ministry <strong>of</strong> Energy and Mines. File directory: GeoFile 2005-5: Digital<br />
Geology Map <strong>of</strong> B.C.- Tile NN8-9 North Coast and Queen Charlotte Islands/ Haida Gwaii.<br />
http://www.empr.gov.bc.ca/Mining/Geoscience/PublicationsCatalogue/DigitalGeologyMaps/Pag<br />
es/DigitalGeologyMapCoverage.aspx.<br />
Geogratis.ca. National Topographic Data Base. File directory: bndt_103i09_shp_en.zip.<br />
http://ftp2.cits.rncan.gc.ca/pub/bndt/50k_shp_en/103/i/.<br />
<strong>UNBC</strong> <strong>GIS</strong> <strong>Lab</strong> Data Download. http://www.gis.unbc.ca/resources/data_download/get_data.php.
<strong>Landslide</strong> <strong>Susceptibility</strong> Map for <strong>Highway</strong> <strong>16</strong><br />
East <strong>of</strong> Terrace, B.C.<br />
By Adam Simons<br />
Skeena River<br />
<strong>Highway</strong> <strong>16</strong><br />
0 2.5 5 10 Kilometers<br />
Created April 2, 2012<br />
<strong>UNBC</strong>, Prince George, CA.<br />
Data from 103I09 1:50,000 mapsheet<br />
NAD83 UTM Zone 9 projection<br />
Legend<br />
Streams<br />
Roads<br />
Rivers and Lakes<br />
<strong>Landslide</strong> <strong>Susceptibility</strong><br />
Very High<br />
High<br />
Moderate<br />
Low<br />
Very Low