Regional Geology, Sioux Lookout Orogenic Belt - Geology Ontario
Regional Geology, Sioux Lookout Orogenic Belt - Geology Ontario
Regional Geology, Sioux Lookout Orogenic Belt - Geology Ontario
You also want an ePaper? Increase the reach of your titles
YUMPU automatically turns print PDFs into web optimized ePapers that Google loves.
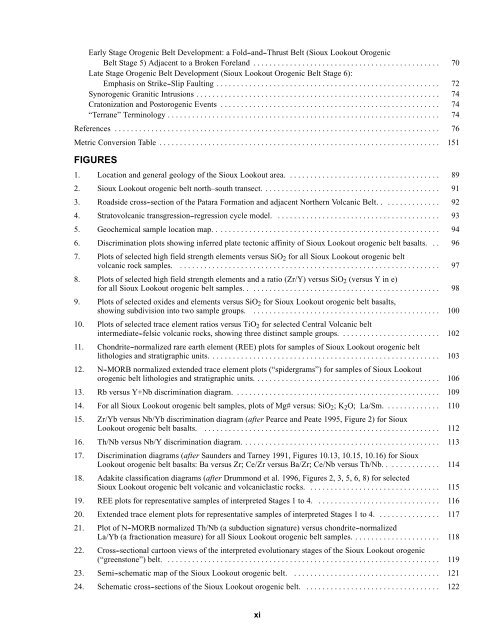
Early Stage <strong>Orogenic</strong> <strong>Belt</strong> Development: a Fold--and--Thrust <strong>Belt</strong> (<strong>Sioux</strong> <strong>Lookout</strong> <strong>Orogenic</strong><br />
<strong>Belt</strong> Stage 5) Adjacent to a Broken Foreland .............................................. 70<br />
Late Stage <strong>Orogenic</strong> <strong>Belt</strong> Development (<strong>Sioux</strong> <strong>Lookout</strong> <strong>Orogenic</strong> <strong>Belt</strong> Stage 6):<br />
Emphasis on Strike--Slip Faulting ....................................................... 72<br />
Synorogenic Granitic Intrusions ............................................................ 74<br />
Cratonization and Postorogenic Events ...................................................... 74<br />
“Terrane” Terminology ................................................................... 74<br />
References ................................................................................ 76<br />
Metric Conversion Table ..................................................................... 151<br />
FIGURES<br />
1. Location and general geology of the <strong>Sioux</strong> <strong>Lookout</strong> area. ..................................... 89<br />
2. <strong>Sioux</strong> <strong>Lookout</strong> orogenic belt north–south transect. ........................................... 91<br />
3. Roadside cross--section of the Patara Formation and adjacent Northern Volcanic <strong>Belt</strong>. . ............. 92<br />
4. Stratovolcanic transgression--regression cycle model. ........................................ 93<br />
5. Geochemical sample location map. . ...................................................... 94<br />
6. Discrimination plots showing inferred plate tectonic affinity of <strong>Sioux</strong> <strong>Lookout</strong> orogenic belt basalts. .. 96<br />
7. Plots of selected high field strength elements versus SiO 2 for all <strong>Sioux</strong> <strong>Lookout</strong> orogenic belt<br />
volcanic rock samples. ................................................................ 97<br />
8. Plots of selected high field strength elements and a ratio (Zr/Y) versus SiO 2 (versus Y in e)<br />
for all <strong>Sioux</strong> <strong>Lookout</strong> orogenic belt samples. . .............................................. 98<br />
9. Plots of selected oxides and elements versus SiO 2 for <strong>Sioux</strong> <strong>Lookout</strong> orogenic belt basalts,<br />
showing subdivision into two sample groups. .............................................. 100<br />
10. Plots of selected trace element ratios versus TiO 2 for selected Central Volcanic belt<br />
intermediate--felsic volcanic rocks, showing three distinct sample groups. ........................ 102<br />
11. Chondrite--normalized rare earth element (REE) plots for samples of <strong>Sioux</strong> <strong>Lookout</strong> orogenic belt<br />
lithologies and stratigraphic units. ........................................................ 103<br />
12. N--MORB normalized extended trace element plots (“spidergrams”) for samples of <strong>Sioux</strong> <strong>Lookout</strong><br />
orogenic belt lithologies and stratigraphic units. ............................................. 106<br />
13. Rb versus Y+Nb discrimination diagram. .................................................. 109<br />
14. For all <strong>Sioux</strong> <strong>Lookout</strong> orogenic belt samples, plots of Mg# versus: SiO 2 ;K 2 O; La/Sm. ............. 110<br />
15. Zr/Yb versus Nb/Yb discrimination diagram (after Pearce and Peate 1995, Figure 2) for <strong>Sioux</strong><br />
<strong>Lookout</strong> orogenic belt basalts. .......................................................... 112<br />
16. Th/Nb versus Nb/Y discrimination diagram. ................................................ 113<br />
17. Discrimination diagrams (after Saunders and Tarney 1991, Figures 10.13, 10.15, 10.16) for <strong>Sioux</strong><br />
<strong>Lookout</strong> orogenic belt basalts: Ba versus Zr; Ce/Zr versus Ba/Zr; Ce/Nb versus Th/Nb. . ............ 114<br />
18. Adakite classification diagrams (after Drummond et al. 1996, Figures 2, 3, 5, 6, 8) for selected<br />
<strong>Sioux</strong> <strong>Lookout</strong> orogenic belt volcanic and volcaniclastic rocks. ................................ 115<br />
19. REE plots for representative samples of interpreted Stages 1 to 4. .............................. 116<br />
20. Extended trace element plots for representative samples of interpreted Stages 1 to 4. ............... 117<br />
21. Plot of N--MORB normalized Th/Nb (a subduction signature) versus chondrite--normalized<br />
La/Yb (a fractionation measure) for all <strong>Sioux</strong> <strong>Lookout</strong> orogenic belt samples. ..................... 118<br />
22. Cross--sectional cartoon views of the interpreted evolutionary stages of the <strong>Sioux</strong> <strong>Lookout</strong> orogenic<br />
(“greenstone”) belt. ................................................................... 119<br />
23. Semi--schematic map of the <strong>Sioux</strong> <strong>Lookout</strong> orogenic belt. .................................... 121<br />
24. Schematic cross--sections of the <strong>Sioux</strong> <strong>Lookout</strong> orogenic belt. ................................. 122<br />
xi


