Assessment of the Cattle and Hog Industries Calendar Year 2000
Assessment of the Cattle and Hog Industries Calendar Year 2000
Assessment of the Cattle and Hog Industries Calendar Year 2000

Create successful ePaper yourself
Turn your PDF publications into a flip-book with our unique Google optimized e-Paper software.
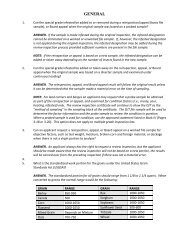
feeding has become more concentrated in recent years. A 1996 study found that 152<br />
sellers accounted for 43 percent <strong>of</strong> all purchases <strong>of</strong> fed cattle by <strong>the</strong> Nation’s 43 largest<br />
beef slaughtering plants in 1992. The plants accounted for over 90 percent <strong>of</strong> total beef<br />
slaughter that year. 33 In <strong>2000</strong>, annual feeding capacity <strong>of</strong> <strong>the</strong> four largest feeding firms<br />
equaled 11 percent <strong>of</strong> total steer <strong>and</strong> heifer slaughter. Capacity <strong>of</strong> <strong>the</strong> 30 largest feeding<br />
firms equaled 38 percent <strong>of</strong> total slaughter. 34<br />
Table 2.—Distribution <strong>of</strong> U.S. fed cattle sales by size <strong>of</strong> feedlot, selected years 1985–00<br />
Feedlot capacity (number <strong>of</strong> head)<br />
<strong>Year</strong><br />
Less than 1,000 to 2,000 to 4,000 to 8,000 to 16,000 to More than<br />
1,000 1,999 3,999 7,999 15,999 32,000 32,000<br />
Percent<br />
1985 19.0 4.0 6.1 7.3 15.0 19.7 29.0<br />
1990 15.6 4.1 7.0 7.5 14.5 23.0 28.2<br />
1995 9.7 4.1 5.3 8.1 14.2 21.1 37.6<br />
<strong>2000</strong> 14.2 3.2 4.6 7.6 11.1 19.4 39.8<br />
Source: Nebraska Agricultural Statistics Service. Nebraska Agricultural Statistics, Nebraska Department <strong>of</strong> Agriculture, 1996 <strong>and</strong><br />
<strong>2000</strong> issues; Agricultural Statistics Board, <strong>Cattle</strong> on Feed, Mt An 2-1 (2-01) NASS-USDA, February 16, 2001.<br />
Four-firm concentration in steer <strong>and</strong> heifer slaughter rose sharply in <strong>the</strong> 1980s, but has<br />
changed very little in recent years. The four largest firms accounted for 36 percent <strong>of</strong><br />
total commercial slaughter in 1980, 72 percent in 1990, <strong>and</strong> 81 percent in 1999 (table 3).<br />
The Herfindahl-Hirshman Index (HHI) also increased during this time period, which<br />
indicates that <strong>the</strong> steer <strong>and</strong> heifer market became more concentrated in <strong>the</strong> 1990s. The<br />
HHI (Herfindahl-Hirshman Index) equals <strong>the</strong> sum <strong>of</strong> each firm’s squared percentage<br />
share <strong>of</strong> <strong>the</strong> total market. 35 The Department <strong>of</strong> Justice (DOJ) <strong>and</strong> <strong>the</strong> Federal Trade<br />
Commission (FTC) consider markets with HHI values below 1000 to be unconcentrated.<br />
Conversely, DOJ <strong>and</strong> FTC view markets as highly concentrated if <strong>the</strong>y have an HHI over<br />
1800.<br />
Table 3.— Steer <strong>and</strong> heifer slaughter concentration, selected years 1980–99 1<br />
1980 1985 1990 1995 1998 1999<br />
Four-firm<br />
Concentration (percent) 2 35.7 50.2 71.6 80.8 80.4 81.4<br />
HHI 3 561 999 1661 2036 1936 NA<br />
1<br />
Data for 1980, 1985, <strong>and</strong> 1990 are based on firms’ fiscal years as reported to P&SP. Data for 1995-99 are based on calendar year<br />
for federally inspected slaughter. NA denotes not available.<br />
2<br />
Percentage <strong>of</strong> total commercial slaughter accounted for by <strong>the</strong> four largest firms.<br />
3<br />
HHI (Herfindahl-Hirshman Index) equals <strong>the</strong> sum <strong>of</strong> each firm’s squared percentage share <strong>of</strong> total commercial slaughter. .<br />
Source: Packers <strong>and</strong> Stockyards Administration. Packers <strong>and</strong> Stockyards Statistical Report, reporting years 1980, 1985, 1990;<br />
Packers <strong>and</strong> Stockyards Programs. Packers <strong>and</strong> Stockyards Statistical Report, reporting years 1995-98.<br />
33 Slaughter <strong>Cattle</strong> Procurement <strong>and</strong> Pricing Study Team., Price Determination in Slaughter <strong>Cattle</strong> Procurement, GIPSA-RR 96-2,<br />
GIPSA-USDA, September 1996.<br />
34 Kay, Steve, “Feedlots Continue to Exp<strong>and</strong>,” <strong>Cattle</strong> Buyers Weekly, October 30, <strong>2000</strong>. Estimated annual capacity is calculated as<br />
85 percent <strong>of</strong> maximum one-time capacity times 2.5 turns in 1 year. A turn is <strong>the</strong> number <strong>of</strong> times <strong>the</strong> lot could be filled <strong>and</strong> <strong>the</strong> cattle<br />
fed to slaughter weight during 1 year.<br />
35 Holmes, William C. <strong>and</strong> Dawn E. Holmes. Antitrust Law Sourcebook for <strong>the</strong> United States <strong>and</strong> Europe, <strong>2000</strong> Edition. West<br />
Group, <strong>2000</strong>.<br />
8