Assessment of the Cattle and Hog Industries Calendar Year 2000
Assessment of the Cattle and Hog Industries Calendar Year 2000
Assessment of the Cattle and Hog Industries Calendar Year 2000

You also want an ePaper? Increase the reach of your titles
YUMPU automatically turns print PDFs into web optimized ePapers that Google loves.
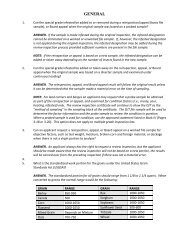
Larger operations have consistently produced larger litters. In <strong>2000</strong>, <strong>the</strong> largest volume<br />
producers, on average, produced 1.4 (18.47 percent) more pigs per litter than <strong>the</strong> smallest<br />
producers did. Smaller volume producers, however, have seen a greater increase in <strong>the</strong>ir<br />
pigs per litter since 1995 than <strong>the</strong> larger volume producers (table 6).<br />
Table 6.—Average number <strong>of</strong> pigs per litter by size <strong>of</strong> operation, 1995-<strong>2000</strong><br />
Pigs per litter on operations having<br />
<strong>Year</strong><br />
1,000- 2,000-<br />
1-99 100-499 500-999 1,999 4,999<br />
head head head head head 1<br />
5,000 or<br />
more<br />
head<br />
1995 7.22 7.76 8.02 8.30 8.71<br />
1996 7.35 7.90 8.13 8.43 8.78<br />
1997 7.43 7.88 8.18 8.48 8.63 8.95<br />
1998 7.38 8.03 8.33 8.53 8.78 8.93<br />
1999 7.65 8.13 8.30 8.58 8.78 8.95<br />
<strong>2000</strong> 7.58 7.98 8.30 8.63 8.78 8.98<br />
1<br />
<strong>2000</strong> or more head in 1995 <strong>and</strong> 1996.<br />
Source: National Agricultural Statistics Service, <strong>Hog</strong>s & Pigs, December issues, 1995-00.<br />
Annual litters per sow have increased from an average 1.68 in 1995 to 1.75 in 1999, a<br />
4.2-percent increase (table 7).<br />
Table 7.—Annual litters per sow<br />
1995 1996 1997 1998 1999<br />
1.68 1.64 1.75 1.73 1.75<br />
Source: National Pork Producers Council, Pork Facts <strong>2000</strong>/2001.<br />
Improved genetics have also led to heavier carcass weights. The average carcass weight<br />
for commercial hogs increased an average <strong>of</strong> 5 pounds, or 2.7 percent from 1995 through<br />
1999 (table 8).<br />
Table 8.—Average carcass weight <strong>of</strong> commercial hogs<br />
1995 1996 1997 1998 1999<br />
185 185<br />
Pounds<br />
187 188 190<br />
Source: Economic Research Service, “Average Commercial Dressed <strong>Hog</strong> Weight,” Red Meat <strong>Year</strong>book, ERS-USDA, Sept. <strong>2000</strong>.<br />
Specialized Production<br />
Compared with past years, fewer producers today are operating farrow-to-finish<br />
operations. Instead, <strong>the</strong>y engage in specialized farrowing, nursery, or finishing<br />
operations. Specializing in a particular stage <strong>of</strong> hog production allows producers to<br />
perfect <strong>the</strong>ir production methods. Some producers raise hogs in specialized operations<br />
20