Assessment of the Cattle and Hog Industries Calendar Year 2000
Assessment of the Cattle and Hog Industries Calendar Year 2000
Assessment of the Cattle and Hog Industries Calendar Year 2000

Create successful ePaper yourself
Turn your PDF publications into a flip-book with our unique Google optimized e-Paper software.
43 percent <strong>of</strong> packers’ total slaughter in 1997, <strong>and</strong> had declined to 26 percent in <strong>2000</strong>. 81<br />
Today, large farms produce most U.S. hogs, <strong>and</strong> deliver directly to <strong>the</strong> packer, where<br />
price is based largely on carcass merit. 82 The share <strong>of</strong> hogs purchased on a carcass basis<br />
increased from 42.9 percent <strong>of</strong> all purchases in 1995 to 70.1 percent in 1998. 83<br />
A recent P&SP investigation revealed that smaller volume producers tended to sell hogs<br />
more frequently on <strong>the</strong> spot market than under marketing contracts. Investigation results<br />
showed that smaller volume producers, on average, received lower prices for hogs, but<br />
also generally produced lower quality hogs. 84 <strong>Hog</strong>s sold on <strong>the</strong> spot market during <strong>the</strong><br />
investigation period generally produced lower Fat Free Lean Index (FFLI) 85 scores than<br />
hogs sold under marketing contracts. The investigation also revealed that smaller volume<br />
producers might not receive quantity premiums because <strong>the</strong>y failed to meet delivery<br />
volume thresholds. Quality premiums, which may be specified in marketing contracts or<br />
as part <strong>of</strong> packer grade <strong>and</strong> yield programs, are <strong>of</strong>fered to sellers who are able to deliver a<br />
minimum number <strong>of</strong> hogs during a certain time period.<br />
Increased Use <strong>of</strong> Production <strong>and</strong> Marketing Contracts<br />
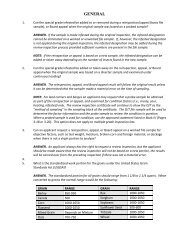
Use <strong>of</strong> production <strong>and</strong> marketing contracts is increasing. According to <strong>the</strong> NPPC,<br />
contractors, packers, <strong>and</strong> contract producers are motivated to use contracts for a number<br />
<strong>of</strong> reasons (table 11). Risk sharing appears to be <strong>the</strong> most common motivation for<br />
entering into a contract. Contracts allow each party to share risks associated with price,<br />
supply, quality, <strong>and</strong>/or income. Contracts analyzed by P&SP range in length from 3<br />
months to 20 years, with most averaging about 7 years. Some contracts are open-ended<br />
with a provision that requires one party to give notice <strong>of</strong> termination up to 1 year before<br />
actual termination. According to NPPC, a producer can generally expect to pay for<br />
capital inputs within 10 years <strong>of</strong> continuous contracted hog production. 86<br />
Table 11.—Motivations for contracting<br />
Production contracts<br />
Marketing contracts<br />
Contractor Contract grower Packer Producer<br />
Exp<strong>and</strong> operation<br />
Improve health<br />
Decrease production<br />
risk<br />
Increase pr<strong>of</strong>its<br />
Reduce price risk<br />
Specialization<br />
Investment<br />
alternative<br />
Means <strong>of</strong> entry<br />
Income<br />
diversification<br />
Supply assurance<br />
Quality assurance<br />
Shift price risk<br />
Shift price risk<br />
Market assurance<br />
Reduce marketing<br />
Management<br />
Supply assurance<br />
Sources: National Pork Producers Council, Guide to Contracting, <strong>2000</strong>.<br />
81 Grimes, Glenn <strong>and</strong> Steve Meyer, “<strong>2000</strong> <strong>Hog</strong> Marketing Contract Study,” University <strong>of</strong> Missouri <strong>and</strong> National Pork Producers<br />
Council, March 7, <strong>2000</strong>.<br />
82 McDonald, James M., et al., Consolidation in U. S. Meatpacking, Agricultural Economic Report No. 785, ERS-USDA, February<br />
<strong>2000</strong>.<br />
83 Packers <strong>and</strong> Stockyards Programs, Packers <strong>and</strong> Stockyards Statistical Report 1998 Reporting <strong>Year</strong>, GIPSA SR-00-1, GIPSA-<br />
USDA, July <strong>2000</strong>.<br />
84 Grain Inspection, Packers <strong>and</strong> Stockyards Administration. “Western Cornbelt <strong>Hog</strong> Procurement Investigation,” October 9, 1998.<br />
http://www.usda.gov/gipsa/newsroom/backgrounders/hogback.htm (21 February, 2001).<br />
85 The Fat Free Lean Index is a measure <strong>of</strong> <strong>the</strong> percentage <strong>of</strong> lean meat in a hog carcass.<br />
86 National Pork Producers Council., Guide to Contracting, <strong>2000</strong>.<br />
24