Rail and wheel roughness - implications for noise ... - ARCHIVE: Defra
Rail and wheel roughness - implications for noise ... - ARCHIVE: Defra
Rail and wheel roughness - implications for noise ... - ARCHIVE: Defra

You also want an ePaper? Increase the reach of your titles
YUMPU automatically turns print PDFs into web optimized ePapers that Google loves.
AEATR-PC&E-2003-002<br />
4.3 MODIFYING THE CRN SOURCE TERMS<br />
The ATQ curve can be used to adjust the CRN source term <strong>for</strong> vehicles with smooth <strong>wheel</strong>s<br />
(such as the Mk 3 <strong>and</strong> Mk 4 coaches) simply by adding the ATQ value to the<br />
CRN source term. For <strong>wheel</strong>s that have a <strong>roughness</strong> that makes a significant contribution to<br />
the total surface <strong>roughness</strong> the situation is more complex. At low levels of rail <strong>roughness</strong>, the<br />
difference between smooth <strong>and</strong> rough <strong>wheel</strong>s will remain relatively constant. However, at<br />
very high levels of rail <strong>roughness</strong>, when the surface <strong>roughness</strong> of the rail dominates, the<br />
<strong>roughness</strong> of the <strong>wheel</strong> is no longer significant <strong>and</strong> the <strong>noise</strong> from smooth <strong>and</strong> rough <strong>wheel</strong>s<br />
will be approximately the same.<br />
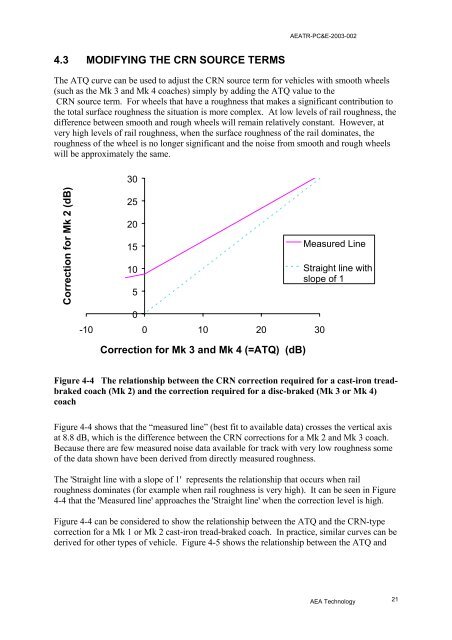
30<br />
Correction <strong>for</strong> Mk 2 (dB)<br />
25<br />
20<br />
15<br />
10<br />
5<br />
0<br />
-10 0 10 20 30<br />
Measured Line<br />
Straight line with<br />
slope of 1<br />
Correction <strong>for</strong> Mk 3 <strong>and</strong> Mk 4 (=ATQ) (dB)<br />
Figure 4-4 The relationship between the CRN correction required <strong>for</strong> a cast-iron treadbraked<br />
coach (Mk 2) <strong>and</strong> the correction required <strong>for</strong> a disc-braked (Mk 3 or Mk 4)<br />
coach<br />
Figure 4-4 shows that the “measured line” (best fit to available data) crosses the vertical axis<br />
at 8.8 dB, which is the difference between the CRN corrections <strong>for</strong> a Mk 2 <strong>and</strong> Mk 3 coach.<br />
Because there are few measured <strong>noise</strong> data available <strong>for</strong> track with very low <strong>roughness</strong> some<br />
of the data shown have been derived from directly measured <strong>roughness</strong>.<br />
The 'Straight line with a slope of 1' represents the relationship that occurs when rail<br />
<strong>roughness</strong> dominates (<strong>for</strong> example when rail <strong>roughness</strong> is very high). It can be seen in Figure<br />
4-4 that the 'Measured line' approaches the 'Straight line' when the correction level is high.<br />
Figure 4-4 can be considered to show the relationship between the ATQ <strong>and</strong> the CRN-type<br />
correction <strong>for</strong> a Mk 1 or Mk 2 cast-iron tread-braked coach. In practice, similar curves can be<br />
derived <strong>for</strong> other types of vehicle. Figure 4-5 shows the relationship between the ATQ <strong>and</strong><br />
AEA Technology 21