Rail and wheel roughness - implications for noise ... - ARCHIVE: Defra
Rail and wheel roughness - implications for noise ... - ARCHIVE: Defra
Rail and wheel roughness - implications for noise ... - ARCHIVE: Defra

Create successful ePaper yourself
Turn your PDF publications into a flip-book with our unique Google optimized e-Paper software.
AEATR-PC&E-2003-002<br />
ATQ - CRN predictions <strong>for</strong> the<br />
Lnight (dB)<br />
7<br />
6<br />
5<br />
4<br />
3<br />
2<br />
1<br />
0<br />
-1<br />
0 1 2 3 4 5 6<br />
ATQ - CRN predictions <strong>for</strong> the L den (dB)<br />
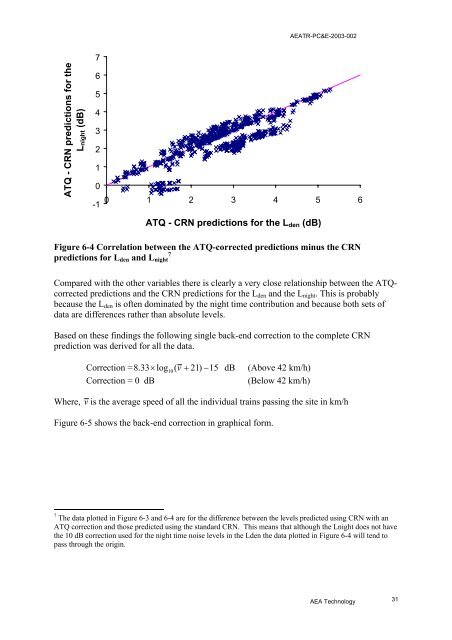
Figure 6-4 Correlation between the ATQ-corrected predictions minus the CRN<br />
predictions <strong>for</strong> L den <strong>and</strong> L night<br />
7<br />
Compared with the other variables there is clearly a very close relationship between the ATQcorrected<br />
predictions <strong>and</strong> the CRN predictions <strong>for</strong> the L den <strong>and</strong> the L night . This is probably<br />
because the L den is often dominated by the night time contribution <strong>and</strong> because both sets of<br />
data are differences rather than absolute levels.<br />
Based on these findings the following single back-end correction to the complete CRN<br />
prediction was derived <strong>for</strong> all the data.<br />
Correction = 8.33× log10(<br />
v + 21) −15<br />
dB (Above 42 km/h)<br />
Correction = 0 dB<br />
(Below 42 km/h)<br />
Where, v is the average speed of all the individual trains passing the site in km/h<br />
Figure 6-5 shows the back-end correction in graphical <strong>for</strong>m.<br />
7 The data plotted in Figure 6-3 <strong>and</strong> 6-4 are <strong>for</strong> the difference between the levels predicted using CRN with an<br />
ATQ correction <strong>and</strong> those predicted using the st<strong>and</strong>ard CRN. This means that although the Lnight does not have<br />
the 10 dB correction used <strong>for</strong> the night time <strong>noise</strong> levels in the Lden the data plotted in Figure 6-4 will tend to<br />
pass through the origin.<br />
AEA Technology 31