Rail and wheel roughness - implications for noise ... - ARCHIVE: Defra
Rail and wheel roughness - implications for noise ... - ARCHIVE: Defra
Rail and wheel roughness - implications for noise ... - ARCHIVE: Defra

Create successful ePaper yourself
Turn your PDF publications into a flip-book with our unique Google optimized e-Paper software.
AEATR-PC&E-2003-002<br />
limitation is that the combined length of the 'quiet' vehicles is less than 1.5 times the distance<br />
from the measurement point to the track. It can be seen that this is not a problem in Figure C-<br />
1 as the individual trailer cars are 23 metres long.<br />
When a vehicle is noisier than the adjacent vehicles the situation is much simpler. This is<br />
because louder <strong>noise</strong>s will dominate quieter <strong>noise</strong>s when combined on the decibel scale <strong>and</strong> is<br />
illustrated in Figure C-1 by the peak caused by 'Noisy' <strong>wheel</strong>s.<br />
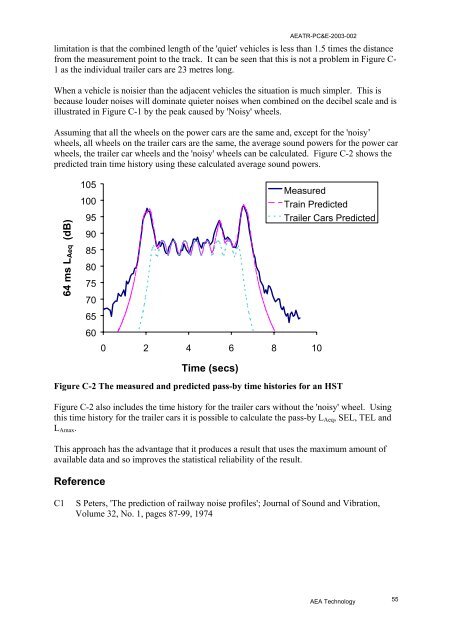
Assuming that all the <strong>wheel</strong>s on the power cars are the same <strong>and</strong>, except <strong>for</strong> the 'noisy’<br />
<strong>wheel</strong>s, all <strong>wheel</strong>s on the trailer cars are the same, the average sound powers <strong>for</strong> the power car<br />
<strong>wheel</strong>s, the trailer car <strong>wheel</strong>s <strong>and</strong> the 'noisy' <strong>wheel</strong>s can be calculated. Figure C-2 shows the<br />
predicted train time history using these calculated average sound powers.<br />
64 ms LAeq (dB)<br />
105<br />
100<br />
95<br />
90<br />
85<br />
80<br />
75<br />
70<br />
65<br />
60<br />
Measured<br />
Train Predicted<br />
Trailer Cars Predicted<br />
0 2 4 6 8 10<br />
Time (secs)<br />
Figure C-2 The measured <strong>and</strong> predicted pass-by time histories <strong>for</strong> an HST<br />
Figure C-2 also includes the time history <strong>for</strong> the trailer cars without the 'noisy' <strong>wheel</strong>. Using<br />
this time history <strong>for</strong> the trailer cars it is possible to calculate the pass-by L Aeq , SEL, TEL <strong>and</strong><br />
L Amax .<br />
This approach has the advantage that it produces a result that uses the maximum amount of<br />
available data <strong>and</strong> so improves the statistical reliability of the result.<br />
Reference<br />
C1<br />
S Peters, 'The prediction of railway <strong>noise</strong> profiles'; Journal of Sound <strong>and</strong> Vibration,<br />
Volume 32, No. 1, pages 87-99, 1974<br />
AEA Technology 55