Open print version - Hapag-Lloyd
Open print version - Hapag-Lloyd
Open print version - Hapag-Lloyd

You also want an ePaper? Increase the reach of your titles
YUMPU automatically turns print PDFs into web optimized ePapers that Google loves.
interim group management report I hapag-lloyd interim group report 9M · 2012<br />
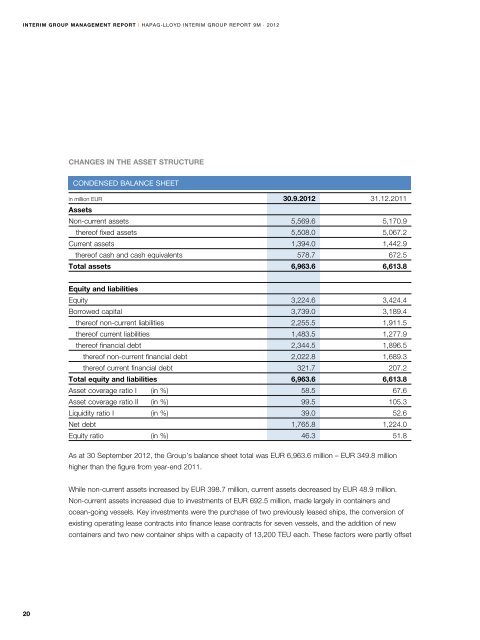
Changes in the asset structure<br />
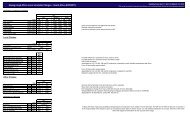
condensed balance sheet<br />
in million EUR 30.9.2012 31.12.2011<br />
Assets<br />
Non-current assets 5,569.6 5,170.9<br />
thereof fixed assets 5,508.0 5,067.2<br />
Current assets 1,394.0 1,442.9<br />
thereof cash and cash equivalents 578.7 672.5<br />
Total assets 6,963.6 6,613.8<br />
Equity and liabilities<br />
Equity 3,224.6 3,424.4<br />
Borrowed capital 3,739.0 3,189.4<br />
thereof non-current liabilities 2,255.5 1,911.5<br />
thereof current liabilities 1,483.5 1,277.9<br />
thereof financial debt 2,344.5 1,896.5<br />
thereof non-current financial debt 2,022.8 1,689.3<br />
thereof current financial debt 321.7 207.2<br />
Total equity and liabilities 6,963.6 6,613.8<br />
Asset coverage ratio I (in %) 58.5 67.6<br />
Asset coverage ratio II (in %) 99.5 105.3<br />
Liquidity ratio I (in %) 39.0 52.6<br />
Net debt 1,765.8 1,224.0<br />
Equity ratio (in %) 46.3 51.8<br />
As at 30 September 2012, the Group’s balance sheet total was EUR 6,963.6 million – EUR 349.8 million<br />
higher than the figure from year-end 2011.<br />
While non-current assets increased by EUR 398.7 million, current assets decreased by EUR 48.9 million.<br />
Non-current assets increased due to investments of EUR 692.5 million, made largely in containers and<br />
ocean-going vessels. Key investments were the purchase of two previously leased ships, the con<strong>version</strong> of<br />
existing operating lease contracts into finance lease contracts for seven vessels, and the addition of new<br />
containers and two new container ships with a capacity of 13,200 TEU each. These factors were partly offset<br />
20