Open print version - Hapag-Lloyd
Open print version - Hapag-Lloyd
Open print version - Hapag-Lloyd

Create successful ePaper yourself
Turn your PDF publications into a flip-book with our unique Google optimized e-Paper software.
interim group report I 9M 2012<br />
hapag-lloyd Holding Ag · 1 JanuarY to 30 september 2012
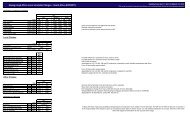
summary of hapag-lloyd key figures | interim group report 9M 2012<br />
key operating figures<br />
1.7. – 30.9.<br />
2012<br />
1.7. – 30.9.<br />
2011<br />
Change<br />
absolute<br />
1.1. – 30.9.<br />
2012<br />
1.1. – 30.9.<br />
2011<br />
Change<br />
absolute<br />
Total vessels 1) , of which: 146 147 –1 146 147 –1<br />
own vessels 58 58 0 58 58 0<br />
leased vessels 7 9 –2 7 9 –2<br />
chartered vessels 81 80 +1 81 80 +1<br />
Aggregate capacity of vessels TTEU 675 657 +18 675 657 +18<br />
Aggregate container capacity TTEU 1,064 1,049 +15 1,064 1,049 +15<br />
Bunker price (average) USD/t 634 644 –10 665 590 +75<br />
Freight rate (average) USD/TEU 1,647 1,529 +118 1,574 1,540 +34<br />
Transport volume TTEU 1,281 1,340 –59 3,963 3,874 +89<br />
Revenue m EUR 1,765 1,537 +228 5,160 4,504 +656<br />
Transport expenses m EUR 1,531 1,346 +185 4,638 3,892 +746<br />
EBITDA m EUR 164.1 105.4 +59 245.0 275.0 –30<br />
EBIT m EUR 79.8 34.1 +46 0.9 62.9 –62<br />
EBIT adjusted m EUR 86.6 36.7 +50 17.9 78.8 –61<br />
Group profit/loss m EUR 45.6 9.6 +36 –94.1 –23.1 –71<br />
Cash flow from operating activities m EUR 26.2 41.0 –15 127.1 186.8 –60<br />
Key return figures<br />
EBITDA margin (EBITDA / revenue) % 9.3 6.9 +2.4pp 4.7 6.1 –1.4ppt<br />
EBIT margin (EBIT / revenue) % 4.5 2.2 +2.3pp 0.0 1.4 –1.4ppt<br />
EBIT margin adjusted % 4.9 2.4 +2.5pp 0.3 1.7 –1.4ppt<br />
Key balance sheet figures as at 30 september<br />
Balance sheet total m EUR 6,964 6,614 2) +350 6,964 6,614 2) +350<br />
Equity m EUR 3,225 3,424 2) –199 3,225 3,424 2) –199<br />
Equity ratio (equity / balance sheet total) % 46.3 51.8 2) –5.5pp 46.3 51.8 2) –5.5ppt<br />
Borrowed capital m EUR 3,739 3,189 2) +550 3,739 3,189 2) +550<br />
Key financial figures as at 30 september<br />
Financial debt m EUR 2,345 1,897 2) +448 2,345 1,897 2) +448<br />
Cash and cash equivalents m EUR 579 673 2) –94 579 673 2) –94<br />
Net debt (financial debt – cash and cash equivalents) m EUR 1,766 1,224 2) +542 1,766 1,224 2) +542<br />
Gearing (net debt / equity) % 54.8 35.7 2) +19.1pp 54.8 35.7 2) +19.1ppt<br />
Number of employees as at 30 september<br />
Employees at sea 1) 1,355 1,336 +19 1,355 1,336 +19<br />
Employees on land 1) 5,678 5,570 +108 5,678 5,570 +108<br />
<strong>Hapag</strong>-<strong>Lloyd</strong> total 7,033 6,906 +127 7,033 6,906 +127<br />
1) As at 30.9.2012 2) As at 31.12.2011<br />
Disclaimer: This interim report contains statements concerning future developments at <strong>Hapag</strong>-<strong>Lloyd</strong>. Due to market fluctuations, the development of the<br />
competitive situation, world market prices for commodities, and changes in exchange rates and the economic environment, the actual results may differ considerably<br />
from these forecasts. <strong>Hapag</strong>-<strong>Lloyd</strong> neither intends nor undertakes to update forward-looking statements to adjust them to events or developments<br />
which occur after the date of this report.<br />
This report was published on 13 November 2012.
<strong>Hapag</strong>-lloyd interim group report 9M · 2012 I contents<br />
Contents<br />
4 <strong>Hapag</strong>-<strong>Lloyd</strong>’s capital market activities<br />
7 Interim Group management report<br />
7 Business and general conditions<br />
7 Group structure<br />
8 Operating activities<br />
8 Group objectives and strategy<br />
9 Business development<br />
9 General economic conditions<br />
10 Sector-specific conditions<br />
11 Important performance indicators<br />
15 Group earnings position<br />
18 Group financial and net asset position<br />
21 Risk and opportunity report<br />
22 Events after the balance sheet date<br />
22 Outlook<br />
24 Interim consolidated financial statements<br />
24 Consolidated income statement<br />
25 Consolidated statement of comprehensive income<br />
26 Consolidated statement of financial position<br />
28 Consolidated statement of changes in equity<br />
29 Condensed consolidated statement of cash flows<br />
30 Condensed Notes to the interim consolidated financial statements<br />
30 Notes on the principles and methods underlying the interim consolidated<br />
financial statements<br />
32 Selected notes to the consolidated income statement<br />
33 Selected notes to the consolidated statement of financial position<br />
38 Notes to the condensed consolidated statement of cash flows<br />
38 Other notes<br />
40 Significant transactions after the balance sheet date<br />
42 Financial calendar, im<strong>print</strong><br />
3
<strong>Hapag</strong>-lloyd’s capital market activities I hapag-lloyd interim group report 9M · 2012<br />
<strong>Hapag</strong>-<strong>Lloyd</strong>’s<br />
capital market activities<br />
Stock markets depend on central bank policy<br />
Despite disappointing economic growth in the USA and the brisk cool-down of economic activities in the<br />
growth region of Asia, most of the major international stock market indices charted considerable price rises<br />
in the third quarter. America’s leading index, the Dow Jones Industrial, and Germany’s DAX both stood at<br />
their highest level for 12 months in September. Investors’ confidence in both the euro and the international<br />
stock markets improved in particular due to the Federal Reserve’s billion-dollar programme to repurchase<br />
mortgage bonds and the announcement that the European Central Bank (ECB) would continue buying<br />
large quantities of government bonds issued by crisis-hit eurozone countries. The prospect of continuously<br />
low interest rates for the medium term also underpinned the upturn on the stock markets. However, stock<br />
exchange trends are largely driven by liquidity and market experts expect them to remain volatile in the<br />
fourth quarter due to the US presidential election and the weak global economy.<br />
Developments in the most important indices<br />
Indices 28.9.2012 30.12.2011 30.9.2011<br />
Dow Jones Industrial 13,437 12,217 10,913<br />
MSCI World 1,312 1,182 1,104<br />
EuroStoxx 50 2,454 2,316 2,179<br />
DAX Index 7,327 5,898 5,502<br />
Nikkei 225 8,870 8,455 8,700<br />
Source: Bloomberg<br />
As spot rates for container services deteriorated again on the important Far East trade, shares in the publicly<br />
listed container liner shipping companies were unable to participate in the positive stock market mood.<br />
4
<strong>Hapag</strong>-lloyd interim group report 9M · 2012 I <strong>Hapag</strong>-lloyd’s capital market activities<br />
Indexed share prices of container shipping companies (January 2011 to September 2012)<br />
110<br />
100<br />
90<br />
80<br />
70<br />
60<br />
50<br />
40<br />
Jan<br />
2011<br />
Mar<br />
2011<br />
May<br />
2011<br />
Jul<br />
2011<br />
Sep<br />
2011<br />
Nov<br />
2011<br />
Jan<br />
2012<br />
Mar<br />
2012<br />
Jun<br />
2012<br />
Sep<br />
2012<br />
DAX MSCI World Indexed share prices of container shipping companies Source: Bloomberg<br />
Positive price trends for corporate bonds<br />
In the eurozone, inflation stood at 2.7% p. a. in September and thereby 0.1 percentage points up on the<br />
previous month. For the last six months, the figure has considerably exceeded the ECB’s 2% target.<br />
Despite the high rate of inflation, demand for investments remained high among both institutional and private<br />
investors. This prompted rising prices and falling returns for corporate bonds once again in the third quarter<br />
of 2012. Companies capitalised on the persistently high demand and issued corporate bonds worth a record<br />
USD 237.6 billion in August, according to an analysis by the news agency Bloomberg.<br />
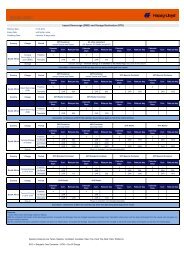
<strong>Hapag</strong>-<strong>Lloyd</strong>’s bonds<br />
On 28 September 2012, the bonds issued by <strong>Hapag</strong>-<strong>Lloyd</strong> AG were traded at 104.76% (EUR tranche)<br />
and 98.19% (USD tranche).<br />
The <strong>Hapag</strong>-<strong>Lloyd</strong> Group still has solid balance sheet ratios. The equity ratio (equity/balance sheet total) as<br />
at 30 September 2012 amounted to around 46%. Gearing remains comparatively low at approximately 55%.<br />
On 30 September 2012, cash and cash equivalents accounted for around 8% of the balance sheet total.<br />
The agreed covenants were once again fulfilled as at 30 September 2012.<br />
5
<strong>Hapag</strong>-lloyd’s capital market activities I hapag-lloyd interim group report 9M · 2012<br />
In its rating update on 28 September 2012, the international rating agency Standard & Poor’s downgraded<br />
its issuer rating for <strong>Hapag</strong>-<strong>Lloyd</strong> Holding AG from BB– to B+. The outlook (“negative”) remained unchanged.<br />
The rating agency Moody’s reduced its rating from B1/“Negative Outlook” to B2/“Negative Outlook” on<br />
31 October 2012. The euro bond was trading at 106.78% on 22 October 2012. The US dollar bond was<br />
trading at 99.31% and was therefore also higher than the price at the end of the reporting period.<br />
Key bond data<br />
Issue volume Maturity* Coupon Issue price Price on<br />
(total) 28.9.2012<br />
EUR tranche EUR 480 m 15.10.2015 9.00% 99.50%** 104.76%<br />
USD tranche USD 250 m 15.10.2017 9.75% 99.37% 98.19%<br />
Price data: Bloomberg; * Callable; ** Price of the first issue; increase of EUR 150 million at 103.38%<br />
<strong>Open</strong> and transparent communication<br />
The focus of <strong>Hapag</strong>-<strong>Lloyd</strong>’s investor relations activities is on communicating promptly with all investors and<br />
capital market operators. In the first nine months of 2012, <strong>Hapag</strong>-<strong>Lloyd</strong> attended the following international<br />
capital market conferences:<br />
Date Location Conference Host<br />
10 January London 8 th Annual High Yield and Leveraged Finance<br />
Conference 2012<br />
27– 29 February Miami Global High Yield & Leveraged Finance<br />
Conference 2012<br />
BNP Paribas<br />
J.P. Morgan<br />
29 March London 3 rd Annual Credit Opportunities Conference 2012 Knight Capital Group<br />
26 April Düsseldorf German Credit Conference IKB<br />
14 June London 16 th Annual European Leveraged Finance Conference Deutsche Bank<br />
3 September Hamburg Ship Finance Forum Financial Times Deutschland<br />
5 September New York 2012 Global Shipping Conference Jefferies<br />
13 September London European High Yield and Leverage Finance<br />
Conference 2012<br />
Barclays<br />
Numerous individual discussions were also held with interested international analysts and investors.<br />
Published reports are available on the <strong>Hapag</strong>-<strong>Lloyd</strong> website – www.hapag-lloyd.com/investor_relations.<br />
6
<strong>Hapag</strong>-lloyd interim group report 9M · 2012 I interim group management report<br />
Interim Group management report<br />
Business and general conditions<br />
Group structure<br />
<strong>Hapag</strong>-<strong>Lloyd</strong> Holding AG is the parent company of the <strong>Hapag</strong>-<strong>Lloyd</strong> Group and holds all of the shares in<br />
<strong>Hapag</strong>-<strong>Lloyd</strong> AG (<strong>Hapag</strong>-<strong>Lloyd</strong> subgroup). At the balance sheet date (30 September 2012), a total of 49<br />
direct and indirect subsidiaries and five equity-accounted investees belonged to the group of consolidated<br />
companies of <strong>Hapag</strong>-<strong>Lloyd</strong> Holding AG. The equity-accounted investees include two strategic holdings in<br />
container terminals in Hamburg and Montreal.<br />
Shareholder structure and corporate management<br />
As at 30 September 2012, 78.0% of the shares in <strong>Hapag</strong>-<strong>Lloyd</strong> Holding AG were held by the<br />
Hamburgische Seefahrtsbeteiligung “Albert Ballin” GmbH & Co. KG (“Albert Ballin” consortium) and<br />
22.0% by the TUI Group.<br />
Shareholding in %<br />
Hamburgische Seefahrtsbeteiligung “Albert Ballin“ GmbH & Co. KG 78.0%<br />
HGV Hamburger Gesellschaft für Vermögens- und Beteiligungsmanagement mbH 36.9%<br />
Kühne Maritime GmbH 28.2%<br />
SIGNAL IDUNA Gruppe 5.3%<br />
HSH Nordbank AG 2.9%<br />
HanseMerkur Versicherungsgruppe 1.8%<br />
Investorenpool unter Leitung von M.M.Warburg & CO KGaA 2.9%<br />
TUI AG / TUI-<strong>Hapag</strong> Beteiligungs GmbH 22.0%<br />
Total 100.0%<br />
At its meeting on 24 September 2012, the Supervisory Board extended the contracts of Michael Behrendt<br />
and Ulrich Kranich as members of the executive board for a further year. They now expire on 30 June 2014.<br />
Michael Behrendt was again appointed as Chairman of the Executive Board and Labour Director.<br />
7
interim group management report I hapag-lloyd interim group report 9M · 2012<br />
Operating activities<br />
<strong>Hapag</strong>-<strong>Lloyd</strong> is Germany’s largest container liner shipping company and is one of the world’s leading liner<br />
shipping companies in terms of global market coverage. The <strong>Hapag</strong>-<strong>Lloyd</strong> fleet consists of 146 container<br />
ships (30 September 2012). <strong>Hapag</strong>-<strong>Lloyd</strong> currently has around 300 sales offices in 114 countries and<br />
offers its customers worldwide access to a network of 89 liner services. In the first nine months of 2012,<br />
<strong>Hapag</strong>-<strong>Lloyd</strong> served 19,937 customers worldwide.<br />
The functional currency used by the international container liner shipping industry – and therefore also the<br />
<strong>Hapag</strong>-<strong>Lloyd</strong> subgroup – is the US dollar. Payment flows in currencies other than the US dollar are hedged<br />
to the US dollar as appropriate. However, the reporting currency of <strong>Hapag</strong>-<strong>Lloyd</strong> Holding AG is the euro.<br />
The translation of individual balance sheet items from foreign currencies, such as fixed assets and financial<br />
debt, results in some cases in significant valuation effects. The translation differences are recognised directly<br />
in other comprehensive income.<br />
Group objectives and strategy<br />
The <strong>Hapag</strong>-<strong>Lloyd</strong> Group’s prime objective is long-term profitable growth. Increasing global demand for<br />
container transport forms the basis for this planned organic growth. Based on current forecasts (IHS Global<br />
Insight, October 2012), the volume of global container transport should grow by 4.4% to 131.9 million TEU<br />
in 2013. Selling services at viable prices is still more important to <strong>Hapag</strong>-<strong>Lloyd</strong> than purely quantitative<br />
growth in volume.<br />
<strong>Hapag</strong>-<strong>Lloyd</strong> uses adjusted EBIT – earnings before interest and taxes adjusted for special items – as the key<br />
parameter for the internal management of its operating activities. The main influencing factors are transport<br />
volume, freight rate, the US dollar exchange rate against the euro, and operating costs including bunker<br />
price. The strategy of achieving long-term profitable growth in operating activities is pursued with the help<br />
of these key figures. In addition to the operating result (adjusted EBIT), earnings before interest, taxes,<br />
depreciation and amortisation (EBITDA) is likewise used as an important parameter. EBITDA is an important<br />
indicator of the achievement of sustainable company results and gross cash flows. It has a special significance<br />
for capital-intensive companies. <strong>Hapag</strong>-<strong>Lloyd</strong> – with its balanced fleet structure, owning approximately<br />
50% of its fleet – uses EBITDA as an important parameter for investment decisions.<br />
8
<strong>Hapag</strong>-lloyd interim group report 9M · 2012 I interim group management report<br />
The generation of sustainable cash flows and solid corporate financing, and therefore, in particular, a good<br />
liquidity and equity base, are once again key objectives of the corporate strategy in the 2012 financial year.<br />
As at 30 September 2012, <strong>Hapag</strong>-<strong>Lloyd</strong> had a liquidity reserve (consisting of cash, cash equivalents and<br />
unused credit facilities) totalling EUR 652.2 million (30 June 2012: EUR 568.8 million). In accordance with the<br />
financing policy, financing for the completed and planned investments in ships and containers were secured<br />
through corresponding financing agreements before placing orders.<br />
With demand for container transport services continuing to rise, container shipping will remain a growth<br />
industry in the long term. In order to utilise the medium-term expansion opportunities resulting from market<br />
growth and realise economies of scale in its ship operations, between July 2012 and November 2013<br />
<strong>Hapag</strong>-<strong>Lloyd</strong> will launch a total of ten new very large container vessels into service, each with a capacity of<br />
13,200 TEU.<br />
Business development<br />
General economic conditions<br />
Economists from the International Monetary Fund (IMF) believe that the risks for the global economy increased<br />
further in the third quarter of 2012. The ongoing sovereign debt crisis in the eurozone is burdening Europe’s<br />
economic development. Economic growth in the USA is also somewhat disappointing at present, despite<br />
the Federal Reserve’s aggressive monetary policy. China – Asia’s largest economy – is experiencing a more<br />
rapid cool-down than anticipated. Economic developments in important newly industrialising countries<br />
such as India and Brazil are also failing to meet expectations at present. In light of these negative factors,<br />
the IMF has downgraded its current economic forecast again.<br />
It has reduced its growth estimate for 2012 by 0.2 percentage points and its 2013 outlook by<br />
0.3 percentage points.<br />
Developments in global economic growth (GDP) and world trading volume<br />
(in %) 2013e 2012e 2011<br />
Global economic growth 3.6 3.3 3.8<br />
Industrialised countries 1.5 1.3 1.6<br />
Developing and newly industrialising countries 5.6 5.3 6.2<br />
World trading volume (goods and services) 4.5 3.2 5.8<br />
Source: IMF October 2012<br />
9
interim group management report I hapag-lloyd interim group report 9M · 2012<br />
Sector-specific conditions<br />
In the medium term, demand for container transport services should rise in tandem with expected ongoing<br />
growth in the world trading volume. For instance, IHS Global Insight Industry Intelligence (October 2012)<br />
expects a 3.2% increase in the global cargo volume this year and growth of 4.4% to 131.9 million TEU in<br />
2013. As the global economy is currently weak, the global cargo volume estimates have been reduced by<br />
0.9% for 2012 and 2.0% for 2013. Overall, the forecast rise in worldwide transport volumes in container<br />
shipping for 2012 and 2013 should be in line with the rate of growth for global trade.<br />
With the total capacity of the world container ship fleet estimated at 16.8 million TEU at the beginning of<br />
2012, the nominal supply capacity could see increases totalling 1.5 million TEU in 2012 and approximately<br />
1.8 million TEU in 2013 due to new vessels (Transmodal, October 2012). Due to the sharp fall in orders for<br />
new vessels, the tonnage of the commissioned container ships is currently equivalent to 21% of the global<br />
container fleet’s capacity. It therefore remains well below the highest level seen to date, 56% in 2008. In<br />
the future too, the actual growth in the global container fleet’s transport capacity is expected to be lower<br />
than the projected nominal increase, as old and inefficient vessels are scrapped, deliveries of newbuilds are<br />
postponed and slow steaming (reducing the speed at which services operate) is used. According to the<br />
industry information service AXS-Alphaliner (August 2012), the transport capacity used for slow steaming<br />
has increased by more than 230,000 TEU to an estimated 930,000 TEU since the beginning of the year.<br />
Meanwhile, Clarksons Shipping Intelligence Network (October 2012) reports that container vessels with<br />
an aggregate transport capacity of 235,000 TEU have already been scrapped since the beginning of the<br />
year (2011: 77,000 TEU). The scrapping of inefficient ships could increase to some 270,000 TEU for the full<br />
year 2012 (Dynaliner, May 2012). 377,000 TEU of unused transport capacity was permanently taken out<br />
of service in 2009 – the only year with a higher scrapping rate.<br />
Although the prospects for growth remain positive in the medium term, we may see temporary imbalances<br />
in supply and demand, which could have a substantial impact on the respective transport volumes and<br />
freight rates. The ongoing rise in transport expenses is likely to weaken short-term industry developments.<br />
This is primarily attributable to trends in bunker prices, which have more than trebled since the beginning<br />
of 2009. To compensate for the associated higher costs, leading container shipping companies have<br />
announced and implemented sharp increases in freight rates on important trades since the beginning of<br />
2012. As a consequence, spot rates for container services have firmed up compared to prices in early 2012,<br />
especially on Asia–Europe and Transpacific trades. However, trends in freight rates on the respective trades<br />
are shaped by demand and are therefore likely to continue to fluctuate considerably.<br />
10
<strong>Hapag</strong>-lloyd interim group report 9M · 2012 I interim group management report<br />
Due to unforeseen weaker demand for container transport services in the peak season, the number of idle<br />
ships has risen sharply again in recent weeks. At 550,000 TEU (AXS-Alphaliner, September 2012), the idle<br />
capacity corresponded to approximately 4% of the global container fleet’s total tonnage at the end of the<br />
third quarter of 2012. The majority of idle ships have a tonnage of up to 3,000 TEU. The number of idle vessels<br />
is expected to increase dramatically again in the course of the fourth quarter of 2012. By the end of<br />
2012, the idle fleet’s capacity could total as much as 900,000 TEU (AXS-Alphaliner September 2012).<br />
Important performance indicators<br />
Efficient fleet<br />
As at 30 September 2012, <strong>Hapag</strong>-<strong>Lloyd</strong>’s fleet comprised 146 container ships, which are all certified in<br />
accordance with the ISM (International Safety Management) Code and have a valid ISSC (ISPS) certificate.<br />
The majority of the vessels are also certified as per ISO 9001 (quality management) and ISO 14001<br />
(environmental management). The <strong>Hapag</strong>-<strong>Lloyd</strong> fleet’s total TEU capacity amounted to 675,273 TEU.<br />
<strong>Hapag</strong>-<strong>Lloyd</strong> also owned or leased 659,570 containers with a capacity of 1,064,373 TEU for transporting<br />
cargo.<br />
Structure of <strong>Hapag</strong>-<strong>Lloyd</strong>’s container ship fleet<br />
30.9.2012 31.12.2011 30.9.2011<br />
Number of vessels 146 149 147<br />
thereof<br />
own vessels 58 58 58<br />
leased vessels 7 9 9<br />
chartered vessels 81 82 80<br />
Aggregate capacity of vessels (TTEU) 675 679 657<br />
Aggregate container capacity (TTEU) 1,064 1,042 1,049<br />
Number of services 89 84 82<br />
The “New York Express” went into service in the third quarter, on 28 September 2012. It follows the<br />
“Hamburg Express” as the Company’s second container vessel with a capacity exceeding 10,000 TEU.<br />
There are another eight ships on the current order book, each with a capacity of 13,200 TEU.<br />
11
interim group management report I hapag-lloyd interim group report 9M · 2012<br />
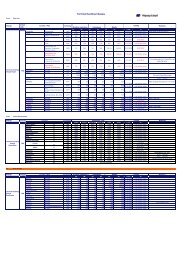
Transport volumes and freight rates<br />
Freight rates and transport volumes are among the main performance indicators used to gauge corporate<br />
development at the <strong>Hapag</strong>-<strong>Lloyd</strong> Group.<br />
In the first nine months of 2012, <strong>Hapag</strong>-<strong>Lloyd</strong> transported 3,963 TTEU worldwide. This corresponds to<br />
growth of 2.3% compared with the same period of the previous year. With the exception of the Atlantic<br />
trade, the development in transport volumes was positive on all trades during the period under review.<br />
Above-average growth in cargo volumes was achieved on the Transpacific and Australasia trades.<br />
Developments in transport volume by trade<br />
TTEU 9M 2012 9M 2011 9M 2010 9M 2009 9M 2008<br />
Atlantic 857 876 859 787 1,029<br />
Latin America 881 869 814 655 728<br />
Far East 861 849 848 793 977<br />
Transpacific 909 848 807 741 861<br />
Australasia 455 432 400 517 634<br />
Total 3,963 3,874 3,728 3,493 4,229<br />
In the first three quarters of 2012, the average freight rate was USD 1,574/TEU and therefore 2.2% up on<br />
the same period a year ago. This rise was attributable to the freight rate increases and surcharges imposed<br />
largely in the first six months of 2012. Competition remained tough, however, and continued to burden<br />
freight rate developments, especially on the Far East trade. In spite of the rate rises, the average freight<br />
rate on this trade was down 4.1% in the reporting period against the same period a year ago. By contrast,<br />
the Transpacific and Latin America trades saw positive developments in average freight rates.<br />
12
<strong>Hapag</strong>-lloyd interim group report 9M · 2012 I interim group management report<br />
Developments in freight rates by trade<br />
USD/TEU 9M 2012 9M 2011 9M 2010 9M 2009 9M 2008<br />
Atlantic 1,754 1,768 1,579 1,421 1,708<br />
Latin America 1,425 1,360 1,353 1,196 1,517<br />
Far East 1,350 1,408 1,639 1,070 1,679<br />
Transpacific 1,886 1,724 1,740 1,419 1,678<br />
Australasia 1,325 1,341 1,285 891 1,166<br />
Total (weighted average) 1,574 1,540 1,547 1,220 1,581<br />
Selling services at viable prices is still more important to <strong>Hapag</strong>-<strong>Lloyd</strong> than purely quantitative growth<br />
in volume.<br />
Quality and sustainability<br />
Using scarce resources sustainably is becoming an increasingly important competitive factor for container<br />
liner shipping companies. <strong>Hapag</strong>-<strong>Lloyd</strong> made its pledge to uphold sustainable business practices as early as<br />
1996. Both its vessels and its land-based operations are certified in line with ISO 9001 quality standards and<br />
the environmental norm ISO 14001. The ISO certificate has been extended for a further three years by the<br />
certification body, Germanischer <strong>Lloyd</strong>. <strong>Hapag</strong>-<strong>Lloyd</strong> is a long-standing member of the Clean Cargo Working<br />
Group. Since 20 October 2011, customers wishing to do so have been able to use the <strong>Hapag</strong>-<strong>Lloyd</strong> emissions<br />
calculator EcoCalc to see the emissions caused by their container shipment throughout the entire<br />
transport chain, from start to finish. The emissions calculator can be found on the <strong>Hapag</strong>-<strong>Lloyd</strong> website,<br />
www.hapag-lloyd.com. In February, <strong>Hapag</strong>-<strong>Lloyd</strong> became the first shipping company in the world to have<br />
its entire own-managed fleet classified in accordance with the IMO’s new Energy Efficiency Design Index<br />
(EEDI). The independent certification was carried out by Germanischer <strong>Lloyd</strong>. The EEDI will be mandatory for<br />
all newly built ships from 2013. In the second quarter of 2012, <strong>Hapag</strong>-<strong>Lloyd</strong> fitted the first of its ships, the<br />
“Dallas Express”, with the equipment needed to connect to an onshore power supply (known as cold ironing)<br />
while in port. Other vessels will follow suit. Cold ironing means that the auxiliary diesel engines used to generate<br />
electricity can remain switched off while the vessels are in port. This reduces emissions and noise pollution,<br />
thus improving the air quality in and around ports.<br />
13
interim group management report I hapag-lloyd interim group report 9M · 2012<br />
Customers<br />
Long-term, close business relations with clients are also important in driving value for corporate development.<br />
Relationships with major customers are managed by a special key account team. This enables the<br />
Company to establish and maintain sustainable customer relationships. In the first nine months of the 2012<br />
financial year, transport contracts were completed for 19,937 customers (prior year period: 19,072).<br />
Employees<br />
The <strong>Hapag</strong>-<strong>Lloyd</strong> Group employed a workforce of 7,033 as at 30 September 2012. The headcount<br />
increased by a total of 127 compared to last year because the Company stepped up its sales and service<br />
activities in India, China, Dubai and at its head offices, and it has also taken over new, larger vessels.<br />
Of the land-based employees, some 78% worked outside Germany as at 30 September 2012.<br />
Number of employees of employees<br />
30.9.2012 31.12.2011 30.9.2011<br />
Marine division 1,252 1,198 1,218<br />
Land division 5,568 5,465 5,464<br />
Apprentices 213 210 224<br />
Total 7,033 6,873 6,906<br />
As at 30 September 2012, 1,252 people were employed in the marine division (30 September 2011: 1,218).<br />
The number of staff in the land division rose by 104 to 5,568.<br />
The number of full-time equivalent employees (FTE) increased from 6,786 as at 30 September 2011 to<br />
6,885 (+99 employees).<br />
14
<strong>Hapag</strong>-lloyd interim group report 9M · 2012 I interim group management report<br />
Group earnings position<br />
Consolidated income statement<br />
in million EUR Q3 2012 Q3 2011 9M 2012 9M 2011<br />
Revenue 1,764.8 1,536.5 5,160.1 4,503.8<br />
Other operating income 83.1 1.8 174.4 111.7<br />
Transport expenses 1,530.9 1,346.1 4,638.1 3,891.8<br />
Personnel expenses 87.6 75.7 270.7 251.2<br />
Depreciation, amortisation and impairment 84.3 71.3 244.1 212.1<br />
Other operating expenses 75.4 33.2 208.4 227.0<br />
Operating result 69.7 12.0 –26.8 33.4<br />
Share of profits of equity-accounted investees 8.5 5.8 22.2 13.7<br />
Other financial result 1.6 16.3 5.5 15.8<br />
Group earnings before interest and tax (EBIT) 79.8 34.1 0.9 62.9<br />
Net interest result –33.5 –22.0 –91.7 –77.3<br />
Income taxes 0.7 2.5 3.3 8.7<br />
Group profit/loss 45.6 9.6 –94.1 –23.1<br />
EBITDA 164.1 105.4 245.0 275.0<br />
EBITDA margin (%) 9.3 6.9 4.7 6.1<br />
EBIT adjusted 86.6 36.7 17.9 78.8<br />
EBIT margin (%) adjusted 4.9 2.4 0.3 1.7<br />
EBIT 79.8 34.1 0.9 62.9<br />
EBIT margin (%) 4.5 2.2 0.0 1.4<br />
The first nine months of the 2012 financial year saw high, volatile bunker prices and a significant decline in<br />
global economic growth towards the end of the period. Both of these factors had a substantial effect on<br />
business developments at the <strong>Hapag</strong>-<strong>Lloyd</strong> Group. Competition also remained tough, which continued to<br />
impact on the Group’s earnings development.<br />
15
interim group management report I hapag-lloyd interim group report 9M · 2012<br />
Despite the difficult market environment, <strong>Hapag</strong>-<strong>Lloyd</strong>’s consolidated revenue rose by EUR 656.3 million in<br />
the first nine months of the 2012 financial year to EUR 5,160.1 million (prior year period: EUR 4,503.8 million).<br />
This positive trend resulted from a 2.3% increase in the transport volume, which reached 3,963 TTEU, and<br />
a rise in the average freight rate by 2.2% to USD 1,574/TEU. Exchange rate effects also helped. The average<br />
USD/EUR exchange rate strengthened to USD 1.28/EUR (prior year period: USD 1.41/EUR).<br />
Transport expenses<br />
in million EUR Q3 2012 Q3 2011 9M 2012 9M 2011<br />
Expenses for raw materials and supplies 380.7 331.0 1,234.9 921.3<br />
Cost of purchased services 1,150.2 1,015.1 3,403.2 2,970.5<br />
Transport expenses 1,530.9 1,346.1 4,638.1 3,891.8<br />
Transport expenses climbed by a total of EUR 746.3 million (19.2%) in the first nine months of 2012 to<br />
EUR 4,638.1 million. This increase resulted primarily from a 34.0% rise in expenses for raw materials<br />
and supplies. During the reporting period, the average bunker price was USD 665 per tonne (prior year<br />
period: USD 590 per tonne) – up approximately 13% on the same period of the previous year. The cost<br />
of purchased services rose by 14.6%. This was due to cost increases associated with inflation, energy<br />
prices and higher volumes and, in particular, the trend in the US dollar-euro exchange rate.<br />
At EUR 174.4 million, other operating income for the first nine months of 2012 exceeded the figure of<br />
EUR 111.7 million posted for the same period of the previous year. This rise was primarily attributable<br />
to income of EUR 92.1 million from container sales in conjunction with an operating sale and leaseback<br />
transaction. Other operating income also contained gains from derivatives for exchange rate risks.<br />
Changes in the USD/EUR exchange rate caused period-specific exchange rate gains and losses to<br />
decrease considerably in the period under review. This was reflected in other operating income and other<br />
operating expenses. On balance, exchange rate-related income and expenses resulted in a drop in<br />
earnings of EUR 28.3 million in the first nine months of 2012.<br />
16
<strong>Hapag</strong>-lloyd interim group report 9M · 2012 I interim group management report<br />
Compared with the previous year, depreciation and amortisation climbed from EUR 212.1 million to<br />
EUR 244.1 million. This was caused by regular depreciation on additions to the ship and container portfolios.<br />
The other financial result included changes in the fair value of currency options. Last year, the other financial<br />
result also included a discount of EUR 17.9 million from the early repayment of a shareholder loan.<br />
Due to high bunker and energy prices and a rise in other transport expenses, the Group’s operating result<br />
before interest and taxes (EBIT) amounted to EUR 0.9 million in the reporting period. It therefore fell short<br />
of last year’s nine-month figure (EUR 62.9 million). After taking into account depreciation and amortisation,<br />
EBITDA amounted to EUR 245.0 million for the first nine months of 2012 (prior year period: EUR 275.0 million).<br />
Adjusted for special items from the purchase price allocation, the Group reported an operating result<br />
before interest and taxes of EUR 17.9 million for the first nine months of the financial year (prior year period:<br />
EUR 78.8 million). The figure was not adjusted for income from container sales. The consequences of the<br />
financial and economic crisis in 2009 upset the normal rhythm of selling old containers and buying new<br />
ones. In light of the favourable situation on the secondary container market at present, a larger-scale sale<br />
and leaseback transaction was completed in the second and third quarters of 2012. Sales of containers are<br />
generally classed as typical, regular operating transactions for liner shipping companies. The adjusted EBIT<br />
stood at EUR 86.6 million in the third quarter. All in all, the Company therefore achieved substantially better<br />
earnings in the third quarter than in the nine months to September 2011 (adjusted EBIT: EUR 36.7 million).<br />
In the period under review, the Group generated a net result of EUR –94.1 million (prior year period:<br />
EUR –23.1 million). The Group generated earnings after tax of EUR 45.6 million in the third quarter of 2012<br />
(prior year period: EUR 9.6 million).<br />
17
interim group management report I hapag-lloyd interim group report 9M · 2012<br />
Group financial and net asset position<br />
condensed statement of cash flows<br />
in million EUR Q3 2012 Q3 2011 9M 2012 9M 2011<br />
Cash flow from operating activities 26.2 41.0 127.1 186.8<br />
Cash flow from investment activities –66.0 –100.7 –229.7 –128.0<br />
Free cash flow –39.8 –59.7 –102.6 58.8<br />
Cash flow from financing activities 139.3 46.3 9.3 –188.8<br />
Changes in cash and cash equivalents 99.5 –13.4 –93.3 –130.0<br />
Cash flow from operating activities<br />
Operating cash flow came to EUR 127.1 million in the first nine months of the 2012 financial year<br />
(prior year period: EUR 186.8 million).<br />
Cash flow from investment activities<br />
The cash outflow from investment activities amounted to EUR 229.7 million in the first nine months of 2012<br />
and resulted mainly from the purchase of container ships. Non-cash investments were also made by changing<br />
seven operating lease contracts into finance lease contracts. In the second quarter, <strong>Hapag</strong>-<strong>Lloyd</strong> signed an<br />
operating sale and leaseback agreement with an international container supplier. The agreement concerns<br />
the sale of some 85,000 containers which will be leased back until their final physical disposal. This sale<br />
was completed in two tranches. The first tranche of approximately 37,000 containers was sold in June 2012,<br />
followed by the second tranche of around 48,000 containers at the end of July 2012. This transaction<br />
generated a total liquidity inflow of USD 129.8 million (EUR 101.2 million).<br />
Cash flow from financing activities<br />
The net impact of the Company’s financing activities was a cash inflow of EUR 9.3 million. Cash inflows<br />
of EUR 406.7 million were offset by regular interest and capital repayments (EUR 260.5 million) and the<br />
repayment of hybrid capital II and associated interest (EUR 136.9 million). The newly received funds relate<br />
to loans to finance vessels and containers and from an increase in the programme established in 2011<br />
to securitise receivables.<br />
18
<strong>Hapag</strong>-lloyd interim group report 9M · 2012 I interim group management report<br />
Developments in cash and cash equivalents<br />
in million EUR Q3 2012 Q3 2011 9M 2012 9M 2011<br />
Cash and cash equivalents at beginning of period 493.3 590.1 672.5 751.8<br />
Changes due to changes in the group<br />
of consolidated companies 0.0 0.0 0.0 0.1<br />
Changes due to exchange rate fluctuations –14.1 23.8 –0.5 –21.4<br />
Net changes 99.5 –13.4 –93.3 –130.0<br />
Cash and cash equivalents at end of period 578.7 600.5 578.7 600.5<br />
Overall, the aggregate cash outflow totalled EUR 93.3 million in the first nine months of 2012, such that<br />
after accounting for exchange rate effects at the end of the reporting period, cash and cash equivalents of<br />
EUR 578.7 million were reported. The cash and cash equivalents dealt with in the statement of cash flows<br />
correspond to the balance sheet item “cash and cash equivalents”. In addition, there is an as yet unused<br />
credit facility worth USD 95 million (EUR 73.5 million).<br />
Sound financing structure<br />
At EUR 1,765.8 million, the Group’s net debt was higher as at 30 September 2012 than at year-end 2011.<br />
This was first and foremost due to new borrowing for the purpose of financing investments in ships and<br />
containers and the repayment of hybrid capital II totalling EUR 100.0 million. As already reported on 30 June<br />
2012, the con<strong>version</strong> of operating lease into finance lease contracts resulted in an increase of financial debt.<br />
financial solidity<br />
in million EUR 30.9.2012 31.12.2011<br />
Cash and cash equivalents 578.7 672.5<br />
Financial debt 2,344.5 1,896.5<br />
Net debt 1,765.8 1,224.0<br />
Gearing (%) 54.8 35.7<br />
Unused credit lines 73.5 73.4<br />
Equity ratio (%) 46.3 51.8<br />
19
interim group management report I hapag-lloyd interim group report 9M · 2012<br />
Changes in the asset structure<br />
condensed balance sheet<br />
in million EUR 30.9.2012 31.12.2011<br />
Assets<br />
Non-current assets 5,569.6 5,170.9<br />
thereof fixed assets 5,508.0 5,067.2<br />
Current assets 1,394.0 1,442.9<br />
thereof cash and cash equivalents 578.7 672.5<br />
Total assets 6,963.6 6,613.8<br />
Equity and liabilities<br />
Equity 3,224.6 3,424.4<br />
Borrowed capital 3,739.0 3,189.4<br />
thereof non-current liabilities 2,255.5 1,911.5<br />
thereof current liabilities 1,483.5 1,277.9<br />
thereof financial debt 2,344.5 1,896.5<br />
thereof non-current financial debt 2,022.8 1,689.3<br />
thereof current financial debt 321.7 207.2<br />
Total equity and liabilities 6,963.6 6,613.8<br />
Asset coverage ratio I (in %) 58.5 67.6<br />
Asset coverage ratio II (in %) 99.5 105.3<br />
Liquidity ratio I (in %) 39.0 52.6<br />
Net debt 1,765.8 1,224.0<br />
Equity ratio (in %) 46.3 51.8<br />
As at 30 September 2012, the Group’s balance sheet total was EUR 6,963.6 million – EUR 349.8 million<br />
higher than the figure from year-end 2011.<br />
While non-current assets increased by EUR 398.7 million, current assets decreased by EUR 48.9 million.<br />
Non-current assets increased due to investments of EUR 692.5 million, made largely in containers and<br />
ocean-going vessels. Key investments were the purchase of two previously leased ships, the con<strong>version</strong> of<br />
existing operating lease contracts into finance lease contracts for seven vessels, and the addition of new<br />
containers and two new container ships with a capacity of 13,200 TEU each. These factors were partly offset<br />
20
<strong>Hapag</strong>-lloyd interim group report 9M · 2012 I interim group management report<br />
in the reporting period by the sale of four ships with carrying amounts of approximately EUR 18 million, the<br />
disposal of containers with carrying amounts of EUR 9.1 million, and scheduled depreciation/amortisation<br />
totalling EUR 244.1 million.<br />
Within current assets, increases were seen in both trade accounts receivable and the market value of the<br />
current financial derivatives associated with fuel and currency hedges.<br />
Cash and cash equivalents fell by EUR 93.8 million to EUR 578.7 million (previous year: EUR 672.5 million)<br />
due to cash outflows for investments in ships and containers.<br />
On the liabilities side, equity (including non-controlling interests) contracted by EUR 199.8 million to a total<br />
of EUR 3,224.6 million as at 30 September 2012. The decline was primarily attributable to the Group<br />
negative net result and the partial repayment of hybrid capital II (EUR 100.0 million). On 12 April 2012,<br />
EUR 249.2 million was transferred to subscribed capital and capital reserves from hybrid capital II as part<br />
of a capital increase. The equity ratio was approximately 46% on 30 September 2012 (31 December 2011:<br />
approximately 52%).<br />
The rise in non-current and current liabilities resulted first and foremost from the increase in financial debt<br />
compared to year-end 2011. This was largely due to the con<strong>version</strong> of operating lease contracts for seven<br />
vessels into finance lease contracts along with the use of loans to invest in ships and containers. In addition<br />
to this, a credit financing agreement for a container portfolio was signed with a group of Japanese investors<br />
in the third quarter.<br />
Taking cash and cash equivalents and financial debt into account, net debt as at 30 September 2012 was<br />
EUR 1,765.8 million (31 December 2011: EUR 1,224.0 million).<br />
For further information on significant changes to specific balance sheet items, please refer to the Notes on<br />
the consolidated statement of financial position, which can be found in the “Notes” section.<br />
Risk and opportunity report<br />
Please refer to the 2011 annual report for details of specific opportunities and risks. At the time of reporting,<br />
there were no risks which threatened the continued existence of the <strong>Hapag</strong>-<strong>Lloyd</strong> Group. From today’s<br />
perspective, we do not anticipate any fundamental changes to the risk position.<br />
21
interim group management report I hapag-lloyd interim group report 9M · 2012<br />
In its rating update on 28 September 2012, the international rating agency Standard & Poor’s downgraded<br />
its issuer rating for <strong>Hapag</strong>-<strong>Lloyd</strong> Holding AG from BB– to B+. The outlook (“negative”) remained unchanged.<br />
The rating agency Moody’s reduced its rating from B1/“Negative Outlook” to B2/“Negative Outlook” on<br />
31 October.<br />
As described in the section “Risk and Opportunity” of the Group management report for 2010 and 2011, the<br />
downgrading of <strong>Hapag</strong>-<strong>Lloyd</strong> Holding AG’s rating and that of the bonds issued could result in less favourable<br />
conditions for raising new funds in the medium term and could adversely affect the trading price and the<br />
fungibility of the securities.<br />
There were no other major changes to the external environment or the Company’s internal conditions in the<br />
first nine months of 2012.<br />
events after the balance sheet date<br />
There were no significant transactions after the balance sheet date.<br />
outlook<br />
The statements made in the “Prospects” section of the Group management report for 2011 generally remain<br />
valid as regards the medium-term growth prospects for container shipping.<br />
Developments in important macroeconomic and sector-specific factors<br />
Influencing factor Developments in Q3 2012 Consequences in Q4 2012<br />
Global economic<br />
growth<br />
Transport volume<br />
Further reduction in the growth forecasts<br />
and increasing threat of a global recession<br />
Global demand for container transport services<br />
continues to increase slightly in 2012<br />
Weaker growth in volumes<br />
Slightly positive impact<br />
Transport costs Rise in bunker consumption prices Negative impact on costs<br />
Freight rates Further increases in rates announced Consequences unclear as weak global<br />
economy makes implementation difficult<br />
22
<strong>Hapag</strong>-lloyd interim group report 9M · 2012 I interim group management report<br />
In the medium term, demand for container transport services should continue to rise in tandem with expected<br />
ongoing growth in the world trading volume. IHS Global Insight Industry Intelligence (October 2012)<br />
anticipates a 4.4% increase in the global cargo volume to 131.9 million TEU in 2013. However, as the world<br />
economy is currently weak, the global cargo volume estimates have been reduced by 0.9% for 2012 and<br />
2.0% for 2013. Overall, the forecast rise in worldwide transport volumes in container shipping for 2012 and<br />
2013 should be in line with the rate of growth for global trade.<br />
However, the risks for the global economy increased further in the third quarter of 2012 according to the<br />
World Economic Outlook published by the International Monetary Fund (IMF) in October. The ongoing<br />
sovereign debt crisis in the eurozone is impairing Europe’s economic development. Economic growth in the<br />
USA is also somewhat disappointing at present, despite the Federal Reserve’s aggressive monetary policy.<br />
China – Asia’s largest economy – is experiencing a more rapid cool-down than anticipated. In light of these<br />
negative factors, the IMF has downgraded the current economic forecast again. It has reduced its growth<br />
estimate for 2012 by 0.2 percentage points and its 2013 outlook by 0.3 percentage points.<br />
Global demand for container transport services was substantially weaker than expected in the third quarter<br />
of 2012 – which is traditionally the peak season for container shipping – due to sluggish growth in the world<br />
economy. In addition to this, bunker prices remain comparatively high, exacerbating the industry’s cost<br />
position.<br />
In spite of these negative factors, <strong>Hapag</strong>-<strong>Lloyd</strong> is striving to achieve positive operating result again for the<br />
current financial year, provided that there is no fundamental escalation of the risks in the fourth quarter of<br />
2012. <strong>Hapag</strong>-<strong>Lloyd</strong> expects the liquidity situation to remain adequate for the full year, despite the effect of<br />
higher investments in newbuilds and the ship portfolio on net debt. All of the planned ship and container<br />
investments are funded through long-term loan agreements.<br />
23
interim consolidated financial statements I hapag-lloyd interim group report 9M · 2012<br />
Interim consolidated financial<br />
statements<br />
Consolidated income statement<br />
Consolidated income statement of <strong>Hapag</strong>-<strong>Lloyd</strong> Holding AG<br />
for the period 1 January to 30 september 2012<br />
in million EUR Q3 Q3 9M 9M<br />
2012 2011 2012 2011<br />
Revenue 1,764.8 1,536.5 5,160.1 4,503.8<br />
Other operating income 83.1 1.8 174.4 111.7<br />
Transport expenses 1,530.9 1,346.1 4,638.1 3,891.8<br />
Personnel expenses 87.6 75.7 270.7 251.2<br />
Depreciation, amortisation and impairment of intangible assets<br />
and property, plant and equipment 84.3 71.3 244.1 212.1<br />
Other operating expenses 75.4 33.2 208.4 227.0<br />
Operating result 69.7 12.0 –26.8 33.4<br />
Share of profit of equity-accounted investees 8.5 5.8 22.2 13.7<br />
Other financial result 1.6 16.3 5.5 15.8<br />
Earnings before interest and tax (EBIT) 79.8 34.1 0.9 62.9<br />
Interest income 1.6 2.7 4.9 7.5<br />
Interest expenses 35.1 24.7 96.6 84.8<br />
Earnings before income taxes 46.3 12.1 –90.8 –14.4<br />
Income taxes 0.7 2.5 3.3 8.7<br />
Group profit/loss 45.6 9.6 –94.1 –23.1<br />
thereof attributable to shareholders of <strong>Hapag</strong>-<strong>Lloyd</strong> Holding AG 45.4 9.6 –94.6 –23.1<br />
thereof attributable to non-controlling interests 0.2 0.0 0.5 0.0<br />
24
<strong>Hapag</strong>-lloyd interim group report 9M · 2012 I interim consolidated financial statements<br />
Consolidated statement of comprehensive income<br />
Consolidated statement of comprehensive income of <strong>Hapag</strong>-<strong>Lloyd</strong> Holding AG<br />
for the period 1 January to 30 september 2012<br />
in million EUR Q3 Q3 9M 9M<br />
2012 2011 2012 2011<br />
Group profit/loss 45.6 9.6 –94.1 –23.1<br />
Cash flow hedges (no tax effect) 8.5 –70.9 6.6 –10.2<br />
Addition to other comprehensive income (OCI) 18.0 –9.0 29.7 158.3<br />
Reclassification to income statement due to realisation –9.5 –61.9 –23.1 –168.5<br />
Actuarial gains (+) and losses (–) from pension provisions<br />
and related fund assets, after tax –16.5 1.1 –16.8 1.3<br />
Actuarial gains (+) and losses (–) from pension provisions<br />
and related fund assets, before tax –16.5 1.1 –16.8 1.3<br />
Tax effect - - - -<br />
Currency translation (no tax effect) –76.2 185.5 4.3 –21.6<br />
Other comprehensive income –84.2 115.7 –5.9 –30.5<br />
Total comprehensive income –38.6 125.3 –100.0 –53.6<br />
thereof attributable to shareholders of <strong>Hapag</strong>-<strong>Lloyd</strong> Holding AG –38.8 125.3 –100.5 –53.6<br />
thereof attributable to non-controlling interests 0.2 - 0.5 -<br />
25
interim consolidated financial statements I hapag-lloyd interim group report 9M · 2012<br />
Consolidated statement of financial position<br />
Consolidated statement of financial position of <strong>Hapag</strong>-<strong>Lloyd</strong> Holding AG<br />
as AT 30 september 2012<br />
in million EUR 30.9.2012 31.12.2011<br />
Assets<br />
Goodwill 708.1 707.3<br />
Other intangible assets 670.1 729.6<br />
Property, plant and equipment 3,809.6 3,314.4<br />
Investments in equity-accounted investees 320.2 315.9<br />
Other assets 22.5 43.8<br />
Derivative financial instruments 25.8 46.9<br />
Deferred tax assets 13.3 13.0<br />
Non-current assets 5,569.6 5,170.9<br />
Inventories 199.7 208.7<br />
Trade accounts receivable 436.1 419.6<br />
Other assets 124.0 106.5<br />
Derivative financial instruments 42.9 17.1<br />
Income tax receivables 12.6 7.7<br />
Cash and cash equivalents 578.7 672.5<br />
Non-current assets held for sale 0.0 10.8<br />
Current assets 1,394.0 1,442.9<br />
Total assets 6,963.6 6,613.8<br />
26
<strong>Hapag</strong>-lloyd interim group report 9M · 2012 I interim consolidated financial statements<br />
Consolidated statement of financial position of <strong>Hapag</strong>-<strong>Lloyd</strong> Holding AG<br />
as At 30 september 2012<br />
in million EUR 30.9.2012 31.12.2011<br />
Equity and liabilities<br />
Subscribed capital 66.1 60.0<br />
Capital reserves 3,269.8 3,026.6<br />
Retained earnings –156.0 –61.3<br />
Cumulative other equity 44.0 49.9<br />
Hybrid capital 0.0 348.9<br />
Equity attributable to the shareholders<br />
of <strong>Hapag</strong>-<strong>Lloyd</strong> Holding AG 3,223.9 3,424.1<br />
Non-controlling interests 0.7 0.3<br />
Equity 3,224.6 3,424.4<br />
Provisions for pensions and similar obligations 126.5 104.8<br />
Other provisions 93.4 110.1<br />
Financial debt 2,022.8 1,689.3<br />
Other liabilities 5.4 5.8<br />
Derivative financial instruments 5.8 0.0<br />
Deferred tax liabilities 1.6 1.5<br />
Non-current liabilities 2,255.5 1,911.5<br />
Provisions for pensions and similar obligations 5.0 5.1<br />
Other provisions 115.9 129.4<br />
Income tax liabilities 5.6 4.3<br />
Financial debt 321.7 207.2<br />
Trade accounts payable 925.5 791.8<br />
Other liabilities 109.8 140.1<br />
Current liabilities 1,483.5 1,277.9<br />
Total equity and liabilities 6,963.6 6,613.8<br />
27
interim consolidated financial statements I hapag-lloyd interim group report 9M · 2012<br />
Consolidated statement of changes in equity<br />
Consolidated statement of changes in equity of <strong>Hapag</strong>-<strong>Lloyd</strong> Holding AG for the period 1 January to 30 september 2012<br />
in million EUR Equity attributable to shareholders of <strong>Hapag</strong>-<strong>Lloyd</strong> Holding AG Non- Total<br />
Capital Sub- Capital Retained Reserve Actuarial Translation Cumulative Hybrid Total con- equity<br />
provided by scribed reserves earnings for gains reserve other capital trolling<br />
limited capital cash flow and losses equity interests<br />
partners hedges<br />
As per 1.1.2011 3,086.6 - - 0.0 36.1<br />
Total comprehensive<br />
income - - - –23.1 –10.2 1.3<br />
–15.4 –22.4 –1.7 357.6 3,442.5 0.3 3,442.8<br />
–21.6 –30.5 - –53.6 - –53.6<br />
Transactions with<br />
shareholders –3,086.6 60.0 3,026.6 –20.6 - - - - 16.3 –4.3 - –4.3<br />
thereof<br />
Paid interest hybrid I - - - - - - - - –4.3 –4.3 - –4.3<br />
Interest from hybrid II - - - –20.6 - - - - 20.6 - - -<br />
Change of legal form –3,086.6 60.0 3,026.6 - - - - - - - - -<br />
As per 30.9.2011 - 60.0 3,026.6 –43.7 25.9 –14.1 –44.0 –32.2 373.9 3,384.6 0.3 3,384.9<br />
As per 1.1.2012 - 60.0 3,026.6 –61.3 -<br />
–23.7 73.6 49.9 348.9 3,424.1 0.3 3,424.4<br />
Total comprehensive<br />
income - - - –94.6 6.6 –16.8 4.3 –5.9 - –100.5 0.5 –100.0<br />
Transactions with<br />
shareholders - 6.1 243.2 –0.1 - - - - –348.9 –99.7 –0.1 –99.8<br />
thereof<br />
Partial repayment<br />
of hybrid II - - - - - - - - –100.0 –100.0 - –100.0<br />
Realisation<br />
transaction costs - - - - - - - - 0.3 0.3 - 0.3<br />
Capital increase from<br />
contribution of hybrid II - 6.1 243.9 - - - - - –250.0 - - -<br />
Reclassification<br />
transaction costs - - –0.7 –0.1 - - - - 0.8 - - -<br />
Distribution to<br />
non-controlling interests - - - - - - - - - - –0.1 –0.1<br />
As per 30.9.2012 - 66.1 3,269.8 –156.0 6.6<br />
–40.5 77.9 44.0 - 3,223.9 0.7 3,224.6<br />
28
<strong>Hapag</strong>-lloyd interim group report 9M · 2012 I interim consolidated financial statements<br />
Condensed consolidated statement of cash flows<br />
Condensed consolidated statement of cash flows of <strong>Hapag</strong>-<strong>Lloyd</strong> Holding AG<br />
for the period 1 January to 30 september 2012<br />
in million EUR Q3 Q3 9M 9M<br />
2012 2011 2012 2011<br />
Cash inflow(+)/outflow(–) from operating activities 26.2 41.0 127.1 186.8<br />
Cash inflow(+)/outflow(–) from investing activities –66.0 –100.7 –229.7 –128.0<br />
Cash inflow(+)/outflow(–) from financing activities 139.3 46.3 9.3 –188.8<br />
Net change in cash and cash equivalents 99.5 –13.4 –93.3 –130.0<br />
Cash and cash equivalents at beginning of the period 493.3 590.1 672.5 751.8<br />
Change in cash and cash equivalents due to a change<br />
of consolidated companies 0.0 0.0 0.0 0.1<br />
Change in cash and cash equivalents due to exchange<br />
rate fluctuations –14.1 23.8 –0.5 –21.4<br />
Net change in cash and cash equivalents 99.5 –13.4 –93.3 –130.0<br />
Cash and cash equivalents at the end of the period 578.7 600.5 578.7 600.5<br />
29
condensed group notes I hapag-lloyd interim group report 9M · 2012<br />
Condensed notes to the interim<br />
Consolidated financial statements<br />
Notes on the principles and methods underlying the<br />
interim consolidated financial statements<br />
General notes<br />
The presented condensed interim consolidated financial statements of <strong>Hapag</strong>-<strong>Lloyd</strong> Holding AG and its<br />
subsidiaries, hereinafter referred to as <strong>Hapag</strong>-<strong>Lloyd</strong> Group, were prepared for the interim report according<br />
to the International Financial Reporting Standards (IFRS) and the relevant interpretations by the International<br />
Accounting Standards Board (IASB) as they are to be applied in the European Union (EU). Therefore, these<br />
financial statements to the interim report in accordance with IAS 34 do not contain all information and<br />
notes that are necessary according to IFRS for complete consolidated financial statements to the end of a<br />
financial year.<br />
The presented interim consolidated financial statements cover the period 1 January to 30 September 2012.<br />
The accounting principles and methods applied in the interim consolidated financial statements are the same<br />
as those used for the last consolidated financial statements at the end of the financial year.<br />
Results of interim periods are not necessarily indicative of results that can be expected for future periods<br />
or the entire financial year. The earnings position of the <strong>Hapag</strong>-<strong>Lloyd</strong> Group is principally shaped by the<br />
seasonality of transport volumes and freight rates in the container shipping business. Fluctuations result from<br />
the usually higher demand for transport services in the container shipping business during the second and<br />
third quarters.<br />
The interim consolidated financial statements are presented in euros (EUR). All amounts recognised for the<br />
financial year are reported in million euros (EUR million) unless otherwise stated.<br />
The functional currency of <strong>Hapag</strong>-<strong>Lloyd</strong> AG and its subsidiaries is the US dollar. The reporting currency<br />
of <strong>Hapag</strong>-<strong>Lloyd</strong> Holding AG, however, is the euro. For the purpose of integrating <strong>Hapag</strong>-<strong>Lloyd</strong> AG and its<br />
subsidiaries into the financial statements of the <strong>Hapag</strong>-<strong>Lloyd</strong> Group, balance sheet assets and liabilities<br />
are translated into euros as at the reporting date (closing date rate) using the middle rate of that day. The<br />
expenses, income and the result recognised in the statement of cash flows and the Group income statement<br />
are translated using the average rate for the reporting period. The resulting differences are recognised<br />
directly in other comprehensive income.<br />
As at 30 September 2012 the USD/EUR exchange rate was virtually on par with the rate on 31 December<br />
2011 (closing date rate: 30 September 2012 USD/EUR 1.2922; 31 December 2011 USD/EUR 1.2937).<br />
At USD/EUR 1.2824, the average rate for the first nine months of 2012 remained below the average rate<br />
for the prior year period of USD/EUR 1.4065.<br />
30
<strong>Hapag</strong>-lloyd interim group report 9M · 2012 I condensed group notes<br />
Segment reporting<br />
Since <strong>Hapag</strong>-<strong>Lloyd</strong> Holding AG at the time of the preparation of the interim financial statements as at<br />
30 September 2012 neither traded bonds or equity instruments on any public market nor presented the<br />
consolidated financial statements to regulatory authorities for the issuing of instruments, there was no<br />
obligation to prepare any segment reporting as at the reporting date.<br />
New accounting standards<br />
The following change to an existing standard published by the IASB, which has already been endorsed, had<br />
to be applied for the first time in the interim financial statements presented. However, the first-time application<br />
did not have a significant effect on the net asset, financial or earnings position of the <strong>Hapag</strong>-<strong>Lloyd</strong><br />
Group:<br />
• Amendment to IFRS 7 Financial Instruments: Disclosures<br />
The amendment to IFRS 7 Financial Instruments: Disclosures relates to the disclosure obligations associated<br />
with transferring financial assets. In particular, any remaining or acquired rights and obligations now have to<br />
be disclosed in full, even if the financial asset is no longer held within the financial statements.<br />
Consolidated companies<br />
The consolidated financial statements include all significant subsidiaries and investments accounted for using<br />
the equity method. Within the interim financial statements as at 30 September 2012 <strong>Hapag</strong>-<strong>Lloyd</strong> Holding<br />
AG and 49 companies were fully consolidated, and five additional companies were included using the equity<br />
method.<br />
<strong>Hapag</strong>-<strong>Lloyd</strong> (Asia) Pte. Ltd., Singapore, and <strong>Hapag</strong>-<strong>Lloyd</strong> (Singapore) Pte. Ltd., Singapore, were merged<br />
effective 1 January 2012 and now trade as <strong>Hapag</strong>-<strong>Lloyd</strong> Pte. Ltd., Singapore.<br />
<strong>Hapag</strong>-<strong>Lloyd</strong> Agency L.L.C., Dubai, commenced its operating activities in the first quarter of 2012 and was<br />
therefore fully consolidated for the first time.<br />
In the second quarter of 2012, <strong>Hapag</strong>-<strong>Lloyd</strong> AG acquired the remaining 49% stake in <strong>Hapag</strong>-<strong>Lloyd</strong><br />
Vietnam Ltd., Ho Chi Minh City, which was already fully consolidated. It now holds 100% of the firm’s<br />
shares. This did not affect the group of consolidated companies.<br />
31
condensed group notes I hapag-lloyd interim group report 9M · 2012<br />
Selected notes to the consolidated income statement<br />
Revenue was primarily generated from the rendering of transport services. The increase in revenue<br />
compared with the prior year period was primarily attributable to a larger transport volume, a higher<br />
average freight rate and positive exchange rate effects.<br />
The revenue includes proportional income from unfinished voyages as at the reporting date.<br />
Transport expenses mainly comprise fuel costs, expenditure for port, terminal and container transport<br />
services, chartering, leases and container rental expenses, maintenance and repair costs, and charges<br />
for other services. Expenses were up on the prior year period due to rising costs associated with inflation,<br />
energy prices and higher volumes. The trend in the US dollar-euro exchange rate and, in particular,<br />
higher fuel costs arising from an increase in bunker prices also played a role.<br />
The interest result essentially comprises interest expenses for bank loans and bonds.<br />
32
<strong>Hapag</strong>-lloyd interim group report 9M · 2012 I condensed group notes<br />
Selected notes to the consolidated statement of financial position<br />
Goodwill<br />
Goodwill rose slightly by EUR 0.8 million compared with 31 December 2011 due to the USD/EUR<br />
exchange rate.<br />
Property, plant and equipment<br />
property, plant and equipment<br />
in million EUR 30.9.2012 31.12.2011<br />
Vessels 2,902.1 2,416.9<br />
Container, chassis 374.5 310.3<br />
Other equipment 119.9 120.6<br />
Prepayments on account and assets under construction 413.1 466.6<br />
Total 3,809.6 3,314.4<br />
The changes in property, plant and equipment were primarily additions to ocean-going vessels and<br />
containers amounting to EUR 473.3 million and prepayments for newbuild vessels ordered totalling<br />
EUR 214.0 million.<br />
Firstly, two ships from previous operating lease contracts were purchased in the first quarter of 2012. In<br />
addition, seven operating lease contracts for vessels and one operating lease contract for containers were<br />
amended, obliging <strong>Hapag</strong>-<strong>Lloyd</strong> to buy the assets at the end of the lease agreement. These agreements<br />
are now classified as finance lease contracts. The contracts state that legal ownership will be transferred<br />
at the end of the non-cancellable terms between 2013 and 2015. As at 30 September 2012, the vessels<br />
recognised in connection with the finance lease contracts had a total carrying value of EUR 231.9 million;<br />
the containers were recognised at EUR 12.4 million as at 30 September 2012.<br />
33
condensed group notes I hapag-lloyd interim group report 9M · 2012<br />
The reconciliation statement below shows the future minimum lease payments and their net present value:<br />
in million EUR Total Maturity<br />
30.9.2012 < 1 year 1–5 years<br />
Future minimum lease payments 257.2 31.5 225.7<br />
Interest component 32.9 14.4 18.5<br />
Net present value 224.3 17.1 207.2<br />
There are no future minimum lease payments which fall due after more than five years.<br />
In the reporting period four ships were sold and in the third quarter <strong>Hapag</strong>-<strong>Lloyd</strong> took delivery of two newly<br />
built ships.<br />
Disposals of containers as part of a sale and leaseback transaction resulted in income of USD 118.1 million<br />
(EUR 92.1 million).<br />
Due to the changed market conditions in the secondary container market, the anticipated residual values<br />
have been reassessed and adjusted accordingly in the first six months of 2012.<br />
Non-current assets held for sale<br />
The two vessels which, in view of the intention to sell them, were reported as assets held for sale in<br />
accordance with IFRS 5 as at 31 December 2011 were sold in the first half of 2012.<br />
Derivative financial instruments<br />
Derivative financial instruments include positive and negative market values from currency forward contracts<br />
and commodity and currency options.<br />
34
<strong>Hapag</strong>-lloyd interim group report 9M · 2012 I condensed group notes<br />
Equity<br />
As at 30 September 2012, <strong>Hapag</strong>-<strong>Lloyd</strong> Holding AG’s subscribed capital is divided into 66.1 million<br />
(31 December 2011: 60.0 million) no-par registered shares with equal rights.<br />
In February 2012, EUR 100.0 million of hybrid capital II was paid back to TUI AG. The “Albert Ballin“<br />
consortium also acquired 50% of the remaining hybrid capital II from TUI AG effective 30 March 2012.<br />
The entry into the commercial register on 12 April 2012 completed a capital increase involving the<br />
contribution of EUR 125.0 million of hybrid capital II each by the “Albert Ballin“ consortium and TUI AG<br />
to <strong>Hapag</strong>-<strong>Lloyd</strong> Holding AG in exchange for new shares from previously authorised capital. This caused<br />
subscribed capital to grow to EUR 66.1 million and prompted a EUR 243.2 million addition to capital<br />
reserves, after allowing for transaction costs.<br />
The reserve for cash flow hedges includes changes in the fair value of hedging transactions recognised<br />
directly in equity and amounted to EUR 6.6 million as at 30 September 2012 (30 September 2011:<br />
EUR 25.9 million).<br />
The reserve for actuarial gains and losses (30 September 2012: EUR –40.5 million; 30 September 2011:<br />
EUR –14.1 million) results from gains and losses taken directly to equity which arose, for example, from the<br />
change in actuarial parameters in conjunction with the valuation of pension obligations and the associated<br />
fund assets.<br />
The effects arising from currency translation recorded in the first nine months of 2012 totalled EUR 4.3 million<br />
(prior year period: EUR –21.6 million). This contains differences from the translation of subsidiary financial<br />
statements prepared in a foreign currency and from the con<strong>version</strong> of goodwill carried in foreign currency.<br />
35
condensed group notes I hapag-lloyd interim group report 9M · 2012<br />
Other provisions<br />
During the purchase price allocation, existing contracts were identified, the contractual terms of which at<br />
the time of acquisition substantiated negative fair values compared with the current market conditions. The<br />
amortisation of these items in the first nine months of the financial year 2012 led to a reduction in transport<br />
expenses.<br />
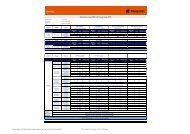
Financial debt<br />
Financial debt<br />
in million EUR 30.9.2012 31.12.2011<br />
Liabilities to banks 1,460.2 1,239.1<br />
Bonds 658.6 655.9<br />
Liabilities from finance lease contracts 224.3 0.0<br />
Other financial debt 1.4 1.5<br />
Total 2,344.5 1,896.5<br />
Financial debt by currency exposure<br />
in million EUR 30.9.2012 31.12.2011<br />
Financial debt denoted in USD (excl. transaction costs) 1,729.2 1,273.6<br />
Financial debt denoted in EUR (excl. transaction costs) 627.9 646.5<br />
Interest liabilities 35.7 22.1<br />
Accounting for transaction costs –48.3 –45.7<br />
Total 2,344.5 1,896.5<br />
36
<strong>Hapag</strong>-lloyd interim group report 9M · 2012 I condensed group notes<br />
In the first quarter of 2012, existing long-term operating lease contracts for seven ships and a container<br />
portfolio were amended, obliging <strong>Hapag</strong>-<strong>Lloyd</strong> to purchase the relevant leased assets at the end of the<br />
lease tenures. These agreements are therefore now classified as finance lease contracts. The associated<br />
payables were posted as liabilities.<br />
Liabilities to banks rose in conjunction with financing arrangements for the acquisition of two vessels<br />
from previous operating lease contracts and due to payments for the first two tranches of the K-sure II<br />
financing package for the newbuilds “Hamburg Express” and “New York Express”.<br />
An agreement was also signed in the third quarter of 2012 for a total of up to USD 165 million<br />
(EUR 127.7 million) to finance the acquisition of new containers and those already in use. These funds<br />
will be drawn down in line with actual container orders. The Company had associated liabilities of<br />
USD 35.5 million (EUR 27.5 million) on the reporting date.<br />
A container portfolio was also sold to a group of Japanese investors in the third quarter of 2012 and leased<br />
back as part of a 3.5-year lease agreement. The container lease is classed as credit financing in accordance<br />
with SIC-27 Evaluating the substance of transactions involving the legal form of a lease because there is<br />
a high probability that the containers will be transferred back to <strong>Hapag</strong>-<strong>Lloyd</strong> at the end of the lease based<br />
on the attractive purchase option included in the agreement. The lease agreement is essentially a form of<br />
borrowing with the container portfolio transferred by way of security. Accordingly, the containers are still being<br />
reported and amortised in the Group.<br />
37
condensed group notes I hapag-lloyd interim group report 9M · 2012<br />
Notes to the condensed consolidated statement of cash flows<br />
Ordinary business activities resulted in an inflow of cash and cash equivalents totalling EUR 127.1 million<br />
(prior year period: EUR 186.8 million).<br />
The cash outflow from investing activities amounted to EUR 229.7 million in the first nine months of<br />
the financial year 2012 (prior year period: EUR 128.0 million). EUR 391.1 million (prior year period:<br />
EUR 186.7 million) was paid for investments in property, plant and equipment, intangible assets and other<br />
non-current assets in the first nine months of the financial year 2012. These payments relate primarily to the<br />
acquisition of two vessels from previous operating lease contracts, payments in conjunction with the delivery<br />
of two newbuilds, prepayments for additional newbuilds and the purchase of new containers. These were<br />
partly offset by incoming payments from the sale of property, plant and equipment and other non-current<br />
assets as well as dividends received totalling EUR 161.4 million (prior year period: EUR 58.7 million). The<br />
incoming payments were primarily generated by the sale of four ships and two tranches of a container sale<br />
and leaseback transaction, which involves selling a total of 85,000 containers and leasing them back until<br />
their final return.<br />
In the first nine months of 2012, the inflow of cash and cash equivalents from financing activities amounted<br />
to EUR 9.3 million (prior year period: outflow of EUR 188.8 million). This resulted primarily from inflows<br />
of funds totalling EUR 406.7 million. These inflows were offset by regular interest and capital repayments<br />
(EUR 260.5 million) and the repayment of hybrid capital II and associated interest (EUR 136.9 million).<br />
38
<strong>Hapag</strong>-lloyd interim group report 9M · 2012 I condensed group notes<br />
Other notes<br />
Legal disputes<br />
Since May 2011, the European Commission has been examining whether EU competition law has been violated<br />
since the exemption regulation for liner conferences was abolished in October 2008. <strong>Hapag</strong>-<strong>Lloyd</strong> is<br />
also affected by the investigations. The Company believes that the transport services were provided in line<br />
with EU competition regulations.<br />
Other financial obligations<br />
In addition to the purchase obligations for investments in container ships, the Group’s other financial obligations<br />
contain charter and lease agreements for ships and containers, and rental payments for business<br />
premises, in particular for the central administration building in Rosenstrasse. The agreements have terms<br />
of between one year and 19 years and some include prolongation and purchase options as well as price<br />
adjustment clauses. Some of the rental agreements for buildings include agreements regarding conditional<br />
rental payments based on the consumer price index for Germany.<br />
In the first nine months of 2012, charter, rental and lease payments of EUR 567.7 million (prior year period:<br />
EUR 498.0 million) were posted to expenses.<br />
The total other financial obligations can be broken down as follows:<br />
in million EUR 30.9.2012 31.12.2011<br />
Vessels and containers 808.5 1,200.1<br />
Administrative buildings 118.7 126.5<br />
Other 127.4 162.5<br />
Rent 1,054.6 1,489.1<br />
Purchase commitments 639.3 744.1<br />
Total 1,693.9 2,233.2<br />
Fair value 1,636.0 2,087.0<br />
39
condensed group notes I hapag-lloyd interim group report 9M · 2012<br />
Other financial obligations declined in the first nine months of 2012. This was due in part to the restructuring<br />
of nine existing operating lease contracts, which meant that the Company acquired two ships while the<br />
agreements for the remaining seven vessels were converted into finance lease contracts. Other financial<br />
obligations rose only marginally due to the completed container sale and leaseback transaction.<br />
The fair value of the other financial obligations was ascertained by discounting the future expenses while<br />
applying a market interest rate of 2.0% p. a. (31 December 2011: 3.1% p. a.).<br />
Related party transactions<br />
In carrying out its ordinary business activities, the <strong>Hapag</strong>-<strong>Lloyd</strong> Group maintains indirect or direct relationships<br />
with related companies and individuals and with its own subsidiaries included in the consolidated<br />
financial statements. All of the transactions with related parties were executed on the basis of international<br />
price comparison methods in accordance with IAS 24 on terms that are also usual with non-Group third<br />
parties. Further information on related parties is included in the Notes to the consolidated financial statements<br />
for 2011 under “Other notes”.<br />
Significant transactions after the balance sheet date<br />
There were no significant transactions after the balance sheet date.<br />
40
<strong>Hapag</strong>-lloyd interim group report 9M · 2012 I<br />
Hamburg, 13 November 2012<br />
<strong>Hapag</strong>-<strong>Lloyd</strong> Holding AG<br />
The Executive Board<br />
Michael Behrendt<br />
Peter Ganz Ulrich Kranich Jesper Praestensgaard<br />
41
financial calendar I hapag-lloyd interim group report 9M · 2012<br />
Financial calendar 2013<br />
March 2013 Publication of annual financial statements and annual report 2012<br />
May 2013 Publication of interim report for first quarter of 2013<br />
August 2013 Publication of interim report for second quarter/first six months of 2013<br />
November 2013 Publication of interim report for third quarter/first nine months of 2013<br />
Im<strong>print</strong><br />
<strong>Hapag</strong>-<strong>Lloyd</strong> AG<br />
Ballindamm 25<br />
20095 Hamburg<br />
Investor Relations<br />
Telephone: +49 (0)40 3001-9150<br />
Fax: +49 (0)40 3001-9155<br />
Group Communication<br />
Telephone: +49 (0)40 3001-2529<br />
Fax: +49 (0)40 335360<br />
www.hapag-lloyd.com<br />
42
© <strong>Hapag</strong>-<strong>Lloyd</strong> Group Communication 11/2012<br />
<strong>Hapag</strong>-<strong>Lloyd</strong> AG · Ballindamm 25 · 20095 Hamburg · www.hapag-lloyd.com