Acoustic Emission Monitoring of CFRP Laminated Composites ...
Acoustic Emission Monitoring of CFRP Laminated Composites ...
Acoustic Emission Monitoring of CFRP Laminated Composites ...

You also want an ePaper? Increase the reach of your titles
YUMPU automatically turns print PDFs into web optimized ePapers that Google loves.
28 Chapter 3. <strong>Acoustic</strong> <strong>Emission</strong><br />
surface <strong>of</strong> the composite, the transducer's pressure against the composite,<br />
and the coupling medium. 126<br />
The presence <strong>of</strong> a transducer aects the<br />
vibration <strong>of</strong> the composite; however, this is unavoidable when using contact<br />
transducers. The direction <strong>of</strong> the waves also aect the transducer's<br />
response. This is because AE transducers are nearly always designed to<br />
measure the components <strong>of</strong> the AE waves that are normal to the surface. 127<br />
Although the stress waves typically have components in the normal direction<br />
this directionality means that the response to identical waves arriving<br />
from dierent direction will not be the same.<br />
The selection <strong>of</strong> transducers is most <strong>of</strong>ten based on their frequency<br />
response curves, also known as calibration curves. These curves can be<br />
absolute or relative. The most typical calibration curves are relative displacement<br />
and pressure response curves. Relative curves are useful for<br />
comparison <strong>of</strong> transducers. The curves are generated by exciting transducers<br />
with continuous sine waves. The resulting response curves do not<br />
provide information about the response to signals arriving from dierent<br />
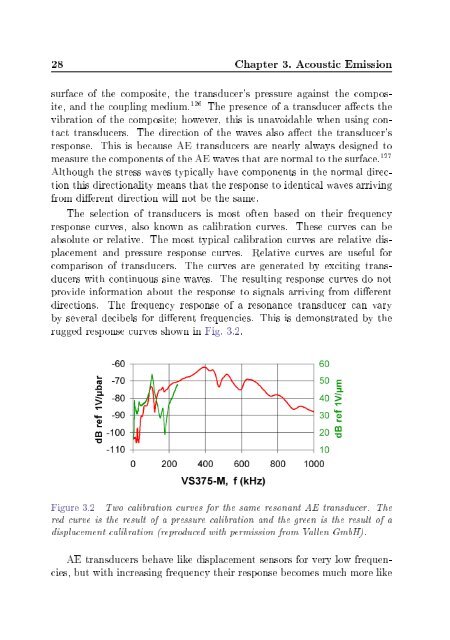
directions. The frequency response <strong>of</strong> a resonance transducer can vary<br />
by several decibels for dierent frequencies. This is demonstrated by the<br />
rugged response curves shown in Fig. 3.2.<br />
Figure 3.2 Two calibration curves for the same resonant AE transducer. The<br />
red curve is the result <strong>of</strong> a pressure calibration and the green is the result <strong>of</strong> a<br />
displacement calibration (reproduced with permission from Vallen GmbH).<br />
AE transducers behave like displacement sensors for very low frequencies,<br />
but with increasing frequency their response becomes much more like