anglicky - Institute of Hydrobiology
anglicky - Institute of Hydrobiology
anglicky - Institute of Hydrobiology

Create successful ePaper yourself
Turn your PDF publications into a flip-book with our unique Google optimized e-Paper software.
5.5 Importance <strong>of</strong> dissolved organic carbon for phytoplankton nutrition in a eutrophic<br />
reservoir<br />
This study was supported by the Grant Agency <strong>of</strong> the Czech Republic<br />
(Project No. 206/07/P407)<br />
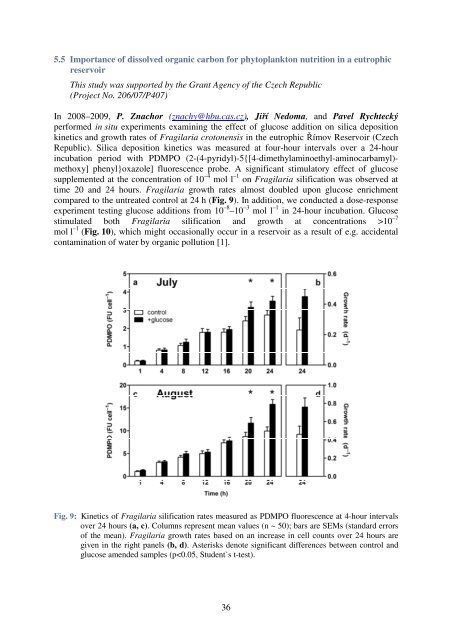
In 2008–2009, P. Znachor (znachy@hbu.cas.cz), Jiří Nedoma, and Pavel Rychtecký<br />
performed in situ experiments examining the effect <strong>of</strong> glucose addition on silica deposition<br />
kinetics and growth rates <strong>of</strong> Fragilaria crotonensis in the eutrophic Římov Reservoir (Czech<br />
Republic). Silica deposition kinetics was measured at four-hour intervals over a 24-hour<br />
incubation period with PDMPO (2-(4-pyridyl)-5{[4-dimethylaminoethyl-aminocarbamyl)-<br />
methoxy] phenyl}oxazole] fluorescence probe. A significant stimulatory effect <strong>of</strong> glucose<br />
supplemented at the concentration <strong>of</strong> 10 –4 mol l –1 on Fragilaria silification was observed at<br />
time 20 and 24 hours. Fragilaria growth rates almost doubled upon glucose enrichment<br />
compared to the untreated control at 24 h (Fig. 9). In addition, we conducted a dose-response<br />
experiment testing glucose additions from 10 –8 –10 –3 mol l –1 in 24-hour incubation. Glucose<br />
stimulated both Fragilaria silification and growth at concentrations >10 –7<br />
mol l –1 (Fig. 10), which might occasionally occur in a reservoir as a result <strong>of</strong> e.g. accidental<br />
contamination <strong>of</strong> water by organic pollution [1].<br />
Fig. 9: Kinetics <strong>of</strong> Fragilaria silification rates measured as PDMPO fluorescence at 4-hour intervals<br />
over 24 hours (a, c). Columns represent mean values (n ~ 50); bars are SEMs (standard errors<br />
<strong>of</strong> the mean). Fragilaria growth rates based on an increase in cell counts over 24 hours are<br />
given in the right panels (b, d). Asterisks denote significant differences between control and<br />
glucose amended samples (p