Annual Report 2011 - Hongkong Land
Annual Report 2011 - Hongkong Land
Annual Report 2011 - Hongkong Land

You also want an ePaper? Increase the reach of your titles
YUMPU automatically turns print PDFs into web optimized ePapers that Google loves.
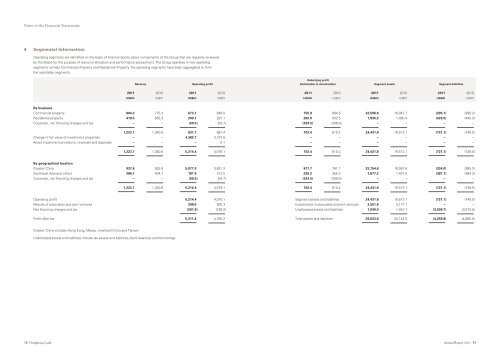
Notes to the Financial Statements<br />
4 Segmental Information<br />
Operating segments are identified on the basis of internal reports about components of the Group that are regularly reviewed<br />
by the Board for the purpose of resource allocation and performance assessment. The Group operates in two operating<br />
segments namely Commercial Property and Residential Property. No operating segments have been aggregated to form<br />
the reportable segments.<br />
Underlying profit<br />
Revenue Operating profit attributable to shareholders Segment assets Segment liabilities<br />
<strong>2011</strong> 2010 <strong>2011</strong> 2010 <strong>2011</strong> 2010 <strong>2011</strong> 2010 <strong>2011</strong> 2010<br />
US$m US$m US$m US$m US$m US$m US$m US$m US$m US$m<br />
By business<br />
Commercial property 804.2 775.3 673.1 649.0 755.9 684.5 22,596.6 18,047.7 (295.1) (309.2)<br />
Residential property 419.5 565.3 209.1 287.1 282.0 432.5 1,835.2 1,465.4 (426.0) (440.3)<br />
Corporate, net financing charges and tax – – (50.5) (54.7) (334.5) (306.8) – – – –<br />
1,223.7 1,340.6 831.7 881.4 703.4 810.2 24,431.8 19,513.1 (721.1) (749.5)<br />
Change in fair value of investment properties – – 4,382.7 3,197.6 – – – – – –<br />
Asset impairment provisions, reversals and disposals – – – 0.1 – – – – – –<br />
1,223.7 1,340.6 5,214.4 4,079.1 703.4 810.2 24,431.8 19,513.1 (721.1 ) (749.5 )<br />
By geographical location<br />
Greater China 937.6 935.9 5,077.0 3,821.3 817.7 761.7 22,754.6 18,081.6 (334.0) (385.3)<br />
Southeast Asia and others 286.1 404.7 187.9 312.5 220.2 355.3 1,677.2 1,431.5 (387.1) (364.2)<br />
Corporate, net financing charges and tax – – (50.5) (54.7) (334.5) (306.8) – – – –<br />
1,223.7 1,340.6 5,214.4 4,079.1 703.4 810.2 24,431.8 19,513.1 (721.1 ) (749.5 )<br />
Operating profit 5,214.4 4,079.1 Segment assets and liabilities 24,431.8 19,513.1 (721.1) (749.5)<br />
Results of associates and joint ventures 298.0 905.3 Investments in associates and joint ventures 3,551.8 3,177.7 – –<br />
Net financing charges and tax (201.0) (199.2) Unallocated assets and liabilities 1,040.0 1,451.7 (3,538.7) (3,915.5)<br />
Profit after tax 5,311.4 4,785.2 Total assets and liabilities 29,023.6 24,142.5 (4,259.8 ) (4,665.0 )<br />
Greater China includes Hong Kong, Macau, mainland China and Taiwan.<br />
Unallocated assets and liabilities include tax assets and liabilities, bank balances and borrowings.<br />
38 <strong>Hongkong</strong> <strong>Land</strong><br />
<strong>Annual</strong> <strong>Report</strong> <strong>2011</strong> 39