Alg 1 TE Lesson 10-8
Alg 1 TE Lesson 10-8
Alg 1 TE Lesson 10-8

Create successful ePaper yourself
Turn your PDF publications into a flip-book with our unique Google optimized e-Paper software.
PowerPoint<br />
Additional Examples<br />
2 Which kind of data best<br />
models the data below? Write<br />
an equation to model the data.<br />
a.<br />
x y<br />
0 0<br />
1 1.4<br />
2 5.6<br />
3 12.6<br />
4 22.4<br />
b.<br />
quadratic; y ≠ 1.4x 2<br />
x<br />
-1 4<br />
0 2<br />
1 1<br />
exponential; y ≠ 2 ? 0.5 x<br />
3 Suppose you are studying deer<br />
that live in an area. The data<br />
below were collected by a local<br />
conservation organization. It<br />
indicates the number of deer<br />
estimated to be living in the area<br />
over a five-year period. Determine<br />
which kind of function best<br />
models the data. Write an<br />
equation to model the data.<br />
exponential; y ≠ 90 ? 0.77 x<br />
Resources<br />
• Daily Notetaking Guide <strong>10</strong>-8<br />
L3<br />
• Daily Notetaking Guide <strong>10</strong>-8—<br />
Adapted Instruction L1<br />
Closure<br />
y<br />
2 0.5<br />
3 0.25<br />
Estimated<br />
Year Population<br />
0 90<br />
1 69<br />
2 52<br />
3 40<br />
4 31<br />
Real-World<br />
Quick Check<br />
Connection<br />
Frog populations around the<br />
world have been declining<br />
over the past 20 years.<br />
2<br />
3<br />
Which kind of function best models the data in each table? Write an equation to<br />
model the data.<br />
a.<br />
x y<br />
b.<br />
x y<br />
c.<br />
x y<br />
0 4<br />
1<br />
0<br />
0 0<br />
2<br />
1 4.4<br />
1 1<br />
1 0.5<br />
2 4.84<br />
1<br />
2 2<br />
2 1<br />
2<br />
3 5.324<br />
3 4.5<br />
3 2<br />
4 5.8564<br />
4 8<br />
exponential; y ≠ 4 ? 1.1 x 1 1<br />
linear; y ≠ x ± quadratic; y ≠– 1 x 2<br />
2 2<br />
2<br />
While real-world data seldom fall exactly into linear, exponential, or quadratic<br />
patterns, you can find a best-possible model.<br />
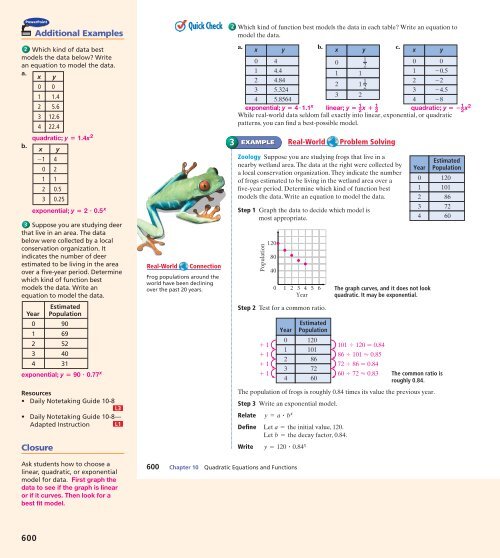
EXAMPLE Real-World Problem Solving<br />
Zoology Suppose you are studying frogs that live in a<br />
nearby wetland area. The data at the right were collected by<br />
a local conservation organization. They indicate the number<br />
of frogs estimated to be living in the wetland area over a<br />
five-year period. Determine which kind of function best<br />
models the data. Write an equation to model the data.<br />
Step 1 Graph the data to decide which model is<br />
most appropriate.<br />
Population<br />
Step 2 Test for a common ratio.<br />
1<br />
1<br />
1<br />
1<br />
120<br />
80<br />
40<br />
0<br />
1 2 3 4 5 6<br />
Year<br />
Year<br />
0<br />
1<br />
2<br />
3<br />
4<br />
Estimated<br />
Population<br />
120<br />
<strong>10</strong>1<br />
86<br />
72<br />
60<br />
The graph curves, and it does not look<br />
quadratic. It may be exponential.<br />
The population of frogs is roughly 0.84 times its value the previous year.<br />
Step 3 Write an exponential model.<br />
Relate y = a ? b x<br />
Define Let a = the initial value, 120.<br />
Let b = the decay factor, 0.84.<br />
Write y = 120 ? 0.84 x<br />
<strong>10</strong>1 120 0.84<br />
86 <strong>10</strong>1 0.85<br />
72 86 0.84<br />
60 72 0.83<br />
Year<br />
0<br />
1<br />
2<br />
3<br />
4<br />
The common ratio is<br />
roughly 0.84.<br />
Estimated<br />
Population<br />
120<br />
<strong>10</strong>1<br />
86<br />
72<br />
60<br />
Ask students how to choose a<br />
linear, quadratic, or exponential<br />
model for data. First graph the<br />
data to see if the graph is linear<br />
or if it curves. Then look for a<br />
best fit model.<br />
600 Chapter <strong>10</strong> Quadratic Equations and Functions<br />
600