Alg 1 TE Lesson 10-8
Alg 1 TE Lesson 10-8
Alg 1 TE Lesson 10-8

Create successful ePaper yourself
Turn your PDF publications into a flip-book with our unique Google optimized e-Paper software.
Math Tip<br />
Exercises 19–24 Remind students<br />
that r is the correlation coefficient.<br />
The nearer r is to 1 or -1, the<br />
more closely the data cluster<br />
around the model. The closer r is<br />
to 1 or - 1, the greater r 2 is.<br />
Also, the TI-83 Plus does not<br />
automatically show r-values for<br />
regressions. This feature, under<br />
catalog, is called DiagnosticsOn,<br />
and needs to be highlighted and<br />
switched on for this to happen.<br />
pages 563–566<br />
16a. p<br />
602<br />
Exercises<br />
linear<br />
18. Answers may vary.<br />
Sample: Linear data<br />
have a common first<br />
difference, quadratic<br />
data have a common<br />
second difference, and<br />
exponential data have a<br />
common ratio.<br />
25a. i. x y<br />
29f.<br />
Population<br />
ii.<br />
iii.<br />
Sales (billions of dollars)<br />
6000<br />
4000<br />
2000<br />
O<br />
1 –2<br />
2 1<br />
3 6<br />
4 13<br />
5 22<br />
x y<br />
1 3<br />
2 12<br />
3 27<br />
4 48<br />
5 75<br />
x y<br />
1 –1<br />
2 6<br />
3 21<br />
4 44<br />
5 75<br />
y<br />
800<br />
700<br />
600<br />
500<br />
400<br />
300<br />
200<br />
<strong>10</strong>0<br />
O<br />
t<br />
4 8 12 16<br />
Year<br />
)3 )2<br />
)5 )2<br />
)7 )2<br />
)9<br />
) 9 )6<br />
)15 )6<br />
)21 )6<br />
)27<br />
) 7 )8<br />
)15 )8<br />
)23 )8<br />
)31<br />
x<br />
5 <strong>10</strong> 15 20<br />
Year<br />
Age<br />
(years)<br />
B<br />
Value<br />
(dollars)<br />
0 16,500<br />
1 14,500<br />
2 12,750<br />
3 11,200<br />
4 9900<br />
Apply Your Skills<br />
16c. 600, 600, 600;<br />
120, 120, 120<br />
Population<br />
Year (millions)<br />
0 4457<br />
5 4855<br />
<strong>10</strong> 5284<br />
15 5691<br />
20 6080<br />
SOURCES: U. S. Census Bureau.<br />
Go to www.PHSchool.com<br />
for a data update.<br />
Web Code: atg-9041<br />
GO<br />
nline<br />
Homework Help<br />
Visit: PHSchool.com<br />
Web Code: ate-<strong>10</strong>08<br />
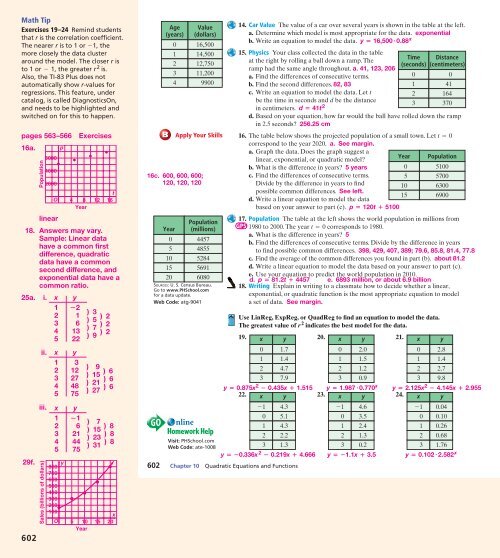
14. Car Value The value of a car over several years is shown in the table at the left.<br />
a. Determine which model is most appropriate for the data. exponential<br />
b. Write an equation to model the data. y ≠ 16,500 ? 0.88 x<br />
15. Physics Your class collected the data in the table<br />
at the right by rolling a ball down a ramp. The<br />
ramp had the same angle throughout. a. 41, 123, 206<br />
a. Find the differences of consecutive terms.<br />
b. Find the second differences. 82, 83<br />
c. Write an equation to model the data. Let t<br />
be the time in seconds and d be the distance<br />
in centimeters. d ≠ 41t 2<br />
d. Based on your equation, how far would the ball have rolled down the ramp<br />
in 2.5 seconds? 256.25 cm<br />
16. The table below shows the projected population of a small town. Let t = 0<br />
correspond to the year 2020. a. See margin.<br />
a. Graph the data. Does the graph suggest a<br />
linear, exponential, or quadratic model?<br />
Year Population<br />
b. What is the difference in years? 5 years<br />
0 5<strong>10</strong>0<br />
c. Find the differences of consecutive terms.<br />
5 5700<br />
Divide by the difference in years to find<br />
<strong>10</strong> 6300<br />
possible common differences. See left.<br />
15 6900<br />
d. Write a linear equation to model the data<br />
based on your answer to part (c). p ≠ 120t ± 5<strong>10</strong>0<br />
17. Population The table at the left shows the world population in millions from<br />
GPS 1980 to 2000. The year t = 0 corresponds to 1980.<br />
a. What is the difference in years? 5<br />
b. Find the differences of consecutive terms. Divide by the difference in years<br />
to find possible common differences. 398, 429, 407, 389; 79.6, 85.8, 81.4, 77.8<br />
c. Find the average of the common differences you found in part (b). about 81.2<br />
d. Write a linear equation to model the data based on your answer to part (c).<br />
e. Use your equation to predict the world population in 20<strong>10</strong>.<br />
d. p ≠ 81.2t ± 4457 e. 6893 million, or about 6.9 billion<br />
18. Writing Explain in writing to a classmate how to decide whether a linear,<br />
exponential, or quadratic function is the most appropriate equation to model<br />
a set of data. See margin.<br />
Use LinReg, ExpReg, or QuadReg to find an equation to model the data.<br />
The greatest value of r 2 indicates the best model for the data.<br />
19. x y 20. x y 21. x y<br />
0 1.7<br />
1 1.4<br />
2 4.7<br />
3<br />
y ≠ 0.875x 2 – 0.435x ± 1.515 y ≠ 1.987 ? 0.770 x y ≠ 2.125x 2 – 4.145x ± 2.955<br />
22. x y 23. x y 24. x y<br />
1<br />
7.9<br />
4.3<br />
0 5.1<br />
1 4.3<br />
2 2.2<br />
0 2.0<br />
1 1.5<br />
2 1.2<br />
3<br />
1<br />
0 3.5<br />
3 1.3<br />
3 0.2<br />
3 1.76<br />
y ≠–0.336x 2 – 0.219x ± 4.666 y ≠–1.1x ± 3.5 y ≠ 0.<strong>10</strong>2 ? 2.582 x<br />
602 Chapter <strong>10</strong> Quadratic Equations and Functions<br />
0.9<br />
4.6<br />
1 2.4<br />
2 1.3<br />
Time<br />
(seconds)<br />
0 0<br />
1 41<br />
2 164<br />
3 370<br />
0 2.8<br />
1 1.4<br />
2 2.7<br />
3<br />
1<br />
Distance<br />
(centimeters)<br />
9.8<br />
0.04<br />
0 0.<strong>10</strong><br />
1 0.26<br />
2 0.68