Alg 1 TE Lesson 10-8
Alg 1 TE Lesson 10-8
Alg 1 TE Lesson 10-8

Create successful ePaper yourself
Turn your PDF publications into a flip-book with our unique Google optimized e-Paper software.
Test Prep<br />
Resources<br />
For additional practice with a<br />
variety of test item formats:<br />
• Standardized Test Prep, p. 611<br />
• Test-Taking Strategies, p. 606<br />
• Test-Taking Strategies with<br />
Transparencies<br />
Exercise 31 Remind students that<br />
the y-coordinates of an exponential<br />
model have a common ratio. After<br />
determining that the x-coordinates<br />
are written in sequential order<br />
with a common difference,<br />
students just need to check the<br />
first three y-coordinates of each<br />
set of data to find the set with a<br />
common ratio.<br />
pages 601–604 Exercises<br />
33. [4] a. linear<br />
b. d ≠–2.5n ± 43.5<br />
c. 18<br />
[3] appropriate methods,<br />
but with one<br />
computational error<br />
[2] part (c) not answered<br />
[1] no work shown<br />
37.<br />
O y<br />
2<br />
x<br />
2<br />
Standardized Test Prep Test Prep<br />
Multiple Choice<br />
Short Response<br />
Extended Response<br />
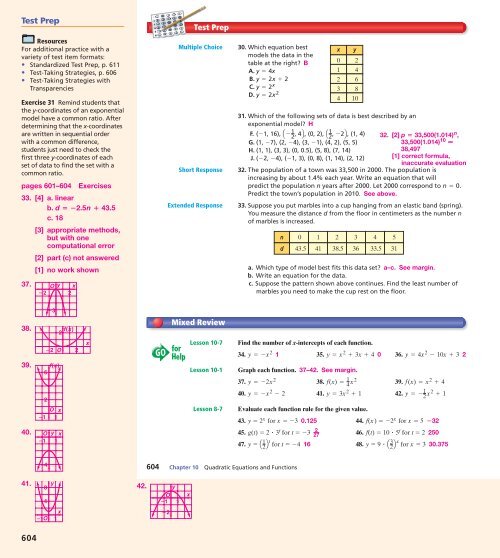
30. Which equation best<br />
models the data in the<br />
table at the right? B<br />
A. y = 4x<br />
B. y = 2x + 2<br />
C. y = 2 x<br />
D. y = 2x 2<br />
31. Which of the following sets of data is best described by an<br />
exponential model? H<br />
F. (-1, 16), Q2<br />
1<br />
2<br />
, 4 R, (0, 2), Q 1 2<br />
, -2 R, (1, 4) 32. [2] p ≠ 33,500(1.014) n ,<br />
G. (1, -7), (2, -4), (3, -1), (4, 2), (5, 5)<br />
33,500(1.014) <strong>10</strong> N<br />
H. (1, 1), (3, 3), (0, 0.5), (5, 8), (7, 14)<br />
38,497<br />
J. (-2, -4), (-1, 3), (0, 8), (1, 14), (2, 12) [1] correct formula,<br />
inaccurate evaluation<br />
32. The population of a town was 33,500 in 2000. The population is<br />
increasing by about 1.4% each year. Write an equation that will<br />
predict the population n years after 2000. Let 2000 correspond to n = 0.<br />
Predict the town’s population in 20<strong>10</strong>. See above.<br />
33. Suppose you put marbles into a cup hanging from an elastic band (spring).<br />
You measure the distance d from the floor in centimeters as the number n<br />
of marbles is increased.<br />
n 0<br />
d 43.5<br />
1<br />
41<br />
x<br />
0<br />
1<br />
2<br />
2<br />
38.5<br />
a. Which type of model best fits this data set? a–c. See margin.<br />
b. Write an equation for the data.<br />
c. Suppose the pattern shown above continues. Find the least number of<br />
marbles you need to make the cup rest on the floor.<br />
y<br />
2<br />
4<br />
6<br />
3 8<br />
4 <strong>10</strong><br />
3<br />
36<br />
4<br />
33.5<br />
5<br />
31<br />
3<br />
38.<br />
f(x)<br />
2<br />
Mixed Review<br />
39.<br />
2 O 2<br />
f(x)<br />
6<br />
2<br />
O x<br />
1 1<br />
x<br />
GO<br />
for<br />
Help<br />
<strong>Lesson</strong> <strong>10</strong>-7<br />
<strong>Lesson</strong> <strong>10</strong>-1<br />
<strong>Lesson</strong> 8-7<br />
Find the number of x-intercepts of each function.<br />
34. y =-x 2 1 35. y = x 2 + 3x + 4 0 36. y = 4x 2 - <strong>10</strong>x + 3 2<br />
Graph each function. 37–42. See margin.<br />
37. y =-2x 2 38. f(x) =<br />
1<br />
4<br />
x 2 39. f(x) = x 2 + 4<br />
40. y =-x 2 - 2 41. y = 3x 2 + 1 42. y =-<br />
1<br />
2<br />
x 2 + 1<br />
Evaluate each function rule for the given value.<br />
43. y = 2 x for x =-3 0.125 44. f(x) =-2 x for x = 5 –32<br />
40.<br />
O y x<br />
1 1<br />
45. g(t) = 2 ? 3 t 2<br />
for t =-3 46. f(t) = <strong>10</strong> ? 5 t 27<br />
for t = 2 250<br />
47. y = Q 1 2 Rt for t =-4 16 48. y = 9 ? Q 3 2 Rx for x = 3 30.375<br />
4<br />
604 Chapter <strong>10</strong> Quadratic Equations and Functions<br />
41.<br />
8<br />
4<br />
y<br />
42.<br />
y<br />
O<br />
1 1<br />
x<br />
x<br />
1O<br />
1<br />
2<br />
604