2011T12 ANNUAL BUDGET - Granite School District
2011T12 ANNUAL BUDGET - Granite School District
2011T12 ANNUAL BUDGET - Granite School District

You also want an ePaper? Increase the reach of your titles
YUMPU automatically turns print PDFs into web optimized ePapers that Google loves.
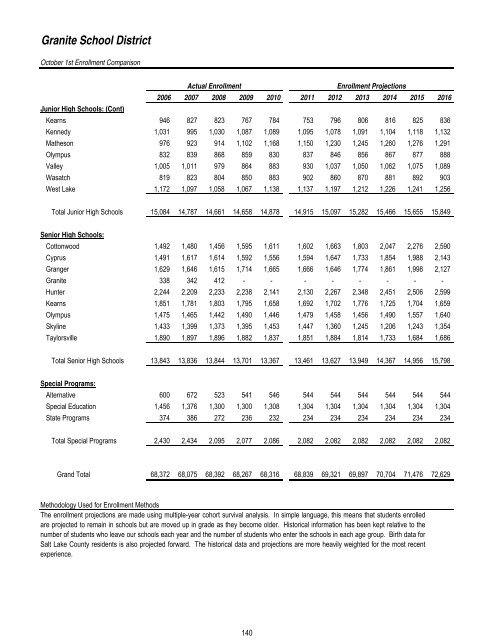
<strong>Granite</strong> <strong>School</strong> <strong>District</strong><br />
October 1st Enrollment Comparison<br />
Actual Enrollment<br />
Enrollment Projections<br />
2006 2007 2008 2009 2010 2011 2012 2013 2014 2015 2016<br />
Junior High <strong>School</strong>s: (Cont)<br />
Kearns 946 827 823 767 784 753 796 806 816 825 836<br />
Kennedy 1,031 995 1,030 1,087 1,089 1,095 1,078 1,091 1,104 1,118 1,132<br />
Matheson 976 923 914 1,102 1,168 1,150 1,230 1,245 1,260 1,276 1,291<br />
Olympus 832 839 868 859 830 837 846 856 867 877 888<br />
Valley 1,005 1,011 979 864 883 930 1,037 1,050 1,062 1,075 1,089<br />
Wasatch 819 823 804 850 883 902 860 870 881 892 903<br />
West Lake 1,172 1,097 1,058 1,067 1,138 1,137 1,197 1,212 1,226 1,241 1,256<br />
Total Junior High <strong>School</strong>s 15,084 14,787 14,661 14,658 14,878 14,915 15,097 15,282 15,466 15,655 15,849<br />
Senior High <strong>School</strong>s:<br />
Cottonwood 1,492 1,480 1,456 1,595 1,611 1,602 1,663 1,803 2,047 2,276 2,590<br />
Cyprus 1,491 1,617 1,614 1,592 1,556 1,594 1,647 1,733 1,854 1,988 2,143<br />
Granger 1,629 1,646 1,615 1,714 1,665 1,666 1,646 1,774 1,861 1,998 2,127<br />
<strong>Granite</strong> 338 342 412 - - - - - - - -<br />
Hunter 2,244 2,209 2,233 2,238 2,141 2,130 2,267 2,348 2,451 2,506 2,599<br />
Kearns 1,851 1,781 1,803 1,795 1,658 1,692 1,702 1,776 1,725 1,704 1,659<br />
Olympus 1,475 1,465 1,442 1,490 1,446 1,479 1,458 1,456 1,490 1,557 1,640<br />
Skyline 1,433 1,399 1,373 1,395 1,453 1,447 1,360 1,245 1,206 1,243 1,354<br />
Taylorsville 1,890 1,897 1,896 1,882 1,837 1,851 1,884 1,814 1,733 1,684 1,686<br />
Total Senior High <strong>School</strong>s 13,843 13,836 13,844 13,701 13,367 13,461 13,627 13,949 14,367 14,956 15,798<br />
Special Programs:<br />
Alternative 600 672 523 541 546 544 544 544 544 544 544<br />
Special Education 1,456 1,376 1,300 1,300 1,308 1,304 1,304 1,304 1,304 1,304 1,304<br />
State Programs 374 386 272 236 232 234 234 234 234 234 234<br />
Total Special Programs 2,430 2,434 2,095 2,077 2,086 2,082 2,082 2,082 2,082 2,082 2,082<br />
Grand Total 68,372 68,075 68,392 68,267 68,316 68,839 69,321 69,897 70,704 71,476 72,629<br />
Methodology Used for Enrollment Methods<br />
The enrollment projections are made using multiple-year cohort survival analysis. In simple language, this means that students enrolled<br />
are projected to remain in schools but are moved up in grade as they become older. Historical information has been kept relative to the<br />
number of students who leave our schools each year and the number of students who enter the schools in each age group. Birth data for<br />
Salt Lake County residents is also projected forward. The historical data and projections are more heavily weighted for the most recent<br />
experience.<br />
140