2011T12 ANNUAL BUDGET - Granite School District
2011T12 ANNUAL BUDGET - Granite School District
2011T12 ANNUAL BUDGET - Granite School District

Create successful ePaper yourself
Turn your PDF publications into a flip-book with our unique Google optimized e-Paper software.
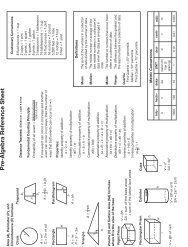
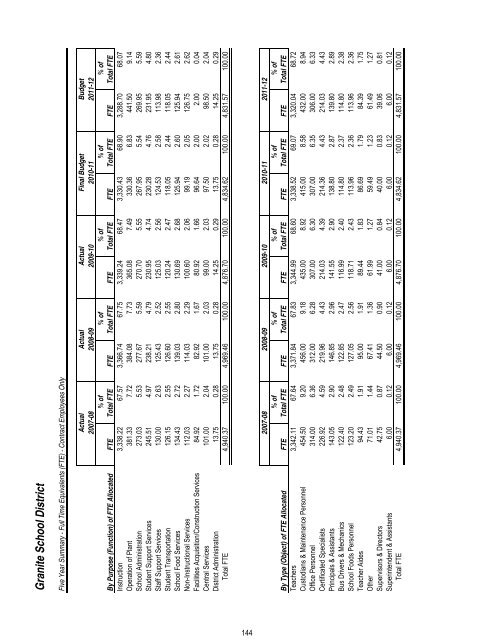
<strong>Granite</strong> <strong>School</strong> <strong>District</strong><br />
Five Year Summary - Full Time Equivalents (FTE) - Contract Employees Only<br />
Actual Actual Actual Final Budget Budget<br />
2007-08 2008-09 2009-10 2010-11 2011-12<br />
By Purpose (Function) of FTE Allocated FTE % of<br />
Total FTE FTE % of<br />
Total FTE FTE % of<br />
Total FTE FTE % of<br />
Total FTE FTE % of<br />
Total FTE<br />
Instruction 3,338.22 67.57 3,366.74 67.75 3,339.24 68.47 3,330.43 68.90 3,288.70 68.07<br />
Operation of Plant 381.33 7.72 384.08 7.73 365.08 7.49 330.36 6.83 441.50 9.14<br />
<strong>School</strong> Administration 273.03 5.53 277.67 5.59 270.70 5.55 267.95 5.54 269.95 5.59<br />
Student Support Services 245.51 4.97 238.21 4.79 230.95 4.74 230.28 4.76 231.95 4.80<br />
Staff Support Services 130.00 2.63 125.43 2.52 125.03 2.56 124.53 2.58 113.98 2.36<br />
Student Transportation 126.15 2.55 126.60 2.55 120.24 2.47 118.05 2.44 118.05 2.44<br />
<strong>School</strong> Food Services 134.43 2.72 139.03 2.80 130.69 2.68 125.94 2.60 125.94 2.61<br />
Non-Instructional Services 112.03 2.27 114.03 2.29 100.60 2.06 99.19 2.05 126.75 2.62<br />
Facilities Acquisition/Construction Services 84.92 1.72 82.92 1.67 80.92 1.66 96.64 2.00 2.00 0.04<br />
Central Services 101.00 2.04 101.00 2.03 99.00 2.03 97.50 2.02 98.50 2.04<br />
<strong>District</strong> Administration 13.75 0.28 13.75 0.28 14.25 0.29 13.75 0.28 14.25 0.29<br />
Total FTE 4,940.37 100.00 4,969.46 100.00 4,876.70 100.00 4,834.62 100.00 4,831.57 100.00<br />
144<br />
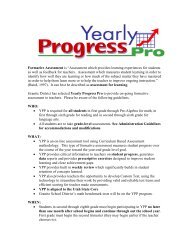
2007-08 2008-09 2009-10 2010-11 2011-12<br />
By Type (Object) of FTE Allocated FTE % of<br />
Total FTE FTE % of<br />
Total FTE FTE % of<br />
Total FTE FTE % of<br />
Total FTE FTE % of<br />
Total FTE<br />
Teachers 3,342.11 67.64 3,371.84 67.83 3,344.99 68.60 3,338.52 69.07 3,320.04 68.72<br />
Custodians & Maintenance Personnel 454.50 9.20 456.00 9.18 435.00 8.92 415.00 8.58 432.00 8.94<br />
Office Personnel 314.00 6.36 312.00 6.28 307.00 6.30 307.00 6.35 306.00 6.33<br />
Certificated Specialists 226.92 4.59 219.96 4.43 214.03 4.39 214.36 4.43 214.03 4.43<br />
Principals & Assistants 143.05 2.90 146.85 2.96 141.55 2.90 138.80 2.87 139.80 2.89<br />
Bus Drivers & Mechanics 122.40 2.48 122.85 2.47 116.99 2.40 114.80 2.37 114.80 2.38<br />
<strong>School</strong> Foods Personnel 123.20 2.49 127.05 2.56 118.71 2.43 113.96 2.36 113.96 2.36<br />
Teacher Aides 94.43 1.91 95.00 1.91 89.44 1.83 86.69 1.79 84.39 1.75<br />
Other 71.01 1.44 67.41 1.36 61.99 1.27 59.49 1.23 61.49 1.27<br />
Supervisors & Directors 42.75 0.87 44.50 0.90 41.00 0.84 40.00 0.83 39.06 0.81<br />
Superintendent & Assistants 6.00 0.12 6.00 0.12 6.00 0.12 6.00 0.12 6.00 0.12<br />
Total FTE 4,940.37 100.00 4,969.46 100.00 4,876.70 100.00 4,834.62 100.00 4,831.57 100.00