Annual Report and Financial Statements 2010/11 - Hanover
Annual Report and Financial Statements 2010/11 - Hanover
Annual Report and Financial Statements 2010/11 - Hanover

You also want an ePaper? Increase the reach of your titles
YUMPU automatically turns print PDFs into web optimized ePapers that Google loves.
Cash flow<br />
The net cash outflow in 20<strong>11</strong> was £1.8m (<strong>2010</strong>:<br />
£1.2m). The net cash inflow from operating activities<br />
of £29.4m (<strong>2010</strong>: £31.2m) decreased slightly year on<br />
year due to working capital movements <strong>and</strong> changes<br />
to provisions mostly netting off the increase in<br />
operating surplus. Note 26 to the financial statements<br />
contains the detailed cash flow disclosures.<br />
Accounting policies<br />
The Group’s accounting policies are set out in note 1<br />
to the financial statements.<br />
Statement of compliance<br />
In preparing this operating <strong>and</strong> financial review, the Board<br />
has followed the principles set out in Part 3 of the SORP<br />
‘Accounting by Registered Social L<strong>and</strong>lords (Update 2008)’.<br />
Fixed assets<br />
Details of fixed assets are shown in notes 10 <strong>and</strong> <strong>11</strong><br />
of the financial statements.<br />
Housing properties are included on the balance sheet at<br />
a net book value (gross historical cost less depreciation,<br />
Social Housing Grant <strong>and</strong> other public grants) of<br />
£271m (<strong>2010</strong>: £264m). The Board believes that the<br />
current market value of these properties is significantly<br />
in excess of their net book value. This belief is based<br />
on rolling valuations of large elements of the portfolio,<br />
coupled with the Group’s planned maintenance<br />
programme based on stock condition surveys. The Group<br />
maintains its properties to a high st<strong>and</strong>ard <strong>and</strong> the<br />
Board does not believe that any of its existing properties<br />
have suffered from any impairment during the year.<br />
Post balance sheet events<br />
The Board has no post balance sheet events to report.<br />
Going concern<br />
After completing a financial business plan <strong>and</strong> making<br />
enquiries, the directors of the Group have a reasonable<br />
expectation that the Group has adequate resources to<br />
continue in operational existence for the foreseeable<br />
future. For this reason the going concern basis has<br />
been adopted in these financial statements.<br />
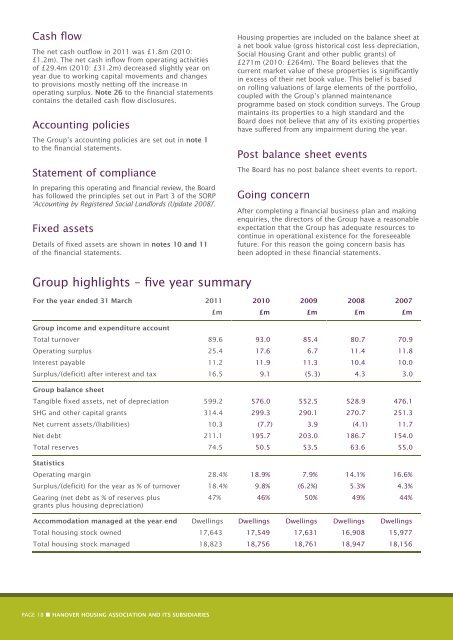
Group highlights – five year summary<br />
For the year ended 31 March 20<strong>11</strong><br />
<strong>2010</strong><br />
2009<br />
2008<br />
2007<br />
£m<br />
£m<br />
£m<br />
£m<br />
£m<br />
Group income <strong>and</strong> expenditure account<br />
Total turnover 89.6 93.0 85.4 80.7 70.9<br />
Operating surplus 25.4 17.6 6.7 <strong>11</strong>.4 <strong>11</strong>.8<br />
Interest payable <strong>11</strong>.2 <strong>11</strong>.9 <strong>11</strong>.3 10.4 10.0<br />
Surplus/(deficit) after interest <strong>and</strong> tax 16.5 9.1 (5.3) 4.3 3.0<br />
Group balance sheet<br />
Tangible fixed assets, net of depreciation 599.2 576.0 552.5 528.9 476.1<br />
SHG <strong>and</strong> other capital grants 314.4 299.3 290.1 270.7 251.3<br />
Net current assets/(liabilities) 10.3 (7.7) 3.9 (4.1) <strong>11</strong>.7<br />
Net debt 2<strong>11</strong>.1 195.7 203.0 186.7 154.0<br />
Total reserves 74.5 50.5 53.5 63.6 55.0<br />
Statistics<br />
Operating margin 28.4% 18.9% 7.9% 14.1% 16.6%<br />
Surplus/(deficit) for the year as % of turnover 18.4% 9.8% (6.2%) 5.3% 4.3%<br />
Gearing (net debt as % of reserves plus<br />
grants plus housing depreciation)<br />
47% 46% 50% 49% 44%<br />
Accommodation managed at the year end Dwellings Dwellings Dwellings Dwellings Dwellings<br />
Total housing stock owned 17,643 17,549 17,631 16,908 15,977<br />
Total housing stock managed 18,823 18,756 18,761 18,947 18,156<br />
PAGE 18 • HANOVER HOUSING ASSOCIATION AND ITS SUBSIDIARIES